
GDP and the Economy
Third Estimates for the Second Quarter of 2018
Real gross domestic product (GDP) increased at an annual rate of 4.2 percent in the second quarter of 2018, according to the third estimates of the National Income and Product Accounts (NIPAs) (chart 1 and table 1, line 1).1 The third estimate of real GDP growth was unrevised from the second estimate, and the general picture of economic growth remains the same. Small upward revisions to most other GDP components were offset by a downward revision to inventory investment. Imports, which are a subtraction in the calculation of GDP, were revised down slightly.2 In the first quarter, real GDP increased 2.2 percent.
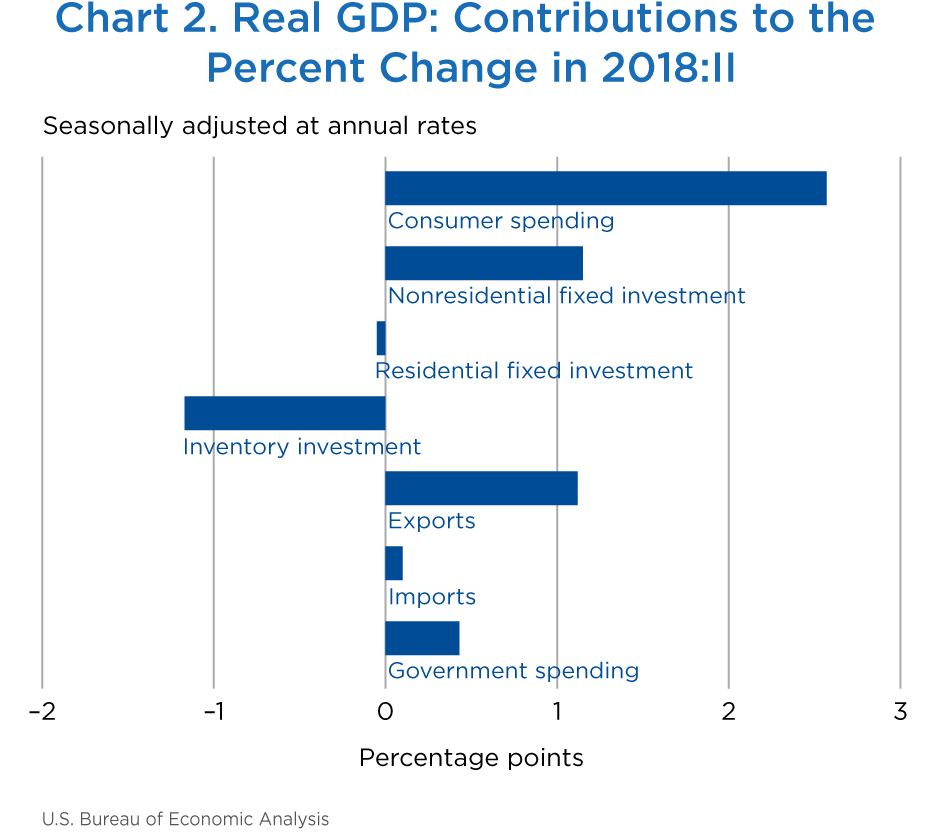
The increase in real GDP in the second quarter reflected positive contributions from consumer spending, nonresidential fixed investment, exports, federal government spending, and state and local government spending. These positive contributions were partly offset by negative contributions from inventory investment and from residential fixed investment (chart 2). Imports, a subtraction in the calculation of GDP, decreased.

[Click chart to expand]
[Click chart to expand]
The acceleration in real GDP growth in the second quarter reflected accelerations in consumer spending, exports, state and local government spending, and federal government spending as well as a smaller decrease in residential fixed investment. These movements were partly offset by a downturn in private inventory investment and a deceleration in nonresidential fixed investment. Imports decreased in the second quarter after increasing in the first quarter.
- The acceleration in consumer spending (table 1, line 2) reflected an upturn in spending on goods and an acceleration in spending on services.
- The upturn in goods (line 3) reflected an upturn in durable goods (mainly motor vehicles and parts) and an acceleration in nondurable goods (mainly due to an upturn in clothing and footwear).
- The main contributors to the acceleration in services (line 6) were an upturn in spending on “other” services and accelerations in food services and accommodations and in housing and utilities. The upturns in “other” services were mainly in personal care and clothing services, in social services and religious activities, and in professional and “other” services.
- The deceleration in nonresidential fixed investment (line 9) primarily reflected decelerations in equipment (mainly due to a deceleration in transportation equipment and a downturn in industrial equipment) and in intellectual property products (mainly software).
- The smaller decrease in residential fixed investment reflected an upturn in investment in “other” structures (mainly improvements) and a smaller decrease in multi-family structures that were partly offset by a downturn in investment in single-family structures.
- The downturn in private inventory investment (line 14) mainly reflected a downturn in wholesale trade industries (primarily nondurable goods).
- The acceleration in exports (line 16) reflected an acceleration in exports of goods that was partly offset by a deceleration in exports of services.
- The acceleration in exports of goods (line 17) primarily reflected an upturn in exports of industrial supplies and materials (mainly petroleum and products) and an acceleration in foods, feeds, and beverages (notably, soybeans).
- Real gross domestic income (line 27), which measures the output of the economy as the incomes earned and costs incurred in the production of goods and services (as measured by GDP), increased 1.6 percent in the second quarter after increasing 3.9 percent in the first quarter.
| Line | Share of current-dollar GDP (percent) | Change from preceding period (percent) | Contribution to percent change in real GDP (percentage points) | ||||||||
|---|---|---|---|---|---|---|---|---|---|---|---|
| 2018 | 2017 | 2018 | 2017 | 2018 | |||||||
| II | III | IV | I | II | III | IV | I | II | |||
| 1 | Gross domestic product1 | 100.0 | 2.8 | 2.3 | 2.2 | 4.2 | 2.8 | 2.3 | 2.2 | 4.2 | |
| 2 | Personal consumption expenditures | 68.0 | 2.2 | 3.9 | 0.5 | 3.8 | 1.52 | 2.64 | 0.36 | 2.57 | |
| 3 | Goods | 21.2 | 4.1 | 6.8 | −0.6 | 5.5 | 0.86 | 1.42 | −0.13 | 1.16 | |
| 4 | Durable goods | 7.1 | 7.7 | 12.7 | −2.0 | 8.6 | 0.54 | 0.87 | −0.15 | 0.60 | |
| 5 | Nondurable goods | 14.1 | 2.3 | 4.0 | 0.1 | 4.0 | 0.32 | 0.55 | 0.02 | 0.56 | |
| 6 | Services | 46.8 | 1.4 | 2.6 | 1.0 | 3.0 | 0.65 | 1.22 | 0.49 | 1.42 | |
| 7 | Gross private domestic investment | 17.5 | 8.8 | 0.8 | 9.6 | −0.5 | 1.47 | 0.14 | 1.61 | −0.07 | |
| 8 | Fixed investment | 17.6 | 2.6 | 6.2 | 8.0 | 6.4 | 0.44 | 1.04 | 1.34 | 1.10 | |
| 9 | Nonresidential | 13.7 | 3.4 | 4.8 | 11.5 | 8.7 | 0.45 | 0.63 | 1.47 | 1.15 | |
| 10 | Structures | 3.2 | −5.7 | 1.3 | 13.9 | 14.5 | −0.18 | 0.04 | 0.40 | 0.43 | |
| 11 | Equipment | 6.0 | 9.8 | 9.9 | 8.5 | 4.6 | 0.56 | 0.56 | 0.49 | 0.27 | |
| 12 | Intellectual property products | 4.5 | 1.7 | 0.7 | 14.1 | 10.5 | 0.08 | 0.03 | 0.58 | 0.45 | |
| 13 | Residential | 3.9 | −0.5 | 11.1 | −3.4 | −1.3 | −0.02 | 0.41 | −0.14 | −0.05 | |
| 14 | Change in private inventories | −0.1 | ...... | ...... | ...... | ...... | 1.04 | −0.91 | 0.27 | −1.17 | |
| 15 | Net exports of goods and services | −2.7 | ...... | ...... | ...... | ...... | 0.01 | −0.89 | −0.02 | 1.22 | |
| 16 | Exports | 12.6 | 3.5 | 6.6 | 3.6 | 9.3 | 0.42 | 0.79 | 0.43 | 1.12 | |
| 17 | Goods | 8.4 | 2.1 | 10.9 | 3.2 | 13.5 | 0.17 | 0.83 | 0.26 | 1.06 | |
| 18 | Services | 4.2 | 6.3 | −1.0 | 4.2 | 1.5 | 0.25 | −0.04 | 0.18 | 0.07 | |
| 19 | Imports | 15.3 | 2.8 | 11.8 | 3.0 | −0.6 | −0.41 | −1.68 | −0.45 | 0.10 | |
| 20 | Goods | 12.4 | 2.5 | 14.2 | 2.4 | −0.4 | −0.29 | −1.62 | −0.30 | 0.06 | |
| 21 | Services | 2.9 | 4.4 | 2.0 | 5.5 | −1.4 | −0.12 | −0.06 | −0.15 | 0.04 | |
| 22 | Government consumption expenditures and gross investment | 17.2 | −1.0 | 2.4 | 1.5 | 2.5 | −0.18 | 0.41 | 0.27 | 0.43 | |
| 23 | Federal | 6.4 | −1.3 | 4.1 | 2.6 | 3.7 | −0.08 | 0.26 | 0.17 | 0.24 | |
| 24 | National defense | 3.8 | −2.9 | 2.9 | 3.0 | 5.9 | −0.11 | 0.11 | 0.11 | 0.22 | |
| 25 | Nondefense | 2.6 | 1.1 | 5.7 | 2.1 | 0.5 | 0.03 | 0.15 | 0.06 | 0.01 | |
| 26 | State and local | 10.7 | −0.9 | 1.4 | 0.9 | 1.8 | −0.10 | 0.15 | 0.10 | 0.20 | |
| Addenda: | |||||||||||
| 27 | Gross domestic income (GDI)2 | ...... | 1.3 | 1.5 | 3.9 | 1.6 | ...... | ...... | ...... | ...... | |
| 28 | Average of GDP and GDI | ...... | 2.0 | 1.9 | 3.1 | 2.9 | ...... | ...... | ...... | ...... | |
| 29 | Final sales of domestic product | ...... | 1.8 | 3.2 | 1.9 | 5.4 | 1.79 | 3.20 | 1.94 | 5.33 | |
| 30 | Goods | 29.4 | 8.4 | 1.1 | 4.1 | 6.5 | 2.40 | 0.34 | 1.20 | 1.91 | |
| 31 | Services | 62.0 | 1.2 | 2.1 | 1.2 | 2.9 | 0.74 | 1.32 | 0.73 | 1.78 | |
| 32 | Structures | 8.6 | −3.7 | 7.9 | 3.4 | 5.5 | −0.32 | 0.64 | 0.28 | 0.47 | |
| 33 | Motor vehicle output | 2.7 | −3.8 | 23.2 | 9.5 | −5.8 | −0.10 | 0.58 | 0.26 | −0.17 | |
- The GDP estimates under the contribution columns are also percent changes.
- GDI is deflated by the implicit price deflator for GDP.
Note. Percent changes are from NIPA tables 1.1.1 and 1.2.1, contributions are from NIPA tables 1.1.2 and 1.2.2, and shares are from NIPA table 1.1.10 or are calculated from NIPA table 1.2.5.
Prices for gross domestic purchases—goods and services purchased by U.S. residents—increased 2.4 percent in the second quarter after increasing 2.5 percent in the first quarter (table 2, line 1, and chart 3). The deceleration primarily reflected a deceleration in the prices paid for consumer nondurable goods (line 5) that was partly offset by an acceleration in the prices paid for nonresidential fixed investment (line 9).
The main contributors to the deceleration in consumer nondurable goods prices were decelerations in gasoline and other energy goods as well as clothing and footwear.
All subcomponents contributed to the acceleration in the prices paid for nonresidential fixed investment.
Consumer prices excluding food and energy (line 25), a measure of the “core” rate of inflation, decelerated, increasing 2.1 percent in the second quarter after increasing 2.2 percent in the first quarter.
The GDP price index accelerated in the second quarter, increasing 3.0 percent (line 26) after increasing 2.0 percent in the first quarter. The movement in the GDP price index differs from the movement in the gross domestic purchases price index because of the changes in import and in export prices. Import prices, which are included in gross domestic purchases and excluded from GDP, decelerated, increasing 0.8 percent in the second quarter after increasing 7.3 percent in the first quarter. Export prices, which are included in GDP and excluded from gross domestic purchases, accelerated, increasing 5.8 percent in the second quarter after increasing 4.0 percent in the first quarter.

[Click chart to expand]
| Line | Change from preceding period (percent) | Contribution to percent change in gross domestic purchases prices (percentage points) | ||||||||
|---|---|---|---|---|---|---|---|---|---|---|
| 2017 | 2018 | 2017 | 2018 | |||||||
| III | IV | I | II | III | IV | I | II | |||
| 1 | Gross domestic purchases1 | 1.8 | 2.6 | 2.5 | 2.4 | 1.8 | 2.6 | 2.5 | 2.4 | |
| 2 | Personal consumption expenditures | 1.6 | 2.7 | 2.5 | 2.0 | 1.06 | 1.81 | 1.63 | 1.32 | |
| 3 | Goods | 0.7 | 1.5 | 2.2 | 0.4 | 0.14 | 0.30 | 0.46 | 0.08 | |
| 4 | Durable goods | −2.4 | −2.2 | −1.1 | −1.6 | −0.17 | −0.16 | −0.07 | −0.11 | |
| 5 | Nondurable goods | 2.3 | 3.4 | 3.9 | 1.4 | 0.31 | 0.46 | 0.53 | 0.19 | |
| 6 | Services | 2.0 | 3.3 | 2.6 | 2.7 | 0.91 | 1.50 | 1.17 | 1.24 | |
| 7 | Gross private domestic investment | 1.9 | 1.3 | 2.5 | 3.1 | 0.33 | 0.22 | 0.42 | 0.53 | |
| 8 | Fixed investment | 2.0 | 1.2 | 2.5 | 3.2 | 0.34 | 0.21 | 0.42 | 0.53 | |
| 9 | Nonresidential | 1.3 | 0.7 | 0.7 | 2.0 | 0.17 | 0.09 | 0.09 | 0.26 | |
| 10 | Structures | 3.9 | 2.3 | 3.2 | 5.1 | 0.11 | 0.07 | 0.09 | 0.15 | |
| 11 | Equipment | −0.5 | −0.5 | −0.3 | 0.8 | −0.03 | −0.03 | −0.02 | 0.05 | |
| 12 | Intellectual property products | 2.0 | 1.2 | 0.4 | 1.4 | 0.09 | 0.05 | 0.02 | 0.06 | |
| 13 | Residential | 4.5 | 3.1 | 8.8 | 7.3 | 0.17 | 0.11 | 0.32 | 0.27 | |
| 14 | Change in private inventories | ...... | ...... | ...... | ...... | 0.00 | 0.02 | 0.01 | −0.01 | |
| 15 | Government consumption expenditures and gross investment | 2.5 | 3.2 | 2.9 | 3.3 | 0.42 | 0.53 | 0.48 | 0.55 | |
| 16 | Federal | 1.2 | 1.3 | 1.8 | 2.0 | 0.08 | 0.08 | 0.11 | 0.13 | |
| 17 | National defense | 1.0 | 1.2 | 1.4 | 1.3 | 0.04 | 0.05 | 0.05 | 0.05 | |
| 18 | Nondefense | 1.5 | 1.4 | 2.4 | 3.0 | 0.04 | 0.04 | 0.06 | 0.08 | |
| 19 | State and local | 3.4 | 4.4 | 3.6 | 4.1 | 0.35 | 0.45 | 0.37 | 0.42 | |
| Addenda: | ||||||||||
| Gross domestic purchases: | ||||||||||
| 20 | Food | 0.3 | 0.1 | 0.4 | 1.1 | 0.01 | 0.01 | 0.02 | 0.05 | |
| 21 | Energy goods and services | 8.5 | 24.9 | 12.6 | 0.4 | 0.21 | 0.61 | 0.33 | 0.01 | |
| 22 | Excluding food and energy | 1.7 | 2.1 | 2.4 | 2.5 | 1.59 | 1.95 | 2.19 | 2.33 | |
| Personal consumption expenditures: | ||||||||||
| 23 | Food and beverages purchased for off-premises consumption | 0.3 | 0.2 | 0.2 | 1.2 | ...... | ...... | ...... | ...... | |
| 24 | Energy goods and services | 8.3 | 24.1 | 12.7 | 0.7 | ...... | ...... | ...... | ...... | |
| 25 | Excluding food and energy | 1.4 | 2.1 | 2.2 | 2.1 | ...... | ...... | ...... | ...... | |
| 26 | Gross domestic product | 2.2 | 2.5 | 2.0 | 3.0 | ...... | ...... | ...... | ...... | |
| 27 | Exports of goods and services | 3.8 | 6.1 | 4.0 | 5.8 | ...... | ...... | ...... | ...... | |
| 28 | Imports of goods and services | 1.0 | 5.7 | 7.3 | 0.8 | ...... | ...... | ...... | ...... | |
- The estimated prices for gross domestic purchases under the contribution columns are also percent changes.
Note. Most percent changes are from NIPA table 1.6.7; percent changes for PCE for food and energy goods and services and for PCE excluding food and energy are from NIPA table 2.3.7. Contributions are from NIPA table 1.6.8. GDP, export, and import prices are from NIPA table 1.1.7.
With the third estimates, real GDP increased 4.2 percent in the second quarter, the same rate of increase as in the second estimate released last month. Consumer spending on goods and state and local government investment grew more than previously estimated. Imports, a subtraction in the calculation of GDP, were revised down. These revisions were offset by a downward revision to inventory investment.
- The upward revision to consumer spending on goods was mostly accounted for by gasoline and other energy goods.
- The upward revision to state and local government investment was primarily accounted for by structures.
- The downward revision to imports was primarily accounted for by services, specifically “other” business services led by telecommunication, computer, and information services and by insurance services.
- The revision to inventory investment reflected a downward revision to nonfarm inventory investment (mostly accounted for by information industries, which is a component of “other” industries).
- Real gross domestic income increased 1.6 percent in the second quarter, a downward revision of 0.2 percentage point from the second estimates. The downward revision primarily reflected downward revisions to corporate profits and proprietors’ income.
| Line | Change from preceding period (percent) | Contribution to percent change in real GDP (percentage points) | ||||||
|---|---|---|---|---|---|---|---|---|
| Second estimate | Third estimate | Third estimate minus second estimate | Second estimate | Third estimate | Third estimate minus second estimate | |||
| 1 | Gross domestic product (GDP)1 | 4.2 | 4.2 | 0.0 | 4.2 | 4.2 | 0.0 | |
| 2 | Personal consumption expenditures | 3.8 | 3.8 | 0.0 | 2.55 | 2.57 | 0.02 | |
| 3 | Goods | 5.4 | 5.5 | 0.1 | 1.12 | 1.16 | 0.04 | |
| 4 | Durable goods | 8.6 | 8.6 | 0.0 | 0.60 | 0.60 | 0.00 | |
| 5 | Nondurable goods | 3.7 | 4.0 | 0.3 | 0.52 | 0.56 | 0.04 | |
| 6 | Services | 3.1 | 3.0 | −0.1 | 1.43 | 1.42 | −0.01 | |
| 7 | Gross private domestic investment | 0.4 | −0.5 | −0.9 | 0.10 | −0.07 | −0.17 | |
| 8 | Fixed investment | 6.2 | 6.4 | 0.2 | 1.07 | 1.10 | 0.03 | |
| 9 | Nonresidential | 8.5 | 8.7 | 0.2 | 1.13 | 1.15 | 0.02 | |
| 10 | Structures | 13.2 | 14.5 | 1.3 | 0.39 | 0.43 | 0.04 | |
| 11 | Equipment | 4.4 | 4.6 | 0.2 | 0.27 | 0.27 | 0.00 | |
| 12 | Intellectual property products | 11.0 | 10.5 | −0.5 | 0.47 | 0.45 | −0.02 | |
| 13 | Residential | −1.6 | −1.3 | 0.3 | −0.06 | −0.05 | 0.01 | |
| 14 | Change in private inventories | ...... | ...... | ...... | −0.97 | −1.17 | −0.20 | |
| 15 | Net exports of goods and services | ...... | ...... | ...... | 1.17 | 1.22 | 0.05 | |
| 16 | Exports | 9.1 | 9.3 | 0.2 | 1.10 | 1.12 | 0.02 | |
| 17 | Goods | 13.1 | 13.5 | 0.4 | 1.03 | 1.06 | 0.03 | |
| 18 | Services | 1.6 | 1.5 | −0.1 | 0.07 | 0.07 | 0.00 | |
| 19 | Imports | −0.4 | −0.6 | −0.2 | 0.07 | 0.10 | 0.03 | |
| 20 | Goods | −0.3 | −0.4 | −0.1 | 0.05 | 0.06 | 0.01 | |
| 21 | Services | −0.8 | −1.4 | −0.6 | 0.02 | 0.04 | 0.02 | |
| 22 | Government consumption expenditures and gross investment | 2.3 | 2.5 | 0.2 | 0.41 | 0.43 | 0.02 | |
| 23 | Federal | 3.7 | 3.7 | 0.0 | 0.24 | 0.24 | 0.00 | |
| 24 | National defense | 6.0 | 5.9 | −0.1 | 0.22 | 0.22 | 0.00 | |
| 25 | Nondefense | 0.5 | 0.5 | 0.0 | 0.01 | 0.01 | 0.00 | |
| 26 | State and local | 1.6 | 1.8 | 0.2 | 0.17 | 0.20 | 0.03 | |
| Addenda: | ||||||||
| 27 | Final sales of domestic product | 5.3 | 5.4 | 0.1 | 5.20 | 5.33 | 0.13 | |
| 28 | Gross domestic income (GDI) | 1.8 | 1.6 | −0.2 | ...... | ...... | ...... | |
| 29 | Average of GDP and GDI | 3.0 | 2.9 | −0.1 | ...... | ...... | ...... | |
| 30 | Gross domestic purchases price index | 2.3 | 2.4 | 0.1 | ...... | ...... | ...... | |
| 31 | GDP price index | 3.0 | 3.0 | 0.0 | ...... | ...... | ...... | |
- The GDP estimates under the contribution columns are also percent changes.
Measured in current dollars, profits from current production (corporate profits with the inventory valuation (IVA) adjustment and the capital consumption adjustment), increased $65.0 billion, or 3.0 percent at a quarterly rate, in the second quarter after increasing $26.7 billion, or 1.2 percent, in the first quarter (table 4, line 1). In the second quarter, profits of domestic financial corporations increased $16.5 billion (line 3), profits of domestic nonfinancial corporations increased $53.0 billion (line 4), and rest-of-the-world profits decreased $4.5 billion (line 5).
Profits after tax (with the inventory valuation and capital consumption adjustments) increased $42.2 billion in the second quarter after increasing $148.4 billion in the first quarter (line 10).
| Line | Billions of dollars (annual rate) | Percent change from preceding quarter (quarterly rate) | ||||||||
|---|---|---|---|---|---|---|---|---|---|---|
| Level | Change from preceding quarter | |||||||||
| 2018 | 2017 | 2018 | 2017 | 2018 | ||||||
| II | III | IV | I | II | III | IV | I | II | ||
| Current production measures: | ||||||||||
| 1 | Corporate profits with IVA and CCAdj | 2,242.3 | 11.6 | 49.5 | 26.7 | 65.0 | 0.6 | 2.4 | 1.2 | 3.0 |
| 2 | Domestic industries | 1,760.2 | −28.9 | 26.4 | 23.0 | 69.5 | −1.7 | 1.6 | 1.4 | 4.1 |
| 3 | Financial | 457.7 | 20.2 | −8.4 | −9.3 | 16.5 | 4.6 | −1.8 | −2.1 | 3.7 |
| 4 | Nonfinancial | 1,302.5 | −49.2 | 34.8 | 32.3 | 53.0 | −4.0 | 2.9 | 2.7 | 4.2 |
| 5 | Rest of the world | 482.1 | 40.6 | 23.1 | 3.7 | −4.5 | 9.7 | 5.0 | 0.8 | −0.9 |
| 6 | Receipts from the rest of the world | 820.1 | 38.3 | 39.3 | 20.9 | 0.5 | 5.3 | 5.2 | 2.6 | 0.1 |
| 7 | Less: Payments to the rest of the world | 338.0 | −2.3 | 16.2 | 17.2 | 5.0 | −0.7 | 5.4 | 5.4 | 1.5 |
| 9 | Less: Taxes on corporate income | 234.8 | 9.4 | −31.4 | −121.8 | 22.8 | 2.6 | −8.6 | −36.5 | 10.7 |
| 10 | Equals: Profits after tax | 2,007.5 | 2.2 | 80.9 | 148.4 | 42.2 | 0.1 | 4.7 | 8.2 | 2.1 |
| 11 | Net dividends | 1,223.0 | −17.8 | −20.7 | 18.4 | 9.8 | −1.4 | −1.7 | 1.5 | 0.8 |
| 12 | Undistributed profits from current production | 784.5 | 20.1 | 101.6 | 130.0 | 32.4 | 4.0 | 19.5 | 20.9 | 4.3 |
| 13 | Net cash flow with IVA | 2,558.2 | −107.9 | −737.5 | 1,150.1 | 59.4 | −4.9 | −35.4 | 85.3 | 2.4 |
- CCAdj
- Capital consumption adjustment
- IVA
- Inventory valuation adjustment
Note. Levels of these and other profits series are shown in NIPA tables 1.12 and 6.16D.
Industry profits (corporate profits by industry with the inventory valuation adjustment) increased $70.4 billion, or 3.5 percent at a quarterly rate, in the second quarter after increasing $26.6 billion, or 1.3 percent, in the first quarter (table 5, line 1).
| Line | Billions of dollars (annual rate) | Percent change from preceding quarter (quarterly rate) | |||||||||
|---|---|---|---|---|---|---|---|---|---|---|---|
| Level | Change from preceding quarter | ||||||||||
| 2018 | 2017 | 2018 | 2017 | 2018 | |||||||
| II | III | IV | I | II | III | IV | I | II | |||
| Industry profits: | |||||||||||
| 1 | Corporate profits with IVA | 2,107.3 | 12.5 | −189.6 | 26.6 | 70.4 | 0.6 | −8.6 | 1.3 | 3.5 | |
| 2 | Domestic industries | 1,625.2 | −28.0 | −212.7 | 23.0 | 74.9 | −1.6 | −12.2 | 1.5 | 4.8 | |
| 3 | Financial | 461.6 | 20.3 | −35.3 | −9.2 | 17.1 | 4.3 | −7.2 | −2.0 | 3.8 | |
| 4 | Nonfinancial | 1,163.6 | −48.3 | −177.4 | 32.2 | 57.8 | −3.7 | −14.2 | 3.0 | 5.2 | |
| 5 | Utilities | −0.7 | −2.6 | −1.3 | −2.5 | 0.4 | −48.4 | −49.2 | n.m. | n.m. | |
| 6 | Manufacturing | 267.7 | 13.9 | −56.3 | −26.0 | 29.2 | 4.5 | −17.5 | −9.8 | 12.2 | |
| 7 | Wholesale trade | 83.3 | −14.2 | −28.4 | 2.3 | −5.4 | −11.0 | −24.8 | 2.7 | −6.0 | |
| 8 | Retail trade | 141.1 | −2.0 | −29.5 | 16.2 | −14.3 | −1.2 | −17.5 | 11.6 | −9.2 | |
| 9 | Transportation and warehousing | 54.0 | −6.8 | −9.0 | −2.7 | 6.2 | −10.3 | −15.1 | −5.4 | 12.9 | |
| 10 | Information | 161.6 | 9.2 | −33.8 | 24.9 | 12.7 | 6.2 | −21.4 | 20.1 | 8.5 | |
| 11 | Other nonfinancial | 456.6 | −45.9 | −19.1 | 20.0 | 29.0 | −9.7 | −4.5 | 4.9 | 6.8 | |
| 12 | Rest of the world | 482.1 | 40.6 | 23.1 | 3.7 | −4.5 | 9.7 | 5.0 | 0.8 | −0.9 | |
| Addenda: | |||||||||||
| 13 | Profits before tax (without IVA and CCAdj) | 2,197.2 | 30.3 | −146.0 | 26.4 | 86.1 | 1.4 | −6.5 | 1.3 | 4.1 | |
| 14 | Profits after tax (without IVA and CCAdj) | 1,962.3 | 20.9 | −114.7 | 148.1 | 63.4 | 1.1 | −6.1 | 8.5 | 3.3 | |
| 15 | IVA | −89.9 | −17.8 | −43.6 | 0.2 | −15.7 | ...... | ...... | ...... | ...... | |
| 16 | CCAdj | 135.1 | −0.9 | 239.1 | 0.1 | −5.4 | ...... | ...... | ...... | ...... | |
- CCAdj
- Capital consumption adjustment
- IVA
- Inventory valuation adjustment
- n.m.
- Value not meaningful
Note. Levels of these and other profits series are shown in NIPA tables 1.12, 1.14, 1.15, and 6.16D.

[Click chart to expand]
- “Real” estimates are in chained (2012) dollars, and price indexes are chain-type measures. Each GDP estimate for a quarter (advance, second, and third) incorporates increasingly comprehensive and improved source data; for more information, see “The Revisions to GDP, GDI, and Their Major Components” in the January 2018 Survey of Current Business. Quarterly estimates are expressed at seasonally adjusted annual rates, which reflect a rate of activity for a quarter as if it were maintained for a year.
- In this article, “consumer spending” refers to “personal consumption expenditures,” “inventory investment” refers to “change in private inventories,” and “government spending” refers to “government consumption expenditures and gross investment.”