
NIPA Translation of the Fiscal Year 2019 Federal Budget
On February 12, 2018, the President submitted the Budget of the United States Government for Fiscal Year 2019 to Congress. This article presents projected estimates of federal government receipts and expenditures for fiscal years 2018 and 2019 that are consistent with the projected and proposed receipts and outlays defined in the budget but measured on a national income and product account (NIPA) basis. These estimates are presented to assist readers in projecting what the effects of budgeted receipts and outlays would be on aggregate economic activity. They will also be used by the Bureau of Economic Analysis (BEA) to inform estimates of federal government transactions for the coming year, including the federal government component of gross domestic product (GDP).
[Click Chart to Expand]
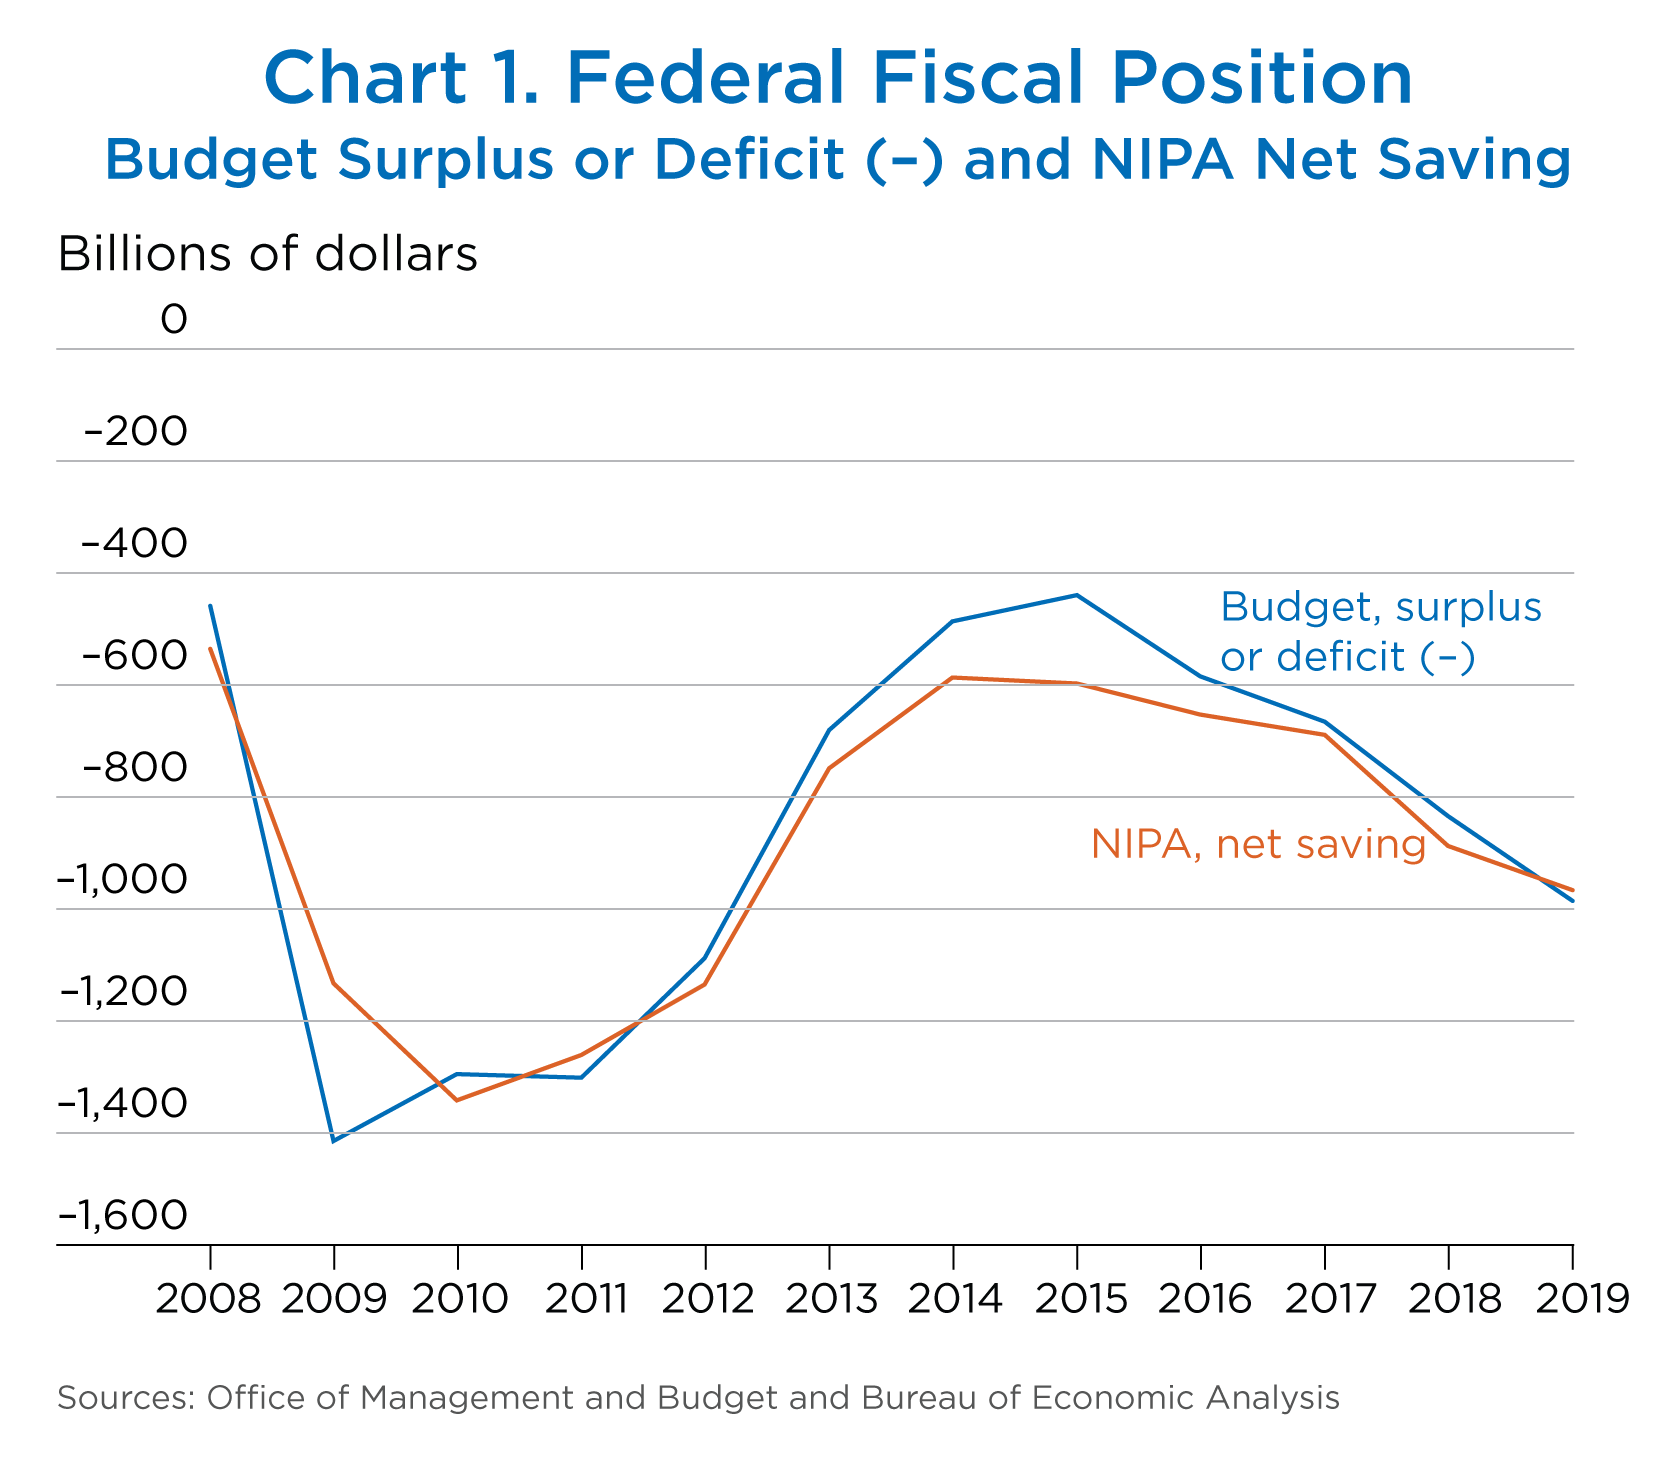
For both 2018 and 2019, estimates of federal government current receipts measured on a NIPA basis are greater than budget estimates of receipts, and estimates of federal government current expenditures measured on a NIPA basis are greater than budget estimates of outlays.1 Net federal government saving, defined as the difference between NIPA estimates of current receipts and current expenditures is –$886.6 billion for 2018 and –$964.6 billion for 2019. The budget surplus, defined as the difference between budget estimates of receipts and outlays, is –$832.6 billion for 2018 and –$984.4 billion for 2019 (chart 1, table 1).
The adjustments that were made to “translate” budget estimates into NIPA estimates are presented in table 2 and table 3. Differences between NIPA estimates and budget estimates of spending on national defense are shown in table 4. For more information about the conceptual differences between NIPA measures and budget measures of government transactions, see the box “NIPA Estimates of the Federal Sector and the Federal Budget Estimates” at the end of this article.
| Level for fiscal year | Change from preceding fiscal year | ||||
|---|---|---|---|---|---|
| Actual | Estimates | ||||
| 2017 | 2018 | 2019 | 2018 | 2019 | |
| Budget: | |||||
| Receipts | 3,316.2 | 3,340.4 | 3,422.3 | 24.2 | 81.9 |
| Outlays | 3,981.6 | 4,173.0 | 4,406.7 | 191.4 | 233.7 |
| Surplus or deficit (–) | −665.4 | −832.6 | −984.4 | −167.2 | −151.8 |
| NIPAs: | |||||
| Current receipts | 3,522.3 | 3,554.0 | 3,671.9 | 31.7 | 117.9 |
| Current expenditures | 4,211.4 | 4,440.6 | 4,636.5 | 229.2 | 195.9 |
| Net federal government saving | −689.1 | −886.6 | −964.6 | −197.5 | −78.0 |
| Budget receipts less NIPA current receipts | −206.1 | −213.6 | −249.6 | −7.5 | −36.0 |
| Budget outlays less NIPA current expenditures | −229.8 | −267.6 | −229.8 | −37.8 | 37.8 |
| Budget deficit less NIPA net federal government saving | 23.7 | 54.0 | −19.8 | 30.3 | −73.8 |
- NIPAs
- National income and product accounts
Sources: Budget of the United States Government, Fiscal Year 2019 and the Bureau of Economic Analysis.
| Fiscal year | |||
|---|---|---|---|
| 2017 | 2018 | 2019 | |
| Budget receipts | 3,316.2 | 3,340.4 | 3,422.3 |
| Less: Coverage differences | 35.8 | 38.5 | 31.5 |
| Contributions received by federal employee pension and insurance funds1 | 4.2 | 4.7 | 5.0 |
| Capital transfers received2 | 22.6 | 24.5 | 16.7 |
| Financial transactions | 0.0 | 0.0 | 0.0 |
| Other3 | 9.0 | 9.3 | 9.8 |
| Less: Netting and grossing differences | −239.6 | −228.9 | −265.2 |
| Supplementary medical insurance premiums | −88.6 | −99.9 | −105.2 |
| Interest receipts | −49.5 | −35.7 | −50.7 |
| Current surplus of government enterprises | −1.1 | 10.5 | −0.4 |
| Other4 | −100.5 | −103.7 | −109.0 |
| Plus: Timing differences | 2.3 | 23.3 | 15.8 |
| Taxes on corporate income | 4.2 | 9.2 | 2.7 |
| Federal and state unemployment insurance taxes | 1.6 | −1.2 | −0.2 |
| Withheld personal income tax and social security contributions | −17.8 | 23.6 | 11.8 |
| Excise taxes | 9.1 | −4.2 | −1.5 |
| Other | 5.4 | −4.1 | 2.9 |
| Equals: NIPA federal government current receipts | 3,522.3 | 3,554.0 | 3,671.9 |
- In the NIPAs, pension plans are treated as “pass-through” institutions that hold financial assets on behalf of households, which are the effective owners. Pension plans are classified as financial corporations that receive contributions and property income on behalf of plan participants but do not have saving or net worth of their own. NIPA table 7.23 shows transactions of the federal government defined-benefit pension subsectors.
- Consists of estate and gift taxes.
- Beginning with 1996, consists largely of Universal Service Fund receipts. Includes certain revenues collected from and repaid to U.S. territories and the Commonwealths of Puerto Rico and Northern Mariana Islands.
- Includes proprietary receipts that are netted against outlays in the budget and that are classified as receipts in the NIPAs and some transactions that are not reflected in the budget but that are added to both receipts and expenditures in the NIPAs.
Sources: Budget of the United States Government, Fiscal Year 2019 and the Bureau of Economic Analysis.
| Fiscal year | |||
|---|---|---|---|
| 2017 | 2018 | 2019 | |
| Budget outlays | 3,981.6 | 4,173.0 | 4,406.7 |
| Less: Coverage differences | 22.2 | −35.4 | 37.9 |
| Federal employee pension and insurance fund transactions1 | −96.0 | −99.5 | −107.7 |
| Interest accrued | −181.3 | −186.1 | −190.8 |
| Contributions accrued (employer) | −69.2 | −66.5 | −71.2 |
| Benefits paid | 154.3 | 152.9 | 154.1 |
| Administrative expenses | 0.3 | 0.2 | 0.2 |
| Financing disbursements from credit programs2 | −41.1 | −100.7 | −92.9 |
| Other differences in funds covered3 | 12.3 | 12.3 | 12.8 |
| Net investment4 | 10.1 | 17.2 | 41.0 |
| Capital transfers paid5 | 81.8 | 73.2 | 109.2 |
| Financial transactions | 56.4 | 66.9 | 79.1 |
| Loan disbursements less loan repayments and sales | 69.5 | 82.4 | 70.8 |
| Deposit insurance | 1.3 | −2.2 | 1.4 |
| Net purchases of foreign currency | 0.0 | 0.0 | 0.0 |
| Other | −14.5 | −13.3 | 7.0 |
| Net purchases of nonproduced assets | −2.2 | −5.6 | −4.4 |
| Other6 | 0.8 | 0.8 | 0.8 |
| Less: Netting and grossing differences | −239.6 | −228.9 | −265.2 |
| Supplementary medical insurance premiums | −88.6 | −99.9 | −105.2 |
| Interest receipts | −49.5 | −35.7 | −50.7 |
| Current surplus of government enterprises | −1.1 | 10.5 | −0.4 |
| Other7 | −100.5 | −103.7 | −109.0 |
| Plus: Timing differences | 12.4 | 3.3 | 2.5 |
| Purchases (increase in payables net of advances) | 2.1 | −1.5 | 2.7 |
| Interest payments | 0.2 | 0.2 | 0.2 |
| Current transfer payments | −0.8 | 22.0 | 0.2 |
| Other8 | 10.9 | −17.4 | −0.6 |
| Equals: NIPA federal government current expenditures | 4,211.4 | 4,440.6 | 4,636.5 |
- NIPAs
- National income and product accounts
- In the NIPAs, pension plans are treated as “pass-through” institutions that hold financial assets on behalf of households, which are the effective owners. Pension plans are classified as financial corporations that receive contributions and property income on behalf of plan participants but do not have saving or net worth of their own. NIPA table 7.23 shows transactions of the federal government defined-benefit pension subsectors. Contributions for publicly administered insurance funds are transactions with the household sector and include the Medicare-eligible Retiree Health Care Fund.
- Consists of transactions (not included in the budget totals) that record all cash flows arising from post-1991 direct loan obligations and loan guarantee commitments. Many of these flows are for new loans or loan repayments; therefore, related entries are included in “Loan disbursements less loan repayments and sales.”
- Consists largely of agencies or accounts, such as the Postal Service and the Federal Financing Bank, that were not included in the budget in some periods, and the Universal Service Fund. Includes repayments of certain collections from the U.S. territories and the Commonwealths of Puerto Rico and Northern Mariana Islands.
- Net investment is gross investment less consumption of fixed capital for government enterprises and general government.
- Consists of investment grants to state and local governments and maritime construction subsidies. Excludes the forgiveness of debts owed by foreign governments to the U.S. government or payments to the Uniformed Services Retiree Health Care Fund to amortize unfunded liability; both are classified as capital transfers paid by the United States and are excluded from both budget outlays and NIPA current expenditures.
- Consists largely of net expenditures of foreign currencies.
- Includes proprietary receipts that are netted against outlays in the budget and that are classified as receipts in the NIPAs and some transactions that are not reflected in the budget data but that are added to both receipts and expenditures in the NIPAs.
- Primarily includes timing on subsidies and government enterprises.
Sources: Budget of the United States Government, Fiscal Year 2019 and the Bureau of Economic Analysis
| Fiscal year | |||
|---|---|---|---|
| 2017 | 2018 | 2019 | |
| Budget outlays for national defense | 598.7 | 643.3 | 688.6 |
| Department of Defense, military | 568.9 | 612.5 | 656.9 |
| Military personnel | 144.7 | 145.2 | 159.8 |
| Operation and maintenance | 245.2 | 255.9 | 275.2 |
| Procurement | 104.1 | 107.4 | 118.6 |
| Aircraft | 33.3 | 32.5 | 34.3 |
| Missiles | 6.0 | 6.7 | 8.1 |
| Ships | 14.2 | 14.6 | 16.1 |
| Weapons | 4.8 | 5.1 | 5.9 |
| Ammunition | 1.3 | 2.3 | 2.5 |
| Other1 | 44.6 | 46.3 | 51.7 |
| Research, development, test, and evaluation | 68.1 | 72.8 | 86.1 |
| Other | 6.8 | 31.3 | 17.1 |
| Atomic energy and other defense-related activities | 29.8 | 30.7 | 31.7 |
| Plus: Consumption of general government fixed capital | 158.4 | 158.4 | 157.8 |
| Additional payments to military and civilian retirement funds | 95.4 | 98.5 | 100.7 |
| Less: Grants-in-aid to state and local governments and net interest paid | 0.5 | 0.5 | 0.6 |
| Timing differences | 3.3 | −1.8 | −5.1 |
| Other differences | 111.3 | 122.0 | 123.5 |
| Equals: NIPA national defense consumption expenditures and gross investment | 737.4 | 779.5 | 828.1 |
| Less: National defense gross investment2 | 151.5 | 159.9 | 176.9 |
| Equals: NIPA national defense consumption expenditures | 585.9 | 619.6 | 651.3 |
- NIPAs
- National income and product accounts
- Includes outlays for military construction, family housing, and anticipated funding for war operations.
- Gross investment consists of general government expenditures for fixed assets; inventory investment is included in federal government consumption expenditures.
Sources: Budget of the United States Government, Fiscal Year 2019 and the Bureau of Economic Analysis.
The Budget projects increases in federal receipts of $24.2 billion in 2018 and $81.9 billion in 2019 (table 5). These increases can be attributed largely to budget assumptions about economic activity and real GDP over these years.2 Projected economic growth would result in an expansion of the tax base and an increase in individual and employment taxes in both years. Taxes on corporate income, which would normally also increase during periods of economic growth, are projected to decline in 2018 because of a lowering of corporate tax rates enacted by the 2017 Tax Cuts and Jobs Act.
| Level for fiscal year | Change from preceding year | ||||||
|---|---|---|---|---|---|---|---|
| 2016 | 2017 | 2018 | 2019 | 2017 | 2018 | 2019 | |
| Budget receipts | 3,268.0 | 3,316.2 | 3,340.4 | 3,422.3 | 48.2 | 24.2 | 81.9 |
| Individual income taxes | 1,546.1 | 1,587.1 | 1,660.1 | 1,687.7 | 41.0 | 72.9 | 27.7 |
| Corporation income taxes | 299.6 | 297.0 | 217.6 | 225.3 | −2.5 | −79.4 | 7.7 |
| Social insurance taxes and contributions | 1,115.1 | 1,161.9 | 1,169.7 | 1,237.6 | 46.8 | 7.8 | 67.9 |
| Excise taxes | 95.0 | 83.8 | 108.2 | 108.4 | −11.2 | 24.4 | 0.2 |
| Estate and gift taxes | 21.4 | 22.8 | 24.7 | 16.8 | 1.4 | 1.9 | −7.8 |
| Customs duties | 34.8 | 34.6 | 40.4 | 43.9 | −0.3 | 5.9 | 3.4 |
| Miscellaneous receipts | 156.0 | 129.0 | 119.7 | 106.0 | −27.1 | −9.3 | −13.7 |
| Other1 | 0.0 | 0.0 | 0.0 | −3.5 | 0.0 | 0.0 | −3.5 |
- Includes a reduction in receipts resulting from a budget proposal to repeal and replace the Affordable Care Act.
Source: Budget of the United States Government, Fiscal Year 2019.
The Budget projects increases in federal outlays of $191.4 billion in 2018 and $233.7 billion in 2019 (table 6). The largest contributors to these increases are outlays for social security benefits, defense outlays, and interest on the public debt. The acceleration in projected federal outlays from 2018 to 2019 can be largely attributed to the pattern of outlays for federal direct student loan programs and Medicare benefits and to an increase in outlays for community and regional development related to a proposed infrastructure initiative.
| Level for fiscal year | Change from preceding year | ||||||
|---|---|---|---|---|---|---|---|
| 2016 | 2017 | 2018 | 2019 | 2017 | 2018 | 2019 | |
| Budget outlays | 3852.6 | 3981.6 | 4173.0 | 4406.7 | 128.9 | 191.4 | 233.7 |
| National defense | 593.4 | 598.7 | 643.3 | 688.6 | 5.4 | 44.5 | 45.4 |
| International affairs | 45.3 | 46.3 | 47.3 | 63.3 | 1.0 | 1.0 | 16.0 |
| General science, space, and technology | 30.2 | 30.4 | 31.7 | 32.5 | 0.2 | 1.3 | 0.7 |
| Energy | 3.7 | 3.9 | 4.0 | 3.2 | 0.1 | 0.1 | −0.7 |
| Natural resources and environment | 39.5 | 37.9 | 40.4 | 38.3 | −1.6 | 2.5 | −2.1 |
| Agriculture | 18.3 | 18.9 | 26.9 | 20.5 | 0.5 | 8.1 | −6.4 |
| Commerce and housing credit | −34.1 | −26.8 | 4.9 | −23.4 | 7.2 | 31.7 | −28.3 |
| Transportation | 92.6 | 93.6 | 94.4 | 94.0 | 1.0 | 0.8 | −0.4 |
| Community and regional development | 20.1 | 24.9 | 54.3 | 70.4 | 4.8 | 29.4 | 16.0 |
| Education, training, employment, and social services | 109.7 | 144.0 | 98.6 | 100.6 | 34.2 | −45.4 | 2.0 |
| Health | 511.3 | 533.1 | 594.1 | 594.3 | 21.8 | 60.9 | 0.2 |
| Medicare | 594.5 | 597.3 | 588.4 | 631.0 | 2.8 | −8.9 | 42.7 |
| Income security | 514.1 | 503.5 | 498.8 | 499.6 | −10.7 | −4.7 | 0.8 |
| Social security | 916.1 | 944.9 | 992.5 | 1052.1 | 28.8 | 47.7 | 59.5 |
| Veterans benefits and services | 174.5 | 176.5 | 177.2 | 197.9 | 2.0 | 0.7 | 20.7 |
| Administration of justice | 55.8 | 57.9 | 69.6 | 65.2 | 2.2 | 11.6 | −4.3 |
| General government | 22.7 | 23.9 | 26.3 | 29.3 | 1.2 | 2.4 | 3.0 |
| Net interest | 240.0 | 262.6 | 310.3 | 363.4 | 22.5 | 47.8 | 53.1 |
| Allowances1 | 0.0 | 0.0 | −28.0 | −9.9 | 0.0 | −28.0 | 18.1 |
| Undistributed offsetting receipts 2 | −95.3 | −89.8 | −102.0 | −104.1 | 5.4 | −12.1 | −2.1 |
- Allowances are included in budget totals to cover certain budgetary transactions that are expected to increase or decrease outlays, receipts, or budget authority but are not reflected in the program details.
- Undistributed offsetting receipts are two categories of collections that are governmental in nature and that are not credited to expenditure accounts: receipts from performing business-like activities, such as proceeds from selling federal assets or leases, and shifts from one account to another, such as agency payments to retirement funds.
Source: Budget of the United States Government, Fiscal Year 2019.
Proposed legislative and program changes
The budget projections include the receipts and outlays that would result from the continuation of current laws and policies as well as the projected effects of policy proposals that have not yet been enacted. The Budget also presents estimates of receipts and outlays that are consistent with the current services baseline, which represents the expected deficit outlook. This baseline serves as the most appropriate benchmark against which to measure the effects of proposed policy changes. In this article, the term “proposed legislation” refers to any policies that are included in budget estimates but that are not included in current services baseline estimates.3
If enacted, proposed legislation would increase federal receipts $3.3 billion for 2019 and would increase federal outlays $18.6 billion for 2019. The resulting net effect of proposed legislation would be to increase the federal deficit $15.3 billion (table 7). The legislative proposals that would have the largest effects on federal receipts and outlays in 2019 include the following:
- An initiative to incentivize nonfederal funding for infrastructure investment would increase outlays by $44.6 billion. In NIPA estimates, these outlays are recorded primarily as capital transfer payments (table 10, line 126).
- An initiative to reform the Supplemental Nutrition Assistance Program (SNAP) and other welfare programs would decrease outlays by a $21.4 billion. In NIPA estimates, these outlays are recorded as either social benefits (line 65) or as grants-in-aid to state and local governments (line 83).
- A proposal to repeal and replace the Affordable Care Act would decrease federal receipts by $3.5 billion and would increase federal outlays by $3.3 billion. In NIPA estimates, the decrease in receipts is recorded as a reduction in personal taxes (line 3), and the increase in outlays is recorded as an increase in social benefits (line 65).
| Fiscal year | ||
|---|---|---|
| 2018 | 2019 | |
| Receipts | ||
| Current-services estimates | 3,340.3 | 3,424.3 |
| Plus: Proposed legislation excluding proposals assumed in the baseline1 | 0.1 | −2.0 |
| Repeal and Replace the Affordable Care Act | 0.0 | −3.5 |
| Other | 0.1 | 1.5 |
| Equals: The budget | 3,340.4 | 3,422.3 |
| Outlays | ||
| Current-services estimates | 4,169.6 | 4,388.1 |
| Plus: Program changes excluding proposals assumed in the baseline1 | 3.4 | 18.6 |
| Infrastructure Initiative | 0.0 | 44.6 |
| Reform welfare programs | 0.0 | −21.4 |
| Repeal and Replace the Affordable Care Act | 0.0 | 3.3 |
| Other | 3.4 | −7.8 |
| Equals: The budget | 4,173.0 | 4,406.7 |
| Current-services surplus or deficit (–) | −829.3 | −963.8 |
| Plus: Proposed changes, receipts less outlays | −3.3 | −20.6 |
| Equals: Administration budget surplus or deficit (–) | −832.6 | −984.4 |
- Consistent with the budget, proposed legislation excludes budget reform proposals that are included in the baseline.
Source: Budget of the United States Government, Fiscal Year 2019.
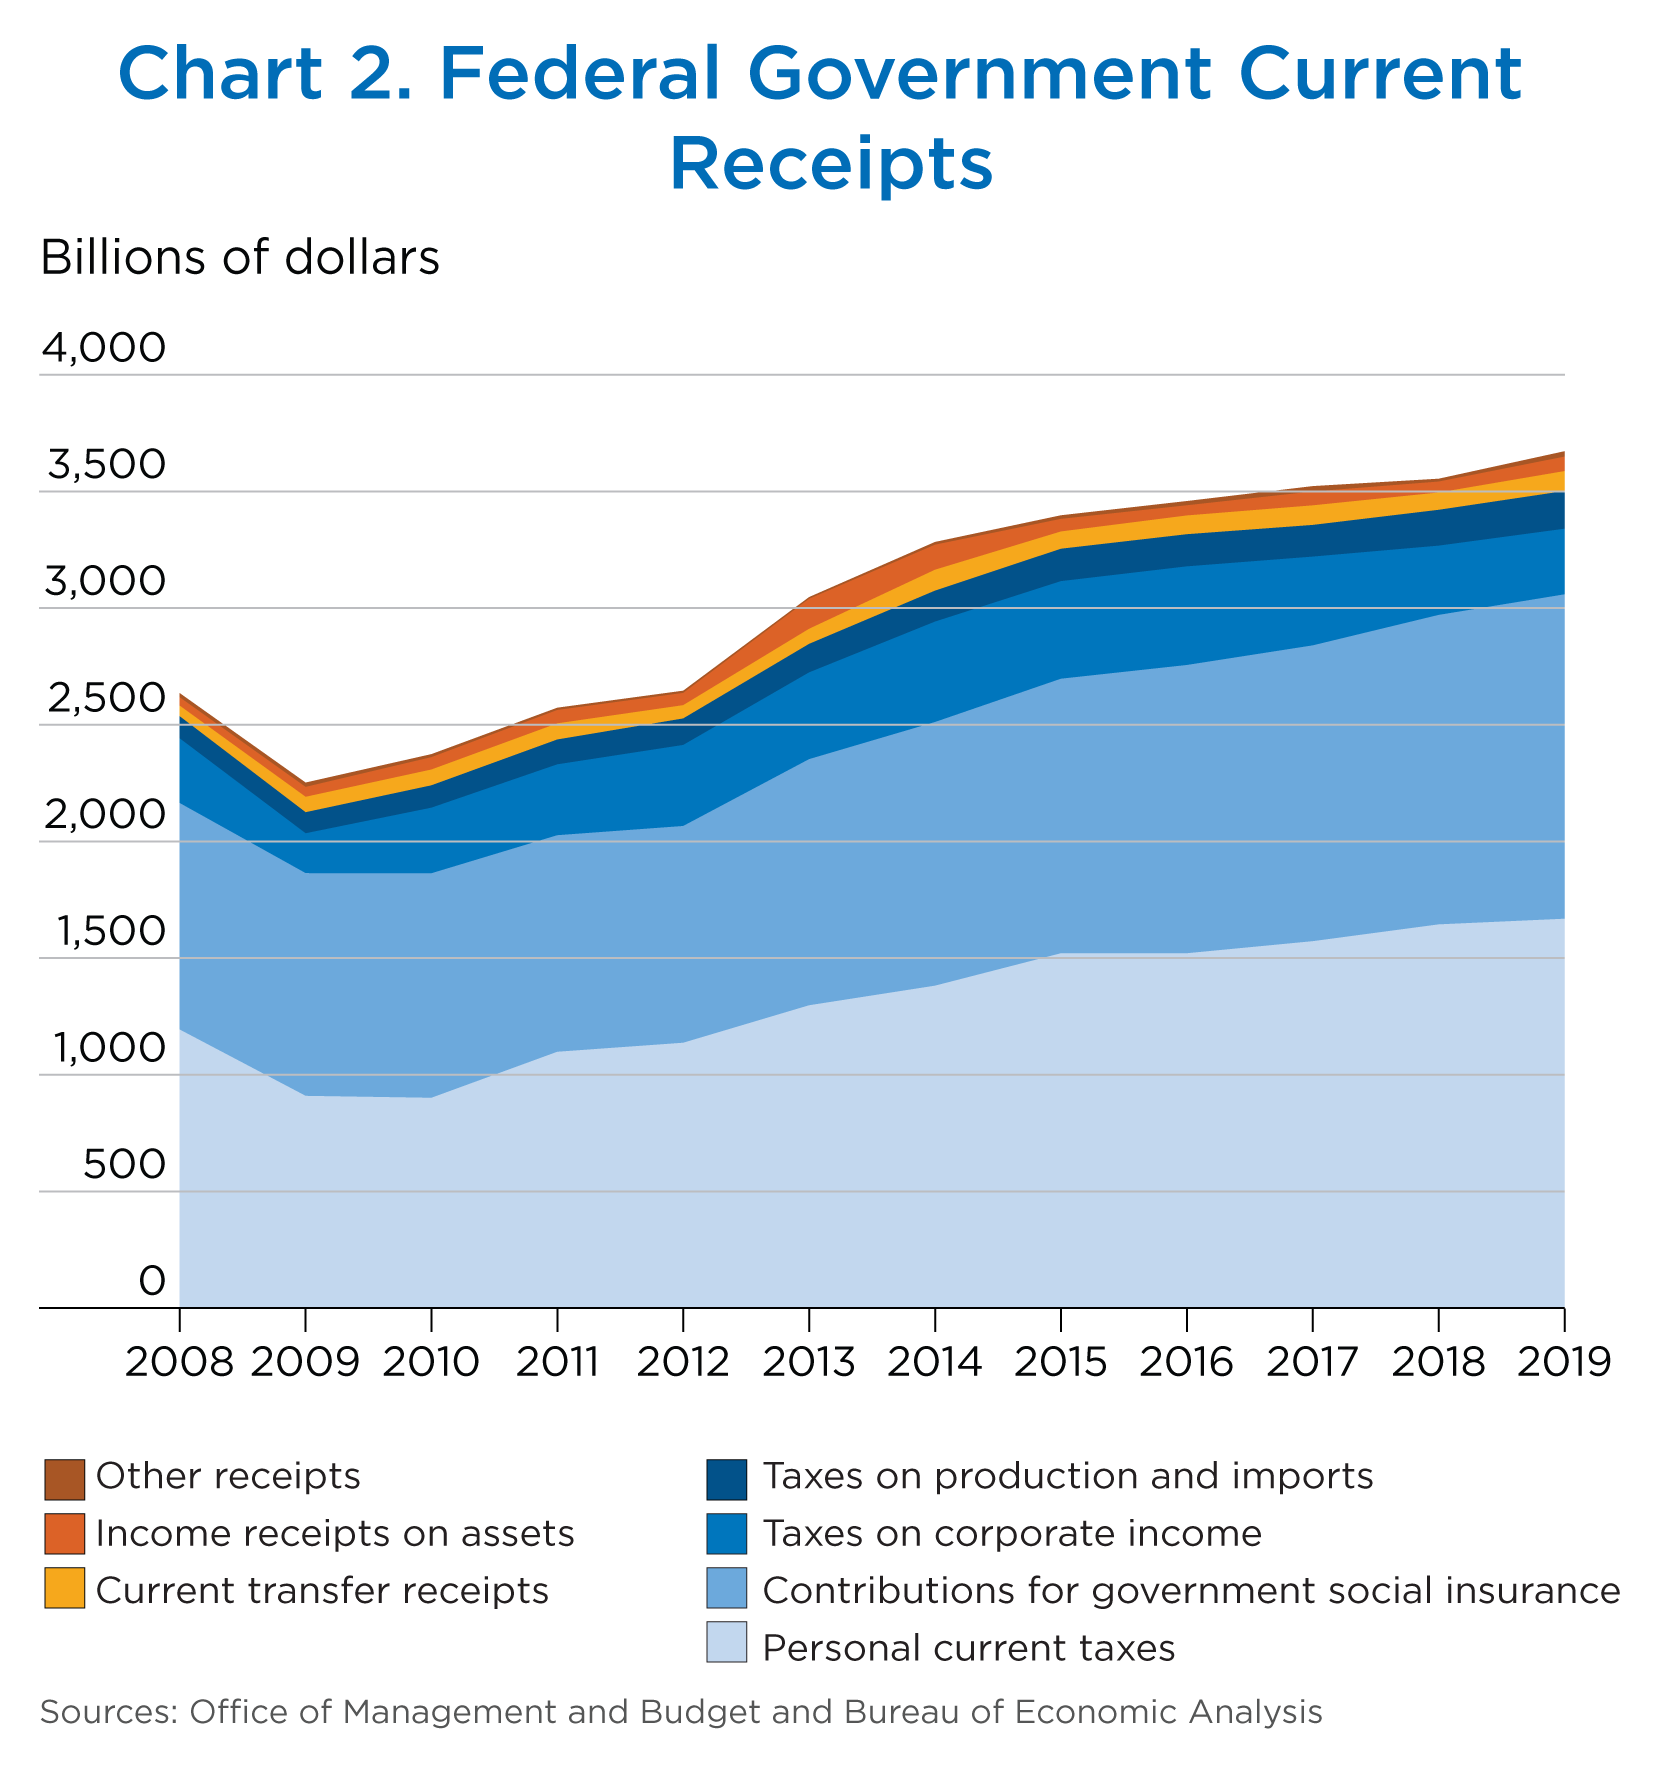
NIPA estimates of federal government current receipts that are consistent with the Budget increase $31.7 billion in 2018 and $117.9 billion in 2019 (table 8 and chart 2). The acceleration in 2019 is primarily due to a smaller decrease in corporate taxes and to upturns in dividends and other transfer receipts from businesses in 2018.
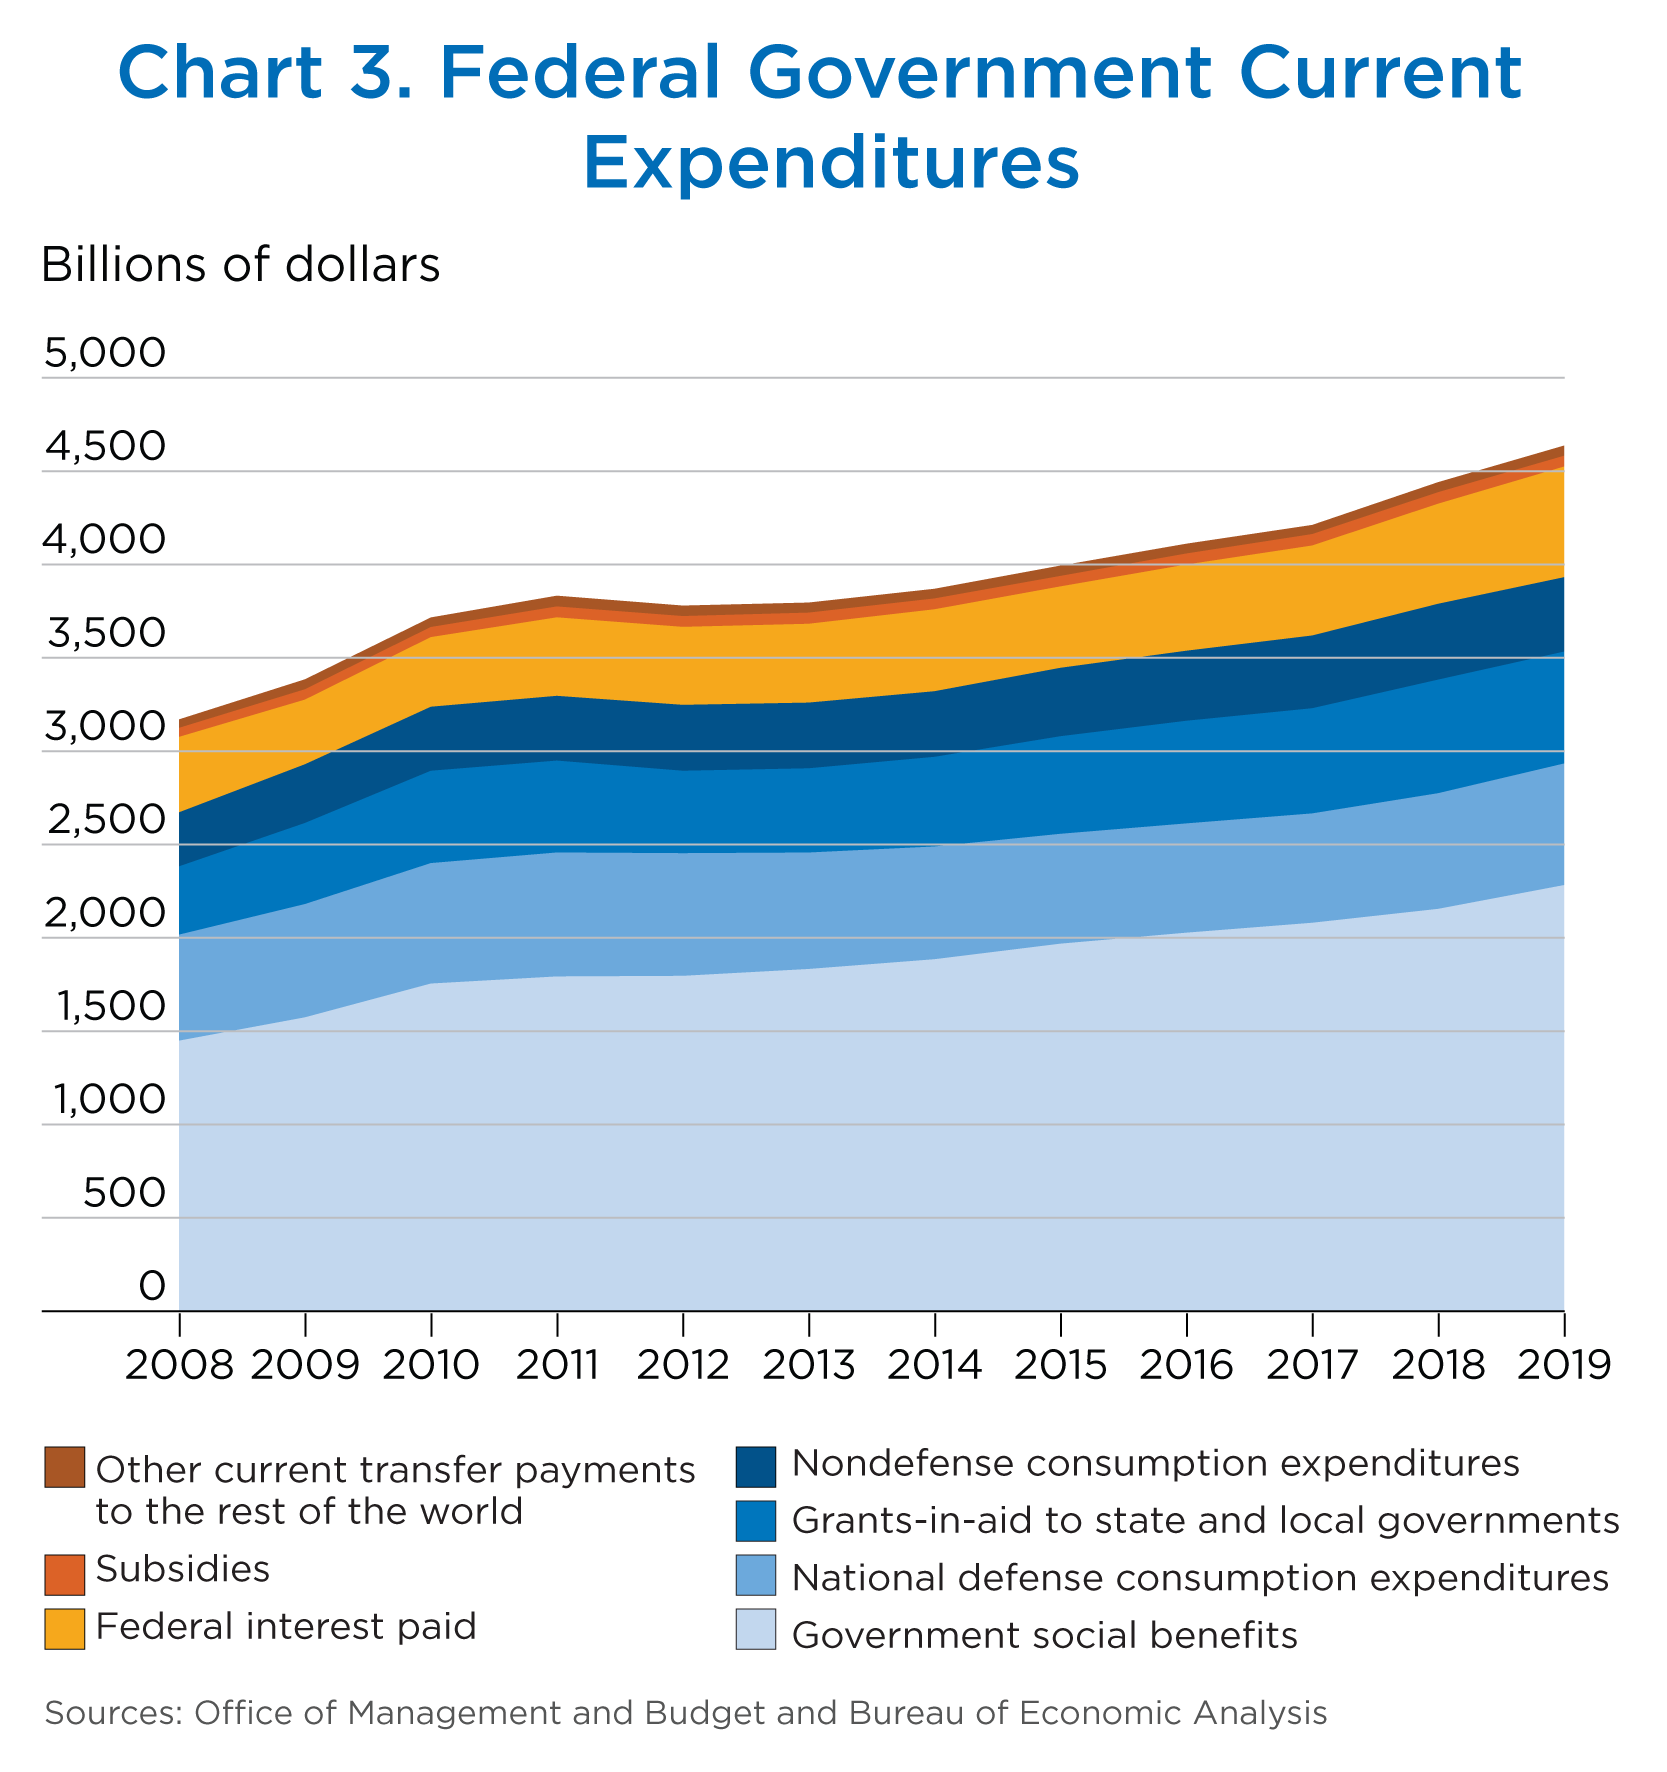
NIPA estimates of federal government current expenditures that are consistent with the Budget increase $229.2 billion in 2018 and $196.0 billion in 2019 (table 9 and chart 3). The deceleration in 2019 is largely due to downturns in grants-in-aid to state and local governments and in nondefense consumption expenditures. The deceleration in grants-in-aid is caused by a deceleration in federal funding for Medicaid and a downturn in federal funding for income security programs administered by state governments.
[Click Chart to Expand]
[Click Chart to Expand]
| Change from preceding fiscal year | |||
|---|---|---|---|
| 2017 | 2018 | 2019 | |
| Total current receipts | 63.9 | 31.7 | 117.9 |
| Current tax receipts | 8.3 | 7.0 | 16.5 |
| Personal current taxes | 51.7 | 72.0 | 24.2 |
| Due to tax bases | 51.7 | 72.0 | 26.9 |
| Due to proposed legislation | 0.0 | 0.0 | −2.7 |
| Taxes on production and imports | −2.0 | 17.8 | 8.0 |
| Due to tax bases | −2.0 | 17.8 | 7.7 |
| Due to proposed legislation | 0.0 | 0.0 | 0.3 |
| Taxes on corporate income | −42.2 | −83.6 | −15.7 |
| Due to tax bases | −42.2 | −83.6 | −15.8 |
| Due to proposed legislation | 0.0 | 0.0 | 0.1 |
| Taxes from the rest of the world | 0.9 | 0.7 | 0.0 |
| Contributions for government social insurance | 32.4 | 58.5 | 64.0 |
| Due to tax bases | 32.4 | 58.5 | 64.0 |
| Due to proposed legislation | 0.0 | 0.0 | 0.0 |
| Income receipts on assets | 15.8 | −12.5 | 15.1 |
| Current transfer receipts | 3.5 | −9.7 | 11.3 |
| Current surplus of government enterprises | 3.9 | −11.6 | 10.9 |
| Addenda: | |||
| Total due to tax bases | 39.9 | 64.7 | 82.8 |
| Total due to proposed legislation | 0.0 | 0.0 | −2.3 |
- NIPAs
- National income and product accounts
Sources: Budget of the United States Government, Fiscal Year 2019 and the Bureau of Economic Analysis.
| Change from preceding fiscal year | |||
|---|---|---|---|
| 2017 | 2018 | 2019 | |
| Total current expenditures | 100.6 | 229.2 | 196.0 |
| Consumption expenditures | 15.0 | 50.4 | 23.8 |
| National defense | −36.7 | 33.8 | 31.6 |
| Pay raise and locality pay | 0.0 | 5.3 | 7.9 |
| Other | −36.7 | 28.5 | 23.7 |
| Nondefense | 51.7 | 16.6 | −7.9 |
| Pay raise and locality pay | 0.0 | 2.7 | 1.0 |
| Other | 51.7 | 13.9 | −8.8 |
| Current transfer payments | 63.2 | 124.3 | 119.5 |
| Government social benefits to persons | 51.6 | 73.4 | 126.0 |
| Government social benefits to the rest of the world | 1.6 | 1.1 | 1.4 |
| Grants-in-aid to state and local governments | 13.6 | 45.0 | −8.9 |
| Other current transfer payments paid to the rest of the world | −3.5 | 4.8 | 0.9 |
| Federal interest paid | 20.3 | 54.1 | 56.6 |
| Subsidies | 2.1 | 0.4 | −3.9 |
- NIPAs
- National income and product accounts
Source: Bureau of Economic Analysis.
Seasonally adjusted quarterly NIPA estimates for 2018 and 2019 are displayed in table 10. These quarterly estimates are extrapolated from NIPA estimates currently published for the fourth quarter of 2017, which were released on February 28, 2018.4 The quarterly patterns of these NIPA estimates are based on economic assumptions from the Budget and on expectations about the timing of receipts and expenditures related to specific government programs or policy proposals. For example, the quarterly patterns of estimates of some tax receipts are based on the administration's projected pattern of wages while cost-of-living increases for social security and certain other programs are incorporated into estimates of social benefits in the first quarter of each calendar year.
Because these quarterly projections are based on budget estimates and assumptions, they should be viewed as approximations. Improvements will be made to these estimates as actual receipts and spending occur, as economic conditions change, as new laws are enacted, and as more source data become available. More reliable contemporaneous estimates will be published monthly in NIPA table 3.2 and in related underlying tables.
Table 10. NIPA Federal Government Current Receipts and Expenditures
[Billions of dollars; calendar year and quarters at seasonally adjusted annual rates]
| Line | Fiscal year estimates1 | Calendar year | Quarter | ||||||||||||||
|---|---|---|---|---|---|---|---|---|---|---|---|---|---|---|---|---|---|
| Published2 | Estimated | Published2 | Estimated | ||||||||||||||
| 2017 | 2018 | 2019 | |||||||||||||||
| 2017 | 2018 | 2019 | 2017 | 2018 | I | II | III | IV | I | II | III | IV | I | II | III | ||
| Current receipts | 1 | 3,522.3 | 3,554.0 | 3,671.9 | 3,595.0 | 3,581.6 | 3,589.2 | 3,556.4 | 3,618.4 | 3,616.2 | 3,571.7 | 3,574.1 | 3,579.2 | 3,601.4 | 3,671.6 | 3,726.9 | 3,791.4 |
| Current tax receipts | 2 | 2,110.2 | 2,117.2 | 2,133.7 | 2,166.7 | 2,120.7 | 2,133.4 | 2,150.7 | 2,176.8 | 2,205.9 | 2,141.3 | 2,128.1 | 2,114.4 | 2,099.0 | 2,138.5 | 2,179.9 | 2,238.5 |
| Personal current taxes | 3 | 1,572.0 | 1,644.0 | 1,668.2 | 1,603.5 | 1,613.5 | 1,574.0 | 1,586.5 | 1,613.8 | 1,639.8 | 1,605.0 | 1,621.4 | 1,622.4 | 1,605.3 | 1,627.1 | 1,653.3 | 1,699.9 |
| Withheld income taxes | 4 | 1,295.7 | 1,319.9 | 1,299.7 | 1,336.2 | 1,285.3 | 1,308.4 | 1,319.7 | 1,345.8 | 1,370.8 | 1,282.4 | 1,294.2 | 1,291.2 | 1,273.5 | 1,272.8 | 1,289.2 | 1,322.5 |
| Declarations and final settlements less refunds | 5 | 276.2 | 324.1 | 368.5 | 267.3 | 328.2 | 265.7 | 266.8 | 267.9 | 268.9 | 322.6 | 327.2 | 331.2 | 331.8 | 354.3 | 364.2 | 377.4 |
| Proposed legislation | 6 | ..... | 0.0 | −2.7 | ..... | 0.0 | ..... | ..... | ..... | ..... | 0.0 | 0.0 | 0.0 | 0.0 | −3.7 | −3.7 | −3.7 |
| Other | 7 | 276.2 | 324.1 | 371.3 | 267.3 | 328.2 | 265.7 | 266.8 | 267.9 | 268.9 | 322.6 | 327.2 | 331.2 | 331.8 | 357.9 | 367.8 | 381.0 |
| Taxes on production and imports | 8 | 135.7 | 153.6 | 161.6 | 132.2 | 153.8 | 128.8 | 131.6 | 132.8 | 135.4 | 152.1 | 153.3 | 154.1 | 155.8 | 155.6 | 156.8 | 158.6 |
| Proposed legislation | 9 | ..... | 0.0 | 0.3 | ..... | 0.0 | ..... | ..... | ..... | ..... | 0.0 | 0.0 | 0.0 | 0.0 | 0.5 | 0.5 | 0.5 |
| Other | 10 | 135.7 | 153.6 | 161.2 | 132.2 | 153.8 | 128.8 | 131.6 | 132.8 | 135.4 | 152.1 | 153.3 | 154.1 | 155.8 | 155.2 | 156.3 | 158.2 |
| Taxes on corporate income | 11 | 380.5 | 296.9 | 281.2 | 408.7 | 330.4 | 408.8 | 410.4 | 407.8 | 407.8 | 361.4 | 330.4 | 315.0 | 315.0 | 332.9 | 346.9 | 357.1 |
| Federal Reserve Banks | 12 | 81.9 | 72.7 | 55.7 | 83.5 | 68.4 | 92.4 | 88.6 | 76.5 | 76.5 | 74.5 | 71.2 | 66.7 | 61.0 | 56.4 | 53.0 | 50.8 |
| Proposed legislation | 13 | ..... | 0.0 | 0.0 | ..... | 0.0 | ..... | ..... | ..... | ..... | 0.0 | 0.0 | 0.0 | 0.0 | 0.0 | 0.0 | 0.0 |
| Other | 14 | 81.9 | 72.7 | 55.7 | 83.5 | 68.4 | 92.4 | 88.6 | 76.5 | 76.5 | 74.5 | 71.2 | 66.7 | 61.0 | 56.4 | 53.0 | 50.8 |
| Other corporate profit tax accruals | 15 | 298.6 | 224.2 | 225.5 | 325.2 | 262.1 | 316.4 | 321.8 | 331.3 | 331.3 | 286.9 | 259.2 | 248.2 | 254.0 | 276.4 | 293.9 | 306.3 |
| Proposed legislation | 16 | ..... | 0.0 | 0.0 | ..... | 0.0 | ..... | ..... | ..... | ..... | 0.0 | 0.0 | 0.0 | 0.0 | 0.1 | 0.1 | 0.1 |
| Other | 17 | 298.6 | 224.2 | 225.4 | 325.2 | 262.1 | 316.4 | 321.8 | 331.3 | 331.3 | 286.9 | 259.2 | 248.2 | 254.0 | 276.4 | 293.8 | 306.2 |
| Taxes from the rest of the world | 18 | 22.0 | 22.7 | 22.7 | 22.3 | 22.9 | 21.7 | 22.1 | 22.4 | 22.9 | 22.9 | 22.9 | 22.9 | 22.9 | 22.9 | 22.9 | 22.9 |
| Contributions for social insurance | 19 | 1,267.7 | 1,326.3 | 1,390.3 | 1,287.2 | 1,348.0 | 1,269.2 | 1,278.9 | 1,293.4 | 1,307.4 | 1,327.4 | 1,339.7 | 1,354.1 | 1,370.7 | 1,395.4 | 1,406.8 | 1,411.8 |
| Domestic | 20 | 1,261.9 | 1,320.1 | 1,383.9 | 1,281.7 | 1,342.2 | 1,263.7 | 1,273.4 | 1,287.9 | 1,301.8 | 1,321.7 | 1,334.0 | 1,348.3 | 1,364.8 | 1,389.5 | 1,400.8 | 1,405.7 |
| Old age, survivors, disability, and hospital insurance | 21 | 1,108.5 | 1,156.0 | 1,213.7 | 1,129.2 | 1,178.0 | 1,111.4 | 1,121.1 | 1,135.3 | 1,148.9 | 1,158.5 | 1,170.2 | 1,183.9 | 1,199.7 | 1,221.9 | 1,233.0 | 1,237.9 |
| Tax on wages and salaries (FICA, gross) | 22 | 1,045.9 | 1,090.9 | 1,144.9 | 1,064.3 | 1,109.3 | 1,047.6 | 1,056.6 | 1,070.1 | 1,082.8 | 1,091.1 | 1,101.9 | 1,114.7 | 1,129.5 | 1,150.7 | 1,161.0 | 1,165.4 |
| Proposed legislation | 23 | ..... | 0.0 | 0.0 | ..... | ..... | ..... | ..... | ..... | ..... | 0.0 | 0.0 | 0.0 | 0.0 | 0.0 | 0.0 | 0.0 |
| Rate change | 24 | ..... | 0.0 | 0.0 | ..... | 0.0 | ..... | ..... | ..... | ..... | 0.0 | 0.0 | 0.0 | 0.0 | 0.0 | 0.0 | 0.0 |
| Base increases | 25 | ..... | 1.0 | 4.8 | ..... | 1.3 | ..... | ..... | ..... | ..... | 1.3 | 1.3 | 1.3 | 1.3 | 5.9 | 5.9 | 5.9 |
| January 2018 | 26 | ..... | 1.0 | 1.3 | ..... | 1.3 | ..... | ..... | ..... | ..... | 1.3 | 1.3 | 1.3 | 1.3 | 1.3 | 1.3 | 1.3 |
| January 2019 | 27 | ..... | ..... | 3.4 | ..... | ..... | ..... | ..... | ..... | ..... | 0.0 | 0.0 | 0.0 | 0.0 | 4.6 | 4.6 | 4.6 |
| Other | 28 | 1,045.9 | 1,089.9 | 1,140.1 | 1,064.3 | 1,108.0 | 1,047.6 | 1,056.6 | 1,070.1 | 1,082.8 | 1,089.8 | 1,100.6 | 1,113.3 | 1,128.1 | 1,144.8 | 1,155.1 | 1,159.5 |
| FICA refunds | 29 | −3.3 | −3.4 | −3.6 | −3.3 | −3.5 | −3.3 | −3.3 | −3.3 | −3.3 | −3.5 | −3.5 | −3.5 | −3.5 | −3.7 | −3.7 | −3.7 |
| Voluntary hospital insurance | 30 | 3.4 | 3.7 | 3.9 | 3.3 | 3.5 | 3.3 | 3.3 | 3.3 | 3.3 | 3.4 | 3.5 | 3.5 | 3.6 | 3.6 | 3.7 | 3.7 |
| Tax on self-employment earnings (SECA) | 31 | 62.5 | 64.8 | 68.5 | 64.9 | 68.7 | 63.9 | 64.5 | 65.2 | 66.1 | 67.5 | 68.3 | 69.1 | 70.1 | 71.3 | 72.0 | 72.4 |
| Proposed legislation | 32 | ..... | 0.0 | 0.0 | 0.0 | 0.0 | 0.0 | 0.0 | 0.0 | 0.0 | 0.0 | 0.0 | 0.0 | 0.0 | 0.0 | 0.0 | 0.0 |
| Base increases | 33 | ..... | 0.5 | 0.8 | 0.0 | 0.7 | 0.0 | 0.0 | 0.0 | 0.0 | 0.7 | 0.7 | 0.7 | 0.7 | 0.9 | 0.9 | 0.9 |
| Other | 34 | 62.5 | 64.3 | 67.7 | 64.9 | 68.1 | 63.9 | 64.5 | 65.2 | 66.1 | 66.8 | 67.6 | 68.5 | 69.4 | 70.4 | 71.2 | 71.6 |
| Supplementary medical insurance | 35 | 84.1 | 95.1 | 101.2 | 81.5 | 94.4 | 81.4 | 81.5 | 81.6 | 81.6 | 93.7 | 94.1 | 94.6 | 95.1 | 97.6 | 97.8 | 97.8 |
| Unemployment insurance | 36 | 47.9 | 47.4 | 46.9 | 49.4 | 47.8 | 49.5 | 49.3 | 49.4 | 49.4 | 47.7 | 47.8 | 47.8 | 47.8 | 47.6 | 47.6 | 47.6 |
| Other | 37 | 21.4 | 21.6 | 22.1 | 21.6 | 22.0 | 21.4 | 21.5 | 21.7 | 21.8 | 21.9 | 21.9 | 22.1 | 22.2 | 22.4 | 22.4 | 22.4 |
| Rest of the world | 38 | 5.8 | 6.2 | 6.4 | 5.5 | 5.7 | 5.5 | 5.5 | 5.5 | 5.6 | 5.6 | 5.7 | 5.8 | 5.9 | 5.9 | 6.0 | 6.0 |
| Income receipts on assets | 39 | 59.4 | 47.0 | 62.1 | 58.5 | 38.0 | 76.5 | 59.9 | 59.4 | 38.1 | 33.0 | 34.2 | 35.0 | 49.6 | 49.9 | 50.4 | 50.9 |
| Interest receipts | 40 | 28.3 | 33.7 | 36.1 | 32.2 | 34.1 | 31.8 | 32.9 | 32.8 | 31.4 | 32.9 | 34.0 | 34.7 | 35.0 | 35.3 | 35.8 | 36.4 |
| Dividends | 41 | 25.6 | 6.3 | 18.9 | 20.3 | −3.2 | 40.0 | 20.2 | 20.6 | 0.2 | −6.8 | −6.8 | −6.8 | 7.5 | 7.5 | 7.5 | 7.5 |
| Rents and royalties | 42 | 5.5 | 6.9 | 7.0 | 6.0 | 7.1 | 4.7 | 6.8 | 6.0 | 6.6 | 6.9 | 7.1 | 7.2 | 7.1 | 7.1 | 7.1 | 7.0 |
| Current transfer receipts | 43 | 83.9 | 74.1 | 85.5 | 86.5 | 82.3 | 113.5 | 70.7 | 92.8 | 68.8 | 76.2 | 80.3 | 84.6 | 87.9 | 89.6 | 89.1 | 88.6 |
| From business | 44 | 44.4 | 49.6 | 59.4 | 43.6 | 51.8 | 62.1 | 37.8 | 37.6 | 37.0 | 45.8 | 50.4 | 54.5 | 56.7 | 57.7 | 56.6 | 55.9 |
| From persons | 45 | 24.9 | 22.1 | 23.9 | 29.4 | 29.1 | 28.6 | 29.4 | 29.8 | 29.7 | 28.8 | 28.5 | 28.9 | 29.9 | 30.7 | 31.2 | 31.5 |
| From the rest of the world | 46 | 14.5 | 2.5 | 2.2 | 13.4 | 1.4 | 22.7 | 3.5 | 25.4 | 2.1 | 1.7 | 1.4 | 1.3 | 1.3 | 1.3 | 1.3 | 1.3 |
| Current surplus of government enterprises | 47 | 1.1 | −10.5 | 0.4 | −3.8 | −7.3 | −3.4 | −3.8 | −4.1 | −4.1 | −6.2 | −8.2 | −9.0 | −5.7 | −1.9 | 0.7 | 1.6 |
| Postal Service | 48 | −2.0 | −1.9 | −2.5 | −2.4 | −2.9 | −1.9 | −2.2 | −2.6 | −3.0 | −2.1 | −2.7 | −4.0 | −2.8 | −2.9 | −2.9 | −3.1 |
| Federal Housing Administration | 49 | 0.6 | −10.7 | 0.1 | −2.6 | −5.2 | −2.9 | −3.0 | −2.6 | −1.9 | −4.9 | −6.2 | −5.8 | −3.8 | 0.0 | 2.3 | 3.3 |
| Tennessee Valley Authority | 50 | 2.7 | 3.1 | 3.6 | 2.7 | 2.9 | 2.7 | 2.7 | 2.7 | 2.7 | 2.8 | 2.9 | 3.0 | 3.1 | 3.2 | 3.3 | 3.2 |
| Other | 51 | −0.3 | −1.0 | −0.9 | −1.5 | −2.2 | −1.2 | −1.4 | −1.6 | −1.8 | −2.0 | −2.2 | −2.2 | −2.2 | −2.1 | −1.9 | −1.7 |
| Current expenditures | 52 | 4,211.4 | 4,440.6 | 4,636.5 | 4,253.3 | 4,531.2 | 4,242.0 | 4,198.3 | 4,235.5 | 4,337.3 | 4,470.5 | 4,525.9 | 4,557.1 | 4,571.1 | 4,661.4 | 4,703.3 | 4,739.0 |
| Consumption expenditures | 53 | 975.6 | 1,026.0 | 1,049.8 | 977.8 | 1,064.2 | 968.0 | 970.8 | 981.1 | 991.5 | 1,058.5 | 1,070.1 | 1,070.2 | 1,058.0 | 1,065.6 | 1,075.5 | 1,086.3 |
| National defense | 54 | 585.9 | 619.6 | 651.3 | 588.7 | 627.7 | 581.6 | 584.7 | 590.1 | 598.5 | 618.1 | 628.7 | 630.4 | 633.4 | 644.3 | 656.3 | 668.2 |
| Pay raises and locality pay | 55 | ..... | 5.3 | 13.2 | ..... | 7.1 | ..... | ..... | ..... | ..... | 7.1 | 7.1 | 7.1 | 7.1 | 15.2 | 15.2 | 15.2 |
| January 2018 | 56 | ..... | 5.3 | 7.1 | ..... | 7.1 | ..... | ..... | ..... | ..... | 7.1 | 7.1 | 7.1 | 7.1 | 7.1 | 7.1 | 7.1 |
| January 2019 | 57 | ..... | ..... | 6.1 | ..... | ..... | ..... | ..... | ..... | ..... | 0.0 | 0.0 | 0.0 | 0.0 | 8.2 | 8.2 | 8.2 |
| Other | 58 | 585.9 | 614.3 | 638.1 | 588.7 | 620.6 | 581.6 | 584.7 | 590.1 | 598.5 | 611.0 | 621.6 | 623.4 | 626.4 | 629.1 | 641.1 | 653.0 |
| Nondefense | 59 | 389.8 | 406.4 | 398.5 | 389.1 | 436.5 | 386.3 | 386.1 | 391.0 | 393.0 | 440.3 | 441.4 | 439.8 | 424.6 | 421.3 | 419.1 | 418.1 |
| Pay raises and locality pay | 60 | ..... | 2.7 | 3.7 | ..... | 3.6 | ..... | ..... | ..... | ..... | 3.5 | 3.7 | 3.7 | 3.7 | 3.7 | 3.7 | 3.7 |
| January 2018 | 61 | ..... | 2.7 | 3.7 | ..... | 3.6 | ..... | ..... | ..... | ..... | 3.5 | 3.7 | 3.7 | 3.7 | 3.7 | 3.7 | 3.7 |
| January 2019 | 62 | ..... | ..... | 0.0 | ..... | ..... | ..... | ..... | ..... | ..... | 0.0 | 0.0 | 0.0 | 0.0 | 0.0 | 0.0 | 0.0 |
| Other | 63 | 389.8 | 403.7 | 394.9 | 389.1 | 432.9 | 386.3 | 386.1 | 391.0 | 393.0 | 436.9 | 437.7 | 436.1 | 420.9 | 417.6 | 415.5 | 414.4 |
| Current transfer payments | 64 | 2,692.4 | 2,816.7 | 2,936.2 | 2,709.4 | 2,819.9 | 2,700.9 | 2,685.6 | 2,718.3 | 2,732.8 | 2,783.4 | 2,813.7 | 2,833.7 | 2,848.8 | 2,918.9 | 2,934.6 | 2,939.4 |
| Government social benefits | 65 | 2,080.0 | 2,154.5 | 2,281.9 | 2,096.6 | 2,180.7 | 2,082.7 | 2,090.4 | 2,101.2 | 2,112.1 | 2,146.6 | 2,169.1 | 2,195.9 | 2,211.3 | 2,288.9 | 2,309.5 | 2,323.7 |
| To persons | 66 | 2,057.7 | 2,131.0 | 2,257.0 | 2,074.8 | 2,158.1 | 2,061.2 | 2,068.8 | 2,079.3 | 2,090.0 | 2,124.3 | 2,146.6 | 2,173.2 | 2,188.2 | 2,265.4 | 2,285.5 | 2,299.1 |
| Social Security | 67 | 918.6 | 964.8 | 1,024.0 | 926.1 | 979.7 | 916.1 | 922.8 | 930.0 | 935.4 | 964.0 | 974.1 | 984.8 | 995.9 | 1,028.4 | 1,034.0 | 1,036.8 |
| Regular | 68 | 918.6 | 950.5 | 986.9 | 926.1 | 960.7 | 916.1 | 922.8 | 930.0 | 935.4 | 945.0 | 955.1 | 965.7 | 976.9 | 985.3 | 990.9 | 993.6 |
| Benefit increases | 69 | ..... | 14.3 | 37.1 | ..... | 19.0 | ..... | ..... | ..... | ..... | 19.0 | 19.0 | 19.0 | 19.0 | 43.2 | 43.2 | 43.2 |
| January 2018 | 70 | ..... | 14.3 | 19.0 | ..... | 19.0 | ..... | ..... | ..... | ..... | 19.0 | 19.0 | 19.0 | 19.0 | 19.0 | 19.0 | 19.0 |
| January 2019 | 71 | ..... | ..... | 18.1 | ..... | 0.0 | ..... | ..... | ..... | ..... | 0.0 | 0.0 | 0.0 | 0.0 | 24.1 | 24.1 | 24.1 |
| Medicare | 72 | 669.5 | 692.3 | 742.2 | 674.3 | 702.4 | 667.4 | 671.5 | 676.4 | 681.9 | 685.7 | 695.0 | 706.9 | 722.1 | 737.8 | 749.8 | 759.3 |
| Unemployment benefits | 73 | 30.4 | 29.3 | 29.1 | 28.8 | 27.4 | 30.2 | 28.6 | 28.5 | 27.8 | 27.5 | 27.4 | 27.3 | 27.3 | 27.3 | 27.3 | 27.4 |
| Veterans benefits | 74 | 102.1 | 108.7 | 117.4 | 98.1 | 106.3 | 95.4 | 97.9 | 99.1 | 100.1 | 103.5 | 105.2 | 107.1 | 109.2 | 113.1 | 114.1 | 114.6 |
| Railroad retirement | 75 | 12.5 | 13.3 | 13.1 | 12.5 | 12.8 | 12.4 | 12.4 | 12.5 | 12.5 | 12.9 | 13.0 | 12.8 | 12.6 | 12.7 | 12.6 | 12.5 |
| Military medical insurance | 76 | 14.5 | 14.8 | 14.6 | 15.1 | 15.3 | 14.9 | 15.2 | 15.3 | 15.3 | 15.4 | 15.4 | 15.3 | 15.2 | 15.1 | 15.0 | 15.0 |
| Supplemental Nutrition Assistance Program benefits | 77 | 63.7 | 62.7 | 45.2 | 64.3 | 63.3 | 63.0 | 61.8 | 64.0 | 68.2 | 67.9 | 67.6 | 67.3 | 50.5 | 50.2 | 50.1 | 50.0 |
| Black lung benefits | 78 | 0.3 | 0.2 | 0.2 | 0.3 | 0.2 | 0.3 | 0.3 | 0.3 | 0.3 | 0.3 | 0.2 | 0.2 | 0.2 | 0.2 | 0.2 | 0.2 |
| Supplemental security income | 79 | 52.7 | 53.4 | 53.7 | 52.1 | 52.9 | 51.9 | 51.9 | 52.1 | 52.2 | 53.2 | 53.1 | 52.9 | 52.5 | 53.6 | 53.4 | 53.3 |
| Refundable tax credits | 80 | 133.0 | 131.6 | 143.0 | 139.7 | 131.5 | 143.4 | 141.8 | 138.4 | 135.4 | 132.6 | 132.3 | 131.4 | 129.9 | 149.8 | 149.0 | 148.7 |
| All other | 81 | 60.5 | 59.8 | 74.5 | 63.6 | 66.2 | 66.1 | 64.6 | 62.6 | 61.0 | 61.2 | 63.3 | 67.2 | 72.9 | 77.1 | 80.0 | 81.4 |
| To rest of the world | 82 | 22.4 | 23.5 | 24.9 | 21.8 | 22.7 | 21.5 | 21.7 | 21.9 | 22.1 | 22.3 | 22.5 | 22.7 | 23.1 | 23.6 | 24.0 | 24.6 |
| Grants-in-aid to state and local governments | 83 | 563.4 | 608.4 | 599.5 | 560.3 | 583.6 | 564.2 | 544.1 | 568.6 | 564.4 | 581.0 | 588.0 | 587.1 | 578.4 | 572.8 | 568.0 | 565.7 |
| General public service | 84 | 2.3 | 2.2 | 2.3 | 1.4 | 1.0 | 1.3 | 1.8 | 1.5 | 1.0 | 1.0 | 1.0 | 1.0 | 1.0 | 1.1 | 1.1 | 1.1 |
| National defense | 85 | 0.6 | 0.6 | 0.6 | 0.7 | 0.6 | 0.7 | 0.7 | 0.8 | 0.6 | 0.6 | 0.6 | 0.6 | 0.6 | 0.6 | 0.6 | 0.6 |
| Public order and safety | 86 | 4.9 | 5.2 | 4.0 | 4.1 | 2.9 | 4.5 | 4.3 | 4.2 | 3.2 | 3.2 | 3.1 | 2.8 | 2.3 | 2.0 | 1.8 | 1.6 |
| Economic affairs | 87 | 9.8 | 11.0 | 10.8 | 10.0 | 10.2 | 9.6 | 10.4 | 10.4 | 9.8 | 10.2 | 10.4 | 10.3 | 10.1 | 10.0 | 9.9 | 9.8 |
| Transportation3 | 88 | 0.1 | 0.1 | 0.1 | 0.1 | 0.1 | 0.1 | 0.1 | 0.1 | 0.1 | 0.1 | 0.1 | 0.1 | 0.1 | 0.1 | 0.1 | 0.1 |
| Space | 89 | 0.0 | 0.0 | 0.0 | 0.0 | 0.0 | 0.0 | 0.0 | 0.0 | 0.0 | 0.0 | 0.0 | 0.0 | 0.0 | 0.0 | 0.0 | 0.0 |
| Other economic affairs | 90 | 9.7 | 10.9 | 10.7 | 9.9 | 10.1 | 9.5 | 10.3 | 10.3 | 9.7 | 10.0 | 10.2 | 10.2 | 10.0 | 9.9 | 9.7 | 9.7 |
| General economic and labor affairs | 91 | 3.5 | 4.1 | 3.8 | 3.5 | 3.3 | 3.5 | 3.7 | 3.7 | 3.1 | 3.3 | 3.4 | 3.3 | 3.1 | 3.0 | 2.9 | 2.8 |
| Agriculture | 92 | 1.0 | 1.3 | 1.1 | 1.0 | 1.3 | 0.7 | 0.8 | 1.3 | 1.3 | 1.4 | 1.4 | 1.3 | 1.2 | 1.2 | 1.1 | 1.1 |
| Energy | 93 | 0.9 | 1.1 | 1.2 | 0.9 | 1.1 | 0.8 | 0.9 | 0.8 | 1.0 | 1.1 | 1.1 | 1.2 | 1.2 | 1.2 | 1.2 | 1.2 |
| Natural resources | 94 | 4.3 | 4.4 | 4.6 | 4.5 | 4.4 | 4.4 | 4.9 | 4.5 | 4.2 | 4.3 | 4.4 | 4.4 | 4.5 | 4.6 | 4.6 | 4.6 |
| Housing and community services | 95 | 17.9 | 19.0 | 19.6 | 18.2 | 18.7 | 17.5 | 19.2 | 17.7 | 18.2 | 18.4 | 18.6 | 18.8 | 18.9 | 19.1 | 19.1 | 19.2 |
| Health | 96 | 394.4 | 419.7 | 426.8 | 387.5 | 404.0 | 394.9 | 373.0 | 395.2 | 386.7 | 398.1 | 404.4 | 407.1 | 406.4 | 406.8 | 406.0 | 405.6 |
| Medicaid | 97 | 373.9 | 399.6 | 411.2 | 372.2 | 392.0 | 381.1 | 356.6 | 378.7 | 372.4 | 384.4 | 391.6 | 395.5 | 396.4 | 398.0 | 398.0 | 398.0 |
| Prescription drug plan clawback | 98 | −11.1 | −11.9 | −12.4 | −11.4 | −12.1 | −10.9 | −11.2 | −11.9 | −11.7 | −11.9 | −12.0 | −12.2 | −12.3 | −12.4 | −12.4 | −12.5 |
| Other | 99 | 31.6 | 32.1 | 28.0 | 26.7 | 24.1 | 24.6 | 27.6 | 28.5 | 26.0 | 25.6 | 24.8 | 23.7 | 22.2 | 21.1 | 20.4 | 20.0 |
| Recreation and culture | 100 | 0.4 | 0.5 | 0.4 | 0.2 | 0.3 | 0.3 | 0.2 | 0.2 | 0.2 | 0.3 | 0.3 | 0.3 | 0.2 | 0.2 | 0.2 | 0.2 |
| Education | 101 | 37.7 | 38.4 | 37.5 | 37.6 | 36.4 | 38.2 | 38.5 | 37.3 | 36.5 | 36.6 | 36.6 | 36.4 | 36.0 | 35.7 | 35.5 | 35.5 |
| Income security | 102 | 95.2 | 111.9 | 97.5 | 100.6 | 109.6 | 97.3 | 95.9 | 101.3 | 108.2 | 112.5 | 113.1 | 109.8 | 102.8 | 97.4 | 93.9 | 92.1 |
| Disability | 103 | 2.7 | 2.7 | 2.7 | 2.7 | 2.7 | 2.7 | 2.7 | 2.8 | 2.8 | 2.7 | 2.7 | 2.7 | 2.7 | 2.7 | 2.7 | 2.7 |
| Welfare and social services | 104 | 80.9 | 85.9 | 79.2 | 83.0 | 83.8 | 82.3 | 82.9 | 82.6 | 84.2 | 85.5 | 85.4 | 83.7 | 80.7 | 78.4 | 76.8 | 76.1 |
| Unemployment | 105 | 3.8 | 3.6 | 3.3 | 3.3 | 3.0 | 3.4 | 3.4 | 3.4 | 3.2 | 3.1 | 3.0 | 2.9 | 2.8 | 2.7 | 2.7 | 2.6 |
| Other | 106 | 7.8 | 19.6 | 12.3 | 11.6 | 20.1 | 8.8 | 6.8 | 12.6 | 18.0 | 21.2 | 22.0 | 20.5 | 16.6 | 13.6 | 11.7 | 10.7 |
| Other current transfer payments paid to the rest of the world | 107 | 49.0 | 53.8 | 54.7 | 52.4 | 55.6 | 54.0 | 51.0 | 48.5 | 56.2 | 55.9 | 56.6 | 50.7 | 59.1 | 57.2 | 57.0 | 50.0 |
| Federal interest paid | 108 | 482.1 | 536.1 | 592.7 | 504.9 | 585.0 | 512.7 | 482.3 | 475.3 | 549.5 | 565.2 | 579.4 | 592.1 | 603.4 | 617.8 | 635.4 | 656.1 |
| Subsidies | 109 | 61.3 | 61.7 | 57.8 | 61.1 | 62.0 | 60.5 | 59.6 | 60.8 | 63.4 | 63.5 | 62.7 | 61.1 | 60.9 | 59.1 | 57.9 | 57.3 |
| Agricultural | 110 | 12.1 | 10.9 | 9.8 | 12.4 | 10.9 | 12.8 | 12.7 | 12.3 | 11.7 | 11.4 | 11.1 | 10.8 | 10.4 | 10.2 | 10.0 | 9.9 |
| Housing | 111 | 37.2 | 37.6 | 35.3 | 36.3 | 35.7 | 36.8 | 36.2 | 35.8 | 36.3 | 36.4 | 36.2 | 35.6 | 34.7 | 33.9 | 33.5 | 33.2 |
| Other | 112 | 11.9 | 13.1 | 12.7 | 12.4 | 15.4 | 10.9 | 10.7 | 12.7 | 15.4 | 15.6 | 15.4 | 14.7 | 15.9 | 15.0 | 14.4 | 14.2 |
| Net federal government saving | 113 | −689.1 | −886.5 | −964.6 | −658.2 | −949.5 | −652.8 | −641.9 | −617.0 | −721.1 | −898.8 | −951.8 | −977.9 | −969.7 | −989.8 | −976.4 | −947.6 |
| Addenda: | |||||||||||||||||
| Gross investment4 | 114 | 279.7 | 293.1 | 318.6 | 282.8 | 299.5 | 276.4 | 285.0 | 282.5 | 287.3 | 290.9 | 295.6 | 301.4 | 310.0 | 316.6 | 322.6 | 328.2 |
| National defense | 115 | 151.5 | 159.9 | 176.9 | 155.7 | 162.1 | 148.6 | 156.6 | 156.5 | 160.9 | 156.5 | 159.3 | 163.1 | 169.5 | 174.4 | 179.4 | 184.4 |
| Nondefense | 116 | 128.1 | 133.2 | 141.7 | 127.1 | 137.4 | 127.8 | 128.4 | 125.9 | 126.4 | 134.5 | 136.3 | 138.3 | 140.5 | 142.2 | 143.3 | 143.8 |
| Consumption expenditures and gross investment | 117 | 1,255.3 | 1,319.1 | 1,368.4 | 1,260.7 | 1,363.7 | 1,244.3 | 1,255.8 | 1,263.5 | 1,278.9 | 1,349.4 | 1,365.7 | 1,371.7 | 1,368.0 | 1,382.2 | 1,398.1 | 1,414.5 |
| National defense | 118 | 737.4 | 779.5 | 828.1 | 744.4 | 789.8 | 730.2 | 741.4 | 746.7 | 759.4 | 774.6 | 788.0 | 793.6 | 802.9 | 818.7 | 835.7 | 852.6 |
| Nondefense | 119 | 517.9 | 539.6 | 540.3 | 516.2 | 573.9 | 514.1 | 514.5 | 516.9 | 519.5 | 574.8 | 577.7 | 578.1 | 565.1 | 563.5 | 562.4 | 561.9 |
| Total receipts | 120 | 3,544.9 | 3,578.6 | 3,688.6 | 3,617.0 | 3,602.1 | 3,610.5 | 3,578.0 | 3,640.2 | 3,639.1 | 3,594.9 | 3,596.3 | 3,599.1 | 3,617.9 | 3,685.8 | 3,739.9 | 3,804.5 |
| Current receipts | 121 | 3,522.3 | 3,554.0 | 3,671.9 | 3,595.0 | 3,581.6 | 3,589.2 | 3,556.4 | 3,618.4 | 3,616.2 | 3,571.7 | 3,574.1 | 3,579.2 | 3,601.4 | 3,671.6 | 3,726.9 | 3,791.4 |
| Capital transfer receipts | 122 | 22.6 | 24.5 | 16.7 | 21.9 | 20.4 | 21.3 | 21.6 | 21.8 | 22.9 | 23.2 | 22.2 | 20.0 | 16.5 | 14.2 | 13.1 | 13.1 |
| Total expenditures | 123 | 4,306.8 | 4,533.6 | 4,789.8 | 4,355.6 | 4,646.7 | 4,320.5 | 4,285.4 | 4,393.9 | 4,422.6 | 4,579.8 | 4,624.7 | 4,672.0 | 4,710.3 | 4,818.9 | 4,874.7 | 4,920.0 |
| Current expenditures | 124 | 4,211.4 | 4,440.6 | 4,636.5 | 4,253.3 | 4,531.2 | 4,242.0 | 4,198.3 | 4,235.5 | 4,337.3 | 4,470.5 | 4,525.9 | 4,557.1 | 4,571.1 | 4,661.4 | 4,703.3 | 4,739.0 |
| Gross government investment | 125 | 279.7 | 293.1 | 318.6 | 282.8 | 299.5 | 276.4 | 285.0 | 282.5 | 287.3 | 290.9 | 295.6 | 301.4 | 310.0 | 316.6 | 322.6 | 328.2 |
| Capital transfer payments | 126 | 87.5 | 81.5 | 116.7 | 93.8 | 92.9 | 75.4 | 76.2 | 150.2 | 73.5 | 94.5 | 80.1 | 91.0 | 106.1 | 118.1 | 126.1 | 130.1 |
| Net purchases of nonproduced assets | 127 | −2.2 | −5.6 | −4.4 | −0.5 | −0.4 | −0.4 | −0.6 | −0.3 | −0.7 | −0.7 | −0.7 | −0.7 | 0.5 | 0.5 | 0.5 | 0.5 |
| Less: Consumption of fixed capital | 128 | 269.6 | 275.9 | 277.6 | 273.8 | 276.5 | 272.8 | 273.6 | 273.9 | 274.9 | 275.6 | 276.2 | 276.9 | 277.3 | 277.6 | 277.7 | 277.7 |
| Net lending or net borrowing (–) | 129 | −761.9 | −955.0 | −1,101.2 | −738.7 | −1,044.6 | −710.0 | −707.4 | −753.7 | −783.5 | −984.9 | −1,028.4 | −1,072.9 | −1,092.4 | −1,133.1 | −1,134.8 | −1,115.5 |
- FICA
- Federal Insurance Contributions Act
- SECA
- Self-Employment Contributions Act
- NIPAs
- National income and product accounts
- Fiscal year estimates are the sum of quarterly estimates that are not seasonally adjusted and that are consistent with budget proposals.
- These estimates are published in the NIPA tables 3.2 and 3.9.5.
- Most transportation grants-in-aid to state and local governments are classified as capital transfers paid (see the addenda), but water and railroad transportation grants are still classified as current-account transactions.
- Gross investment consists of general government and government enterprise expenditures for fixed assets; inventory investment is included in federal government consumption expenditures.
Sources: Budget of the United States Government, Fiscal Year 2019 and the Bureau of Economic Analysis.
Budget estimates of government receipts are allocated into five major NIPA receipts categories: current tax receipts, contributions for government social insurance, income receipts on assets, current transfer receipts, and current surplus of government enterprises. These allocations are consistent with national accounting standards and are based on information and assumptions from the Budget and on projections of the effects of specific budget proposals from the Department of the Treasury's Office of Tax Analysis.
Budget estimates of government outlays are organized by appropriation in the Budget Appendix. These data and supplemental data from the Office of Management and Budget are used to allocate federal budget outlays into four major NIPA expenditures categories: current transfer payments, interest payments, subsidies, and consumption expenditures and gross investment.
The allocation of budget receipts and outlays into NIPA categories will be used, along with supplemental administrative data, to inform how federal government receipts and spending reported by the U.S. Treasury Department are allocated into NIPA categories to produce monthly and quarterly NIPA estimates.
When quarterly NIPA estimates are published, estimates of defense consumption expenditures and gross investment will be reconciled with outlays reported in the Monthly Treasury Statement using financial, delivery, and other information from the Department of Defense. For nondefense expenditures, extrapolations of budget data will be used to estimate some categories of spending, including expenditures for durable goods, other nondurable goods, services, and equipment for which no quarterly source data are available. Other categories of spending will incorporate quarterly source data, such as data for construction from the Census Bureau and for compensation from the Office of Personnel Management and the Bureau of Labor Statistics.
- For a historical perspective of the relationship between budget receipts and outlays and NIPA receipts and expenditures, see NIPA “Table 3.18B. Relation of Federal Government Current Receipts and Expenditures in the National Income and Product Accounts to the Budget.”
- For a more detailed accounting of the economic assumptions that underlie budget estimates, see chapter 2, “Economic Assumptions and Interactions with the Budget,” in the Analytical Perspectives volume of the Budget.
- The current services baseline for the fiscal year 2019 Budget includes the effects of the Tax Cuts and Jobs Act, which was enacted in December 2017.
- Because quarterly NIPA estimates are extrapolated from published estimates, the average of the 4 fiscal year quarters may not equal the displayed fiscal year values, which are consistent with budget data.