U.S. Travel and Tourism Satellite Account for 2015–2017
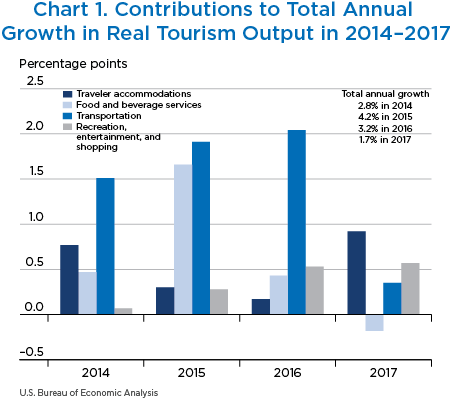
The travel and tourism industry—as measured by the real output of goods and services sold directly to visitors—decelerated to 1.7 percent growth in 2017 after increasing 3.2 percent in 2016, according to the most recent statistics from the Travel and Tourism Satellite Account (TTSA) of the Bureau of Economic Analysis (BEA).1 In contrast, the broader economy, as measured by real gross domestic product (GDP), increased 2.3 percent in 2017 after increasing 1.5 percent in 2016. Revised statistics on travel and tourism reflect the incorporation of the annual update of the industry economic accounts, which was released on November 2, 2017.2
Highlights from the TTSA include the following:
- Real output increased in 14 of 24 commodities in 2017. The largest contributors to the increase included traveler accommodations, international passenger air transportation services, and shopping.
- Real output growth slowed to 1.7 percent in 2017 from 3.2 percent in 2016, reflecting downturns in gasoline and food and beverage services spending as well as decelerations in automotive rental and leasing and domestic passenger air transportation services.
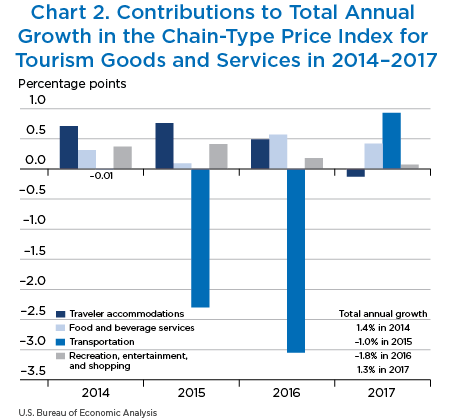
- Prices for tourism goods and services increased 1.3 percent in 2017 after decreasing 1.8 percent in 2016. The largest contributor to the increase in 2017 was gasoline, which increased 12.0 percent and contributed 1.03 percentage points to tourism goods and services price growth.
The TTSA is available on the BEA website; see the link “Data Availability.”
The remainder of this article includes a discussion of trends in travel and tourism output and prices, tourism value added, and employment.
Real output
The leading contributors to the 1.7 percent growth in real travel and tourism output were traveler accommodations, which increased 4.7 percent and contributed 0.92 percentage point to real output growth; international passenger air transportation services, which increased 6.7 percent and contributed 0.34 percentage point; and spending on nondurable consumer commodities, or shopping, which increased 2.8 percent and contributed 0.39 percentage point (table A and chart 1).
The slowdown in real output growth was led by the downturn in gasoline spending, which decreased 8.6 percent in 2017. This decrease followed six years of growth. Other large contributors to the deceleration included food and beverage services, which decreased 1.2 percent after increasing 2.9 percent in 2016, and spectator sports, which decreased 14.4 percent after decreasing 2.6 percent in 2016. Automotive rental and leasing also contributed to the slowdown; it decelerated to 4.8 percent growth in 2017 after increasing 12.7 percent in 2016.
The deceleration in real output growth was partly offset by an upturn in international passenger air transportation services, which increased 6.7 percent after a decrease of 5.4 percent in 2016.
Prices
Travel and tourism prices increased 1.3 percent in 2017 after two years of decline. The price increase was led by a 12.0 percent increase in the price of gasoline, contributing 1.03 percentage points to overall tourism price growth. Other contributors were the prices of food and beverage services, which grew 2.9 percent and contributed 0.42 percentage point.
The increase in overall tourism prices was offset by a 0.7 percent decrease in traveler accommodations prices and a 0.7 percent decrease in shopping prices. (table B and chart 2).
The upturn in tourism price growth was led by the upturn in the growth of gasoline prices, from a decline of 15.5 percent in 2016 to 12.0 percent growth in 2017. Additionally, the price of domestic passenger air transportation services turned up, increasing 0.1 percent after decreasing 3.5 percent, while the price of international passenger air transportation services remained on a downward trend (−0.3 percent). This is consistent with a smaller decrease in the price of travel arrangement and reservation services (−1.6 percent in 2017, compared with −14.6 percent in 2016), which also contributed to the upturn in tourism prices.
Total output
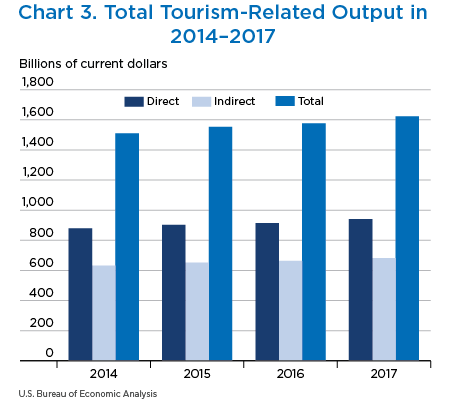
Total tourism-related nominal output increased to $1.62 trillion in 2017, increasing 2.9 percent from $1.58 trillion in 2016. In 2017, total output consisted of $940.9 billion in direct tourism output and $681.8 billion in indirect tourism output. The 1.72 ratio of total output to direct output in 2017 means that every dollar of direct tourism output requires an additional 72 cents of indirect tourism output (chart 3).
Direct tourism output includes goods and services sold directly to visitors, such as passenger air travel. Indirect tourism output includes sales of all goods and services used to produce that direct output, such as jet fuel to fly the plane and catering services for longer flights.
| Commodity | Annual growth rates (percent change from preceding period) |
Contributions (percentage points) |
Price Indexes (index number, 2009=100) |
|||||||||
|---|---|---|---|---|---|---|---|---|---|---|---|---|
| 2014 | 2015 | 2016 | 2017 | 2014 | 2015 | 2016 | 2017 | 2014 | 2015 | 2016 | 2017 | |
| All tourism goods and services | 1.4 | −1.0 | −1.8 | 1.3 | 1.38 | −1.04 | −1.81 | 1.30 | 113.5 | 112.6 | 110.3 | 111.5 |
| Traveler accommodations | 3.9 | 4.1 | 2.5 | −0.7 | 0.71 | 0.76 | 0.49 | −0.13 | 110.1 | 114.5 | 117.5 | 116.7 |
| Food and beverage services | 2.4 | 0.7 | 4.0 | 2.9 | 0.31 | 0.09 | 0.57 | 0.42 | 111.7 | 112.4 | 116.9 | 120.3 |
| Transportation | 0.0 | −5.3 | −7.2 | 2.6 | −0.01 | −2.30 | −3.05 | 0.93 | 119.8 | 113.4 | 105.2 | 107.9 |
| Passenger air transportation | 1.8 | −1.9 | −2.5 | −0.1 | 0.31 | −0.33 | −0.41 | −0.01 | 123.1 | 120.7 | 117.7 | 117.7 |
| Domestic passenger air transportation services | 2.5 | −0.8 | −3.5 | 0.1 | 0.27 | −0.09 | −0.40 | 0.01 | 123.7 | 122.7 | 118.4 | 118.5 |
| International passenger air transportation services | 0.6 | −3.9 | −0.3 | −0.3 | 0.04 | −0.23 | −0.01 | −0.02 | 122.1 | 117.3 | 117.0 | 116.7 |
| All other transportation-related commodities | −1.2 | −7.5 | −10.3 | 4.4 | −0.32 | −1.97 | −2.63 | 0.94 | 117.7 | 108.9 | 97.7 | 102.0 |
| Passenger rail transportation services | 0.8 | 4.3 | 5.7 | 1.8 | 0.00 | 0.01 | 0.01 | 0.00 | 113.5 | 118.3 | 125.0 | 127.3 |
| Passenger water transportation services | −0.7 | 2.5 | 7.0 | −1.2 | −0.01 | 0.04 | 0.10 | −0.02 | 95.9 | 98.2 | 105.1 | 103.8 |
| Intercity bus services | −0.4 | −5.8 | 5.9 | 9.1 | 0.00 | −0.01 | 0.01 | 0.01 | 118.1 | 111.3 | 117.8 | 128.6 |
| Intercity charter bus services | −0.4 | −2.5 | 2.0 | 9.5 | 0.00 | −0.01 | 0.00 | 0.02 | 118.1 | 115.2 | 117.5 | 128.7 |
| Local bus and other transportation services | 1.0 | 4.9 | −0.7 | 1.5 | 0.01 | 0.03 | 0.00 | 0.01 | 118.4 | 124.2 | 123.3 | 125.2 |
| Taxicab services | 1.2 | 2.1 | 1.7 | 1.7 | 0.01 | 0.01 | 0.01 | 0.01 | 118.4 | 120.9 | 123.0 | 125.1 |
| Scenic and sightseeing transportation services | 1.5 | 3.8 | −1.7 | 5.1 | 0.01 | 0.01 | −0.01 | 0.02 | 105.6 | 109.6 | 107.7 | 113.3 |
| Automotive rental and leasing | 3.3 | −8.9 | −6.1 | −1.7 | 0.13 | −0.36 | −0.24 | −0.07 | 100.0 | 91.1 | 85.6 | 84.2 |
| Other vehicle rental and leasing | −2.6 | 4.4 | −7.5 | −6.3 | 0.00 | 0.00 | −0.01 | −0.01 | 107.5 | 112.3 | 103.9 | 97.3 |
| Automotive repair services | 1.7 | 4.2 | −0.1 | 0.7 | 0.02 | 0.06 | 0.00 | 0.01 | 109.3 | 113.9 | 113.8 | 114.6 |
| Parking | 2.4 | 5.3 | −0.5 | 3.1 | 0.01 | 0.01 | 0.00 | 0.01 | 121.8 | 128.3 | 127.7 | 131.6 |
| Highway tolls | 1.5 | −2.8 | −2.6 | 3.2 | 0.00 | 0.00 | 0.00 | 0.00 | 116.3 | 113.0 | 110.1 | 113.6 |
| Travel arrangement and reservation services | 0.5 | 17.8 | −14.6 | −1.6 | 0.03 | 0.95 | −0.93 | −0.09 | 103.9 | 122.4 | 104.6 | 103.0 |
| Gasoline | −4.0 | −22.0 | −15.5 | 12.0 | −0.51 | −2.71 | −1.57 | 1.03 | 144.3 | 112.5 | 95.1 | 106.5 |
| Recreation, entertainment, and shopping | 1.5 | 2.8 | −0.1 | −1.1 | 0.37 | 0.41 | 0.18 | 0.07 | 107.9 | 110.8 | 110.7 | 109.6 |
| Recreation and entertainment | 1.8 | 3.6 | −0.3 | −1.5 | 0.19 | 0.12 | 0.17 | 0.17 | 108.8 | 112.8 | 112.5 | 110.8 |
| Motion pictures and performing arts | 2.2 | 2.3 | 3.6 | 2.6 | 0.04 | 0.04 | 0.07 | 0.05 | 108.2 | 110.7 | 114.7 | 117.6 |
| Spectator sports | 2.9 | 8.2 | 2.7 | 1.9 | 0.02 | 0.04 | 0.01 | 0.01 | 111.4 | 120.5 | 123.8 | 126.1 |
| Participant sports | 1.6 | 0.6 | 1.6 | 2.4 | 0.02 | 0.01 | 0.02 | 0.03 | 104.5 | 105.1 | 106.8 | 109.4 |
| Gambling | 1.6 | 0.9 | 1.0 | 1.5 | 0.09 | 0.05 | 0.05 | 0.08 | 110.4 | 111.4 | 112.5 | 114.2 |
| All other recreation and entertainment | 1.7 | −1.6 | 1.3 | −0.2 | 0.02 | −0.02 | 0.02 | 0.00 | 107.5 | 105.7 | 107.0 | 106.8 |
| Shopping | 1.3 | 2.1 | 0.1 | −0.7 | 0.18 | 0.28 | 0.01 | −0.10 | 107.0 | 109.3 | 109.4 | 108.6 |
Value added
A sector’s value added measures its contribution to gross domestic product (GDP). In 2016 (the most recent year for which data are available), the travel and tourism industry’s share of GDP was 2.8 percent (table C). Travel and tourism accounted for a larger share of GDP than several other industries including broadcasting and telecommunications, utilities, mining, and educational services.
| Year | Billions of dollars | Percent | |
|---|---|---|---|
| Gross domestic product (GDP) |
Tourism value added |
Tourism value added as a share of GDP |
|
| 2008 | 14,719 | 391 | 2.66 |
| 2009 | 14,419 | 366 | 2.54 |
| 2010 | 14,964 | 377 | 2.52 |
| 2011 | 15,518 | 404 | 2.60 |
| 2012 | 16,155 | 422 | 2.61 |
| 2013 | 16,692 | 435 | 2.61 |
| 2014 | 17,428 | 453 | 2.60 |
| 2015 | 18,121 | 496 | 2.74 |
| 2016 | 18,624 | 517 | 2.78 |
Direct employment
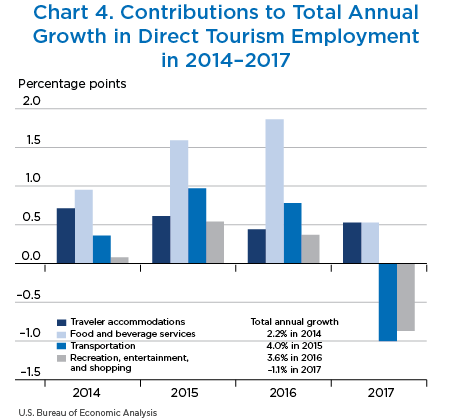
Direct tourism employment refers to jobs that are directly related to visitor spending on goods and services. Airline pilots, hotel clerks, and travel agents are examples of such employees. Overall, direct employment declined 1.1 percent in 2017 after increasing 3.6 percent in 2016. The largest contributors to the decline were retail trade services excluding gasoline service stations, which lost 27,000 jobs in 2017, and air transportation services, which lost 21,000 jobs (chart 4 and table D).
| Commodity | Annual growth rates (percent change from preceding period) |
Contributions (percentage points) |
Direct employment (thousands) |
|||||||||
|---|---|---|---|---|---|---|---|---|---|---|---|---|
| 2014 | 2015 | 2016 | 2017 | 2014 | 2015 | 2016 | 2017 | 2014 | 2015 | 2016 | 2017 | |
| All tourism industries | 2.2 | 4.0 | 3.6 | −1.1 | 2.18 | 3.98 | 3.58 | −1.14 | 5174 | 5380 | 5573 | 5509 |
| Traveler accommodations | 2.7 | 2.3 | 1.7 | 2.1 | 0.71 | 0.61 | 0.44 | 0.53 | 1374 | 1405 | 1429 | 1459 |
| Vacation Home Rentals | −3.1 | −5.3 | −3.5 | 3.6 | 0.00 | −0.01 | 0.00 | 0.00 | 8 | 7 | 7 | 7 |
| Food services and drinking places | 3.3 | 5.4 | 6.2 | 1.7 | 0.95 | 1.59 | 1.86 | 0.53 | 1530 | 1612 | 1712 | 1742 |
| Transportation | 1.8 | 4.7 | 3.8 | −4.8 | 0.36 | 0.97 | 0.78 | −1.00 | 1063 | 1113 | 1155 | 1099 |
| Air transportation services | 1.3 | 4.1 | 3.7 | −4.5 | 0.12 | 0.35 | 0.32 | −0.38 | 440 | 458 | 475 | 454 |
| All other transportation-related industries | 2.1 | 5.2 | 3.8 | −5.1 | 0.25 | 0.62 | 0.47 | −0.62 | 623 | 656 | 681 | 646 |
| Rail transportation services | 0.9 | 7.4 | −1.4 | 2.0 | 0.00 | 0.01 | 0.00 | 0.00 | 10 | 11 | 11 | 11 |
| Water transportation services | 6.6 | 6.2 | 4.4 | −6.1 | 0.04 | 0.04 | 0.03 | −0.04 | 33 | 35 | 36 | 34 |
| Interurban bus transportation | −0.1 | 3.1 | −2.8 | 2.4 | 0.00 | 0.01 | −0.01 | 0.01 | 18 | 19 | 18 | 19 |
| Interurban charter bus transportation | 1.3 | −0.2 | −0.7 | −0.3 | 0.00 | 0.00 | 0.00 | 0.00 | 13 | 13 | 13 | 13 |
| Urban transit systems and other transportation | 3.6 | 13.1 | 4.9 | −12.8 | 0.03 | 0.10 | 0.04 | −0.11 | 41 | 46 | 49 | 42 |
| Taxi service | 6.5 | −6.5 | 0.0 | 5.3 | 0.05 | −0.05 | 0.00 | 0.04 | 41 | 39 | 39 | 41 |
| Scenic and sightseeing transportation services | 3.9 | 2.9 | 3.7 | −4.2 | 0.01 | 0.01 | 0.01 | −0.01 | 16 | 16 | 17 | 16 |
| Automotive equipment rental and leasing | 3.9 | 5.7 | 2.7 | −2.7 | 0.07 | 0.10 | 0.05 | −0.05 | 95 | 100 | 103 | 100 |
| Automotive repair services | −9.4 | 5.1 | 4.3 | −4.9 | −0.10 | 0.05 | 0.04 | −0.05 | 51 | 54 | 56 | 53 |
| Parking lots and garages | 5.5 | 10.2 | −1.3 | −1.3 | 0.02 | 0.03 | 0.00 | 0.00 | 17 | 19 | 19 | 19 |
| Toll highways | 1.6 | 4.4 | 3.5 | −3.6 | 0.00 | 0.00 | 0.00 | 0.00 | 4 | 4 | 5 | 4 |
| Travel arrangement and reservation services | 1.6 | 3.5 | 6.0 | −7.5 | 0.05 | 0.12 | 0.20 | −0.26 | 176 | 182 | 193 | 179 |
| Petroleum refineries | 4.8 | 10.5 | 4.4 | −7.2 | 0.01 | 0.02 | 0.01 | −0.01 | 9 | 10 | 10 | 9 |
| Gasoline service stations | 3.5 | 8.8 | 4.7 | −6.3 | 0.07 | 0.17 | 0.10 | −0.13 | 99 | 108 | 113 | 106 |
| Recreation, entertainment, and shopping | 0.4 | 2.8 | 2.0 | −4.7 | 0.08 | 0.54 | 0.37 | −0.87 | 987 | 1014 | 1034 | 986 |
| Recreation and entertainment | −1.5 | −0.2 | 0.0 | −2.1 | −0.15 | −0.02 | 0.00 | −0.19 | 515 | 513 | 513 | 503 |
| Motion pictures and performing arts | 20.6 | 14.1 | 2.5 | −31.3 | 0.09 | 0.08 | 0.01 | −0.18 | 28 | 32 | 33 | 23 |
| Spectator sports | 2.1 | 9.1 | 2.7 | −16.2 | 0.02 | 0.10 | 0.03 | −0.18 | 55 | 60 | 62 | 52 |
| Participant sports | −4.7 | −4.5 | −2.1 | 7.0 | −0.20 | −0.17 | −0.08 | 0.24 | 201 | 192 | 188 | 201 |
| Gambling | −1.1 | −1.0 | 0.0 | −1.2 | −0.04 | −0.04 | 0.00 | −0.04 | 175 | 174 | 174 | 171 |
| All other recreation and entertainment | −2.9 | 1.1 | 3.0 | −2.6 | −0.03 | 0.01 | 0.03 | −0.03 | 55 | 56 | 58 | 56 |
| Shopping | 2.6 | 6.2 | 4.0 | −7.3 | 0.23 | 0.56 | 0.37 | −0.68 | 472 | 501 | 521 | 483 |
| Industries producing nondurable PCE commodities, excluding petroleum refineries | 2.2 | 6.9 | 5.1 | −8.0 | 0.05 | 0.16 | 0.12 | −0.19 | 120 | 128 | 135 | 124 |
| Retail trade services, excluding gasoline service stations | 2.7 | 5.9 | 3.6 | −7.0 | 0.18 | 0.40 | 0.25 | −0.49 | 352 | 373 | 386 | 359 |
| All other industries | 1.9 | 6.8 | 3.2 | −8.0 | 0.08 | 0.28 | 0.14 | −0.34 | 213 | 228 | 235 | 216 |
| All other industries, excluding Wholesale trade and transportation services | −1.7 | 3.2 | 1.0 | −5.4 | −0.02 | 0.04 | 0.01 | −0.06 | 57 | 59 | 59 | 56 |
| Wholesale trade and transportation services | 3.2 | 8.0 | 4.0 | −8.9 | 0.10 | 0.24 | 0.12 | −0.28 | 157 | 169 | 176 | 160 |
- PCE
- Personal consumption expenditures
Total employment
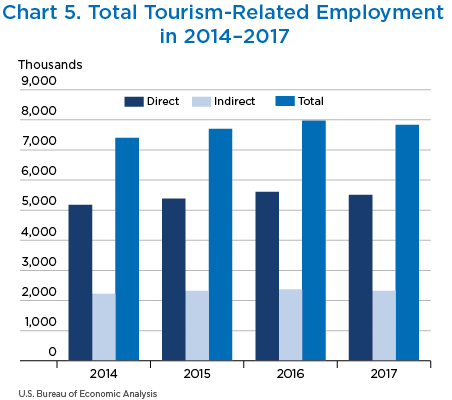
Total tourism-related employment (the sum of direct and indirect jobs) decreased to 7.8 million jobs in 2017 from 8.0 million jobs in 2016. The 7.8 million jobs consisted of 5.5 million direct tourism jobs and 2.3 million indirect tourism jobs (chart 5). While direct tourism employment includes jobs that produce direct tourism output, such as airline pilots, indirect tourism employment is also generated in the businesses that supply goods and services to the tourism sector, such as refinery workers producing jet fuel. The most recent data indicate that for every 100 jobs supported directly by the travel and tourism industry, an additional 42 indirect tourism jobs are also required.
- All measures of travel and tourism activity not identified as being in “real,” inflation-adjusted terms are current-dollar estimates.
- For more information, see Kevin B. Barefoot, Teresa L. Gilmore, and Chelsea K. Nelson, “The 2017 Annual Update of the Industry Economic Accounts: Initial Statistics for the Second Quarter of 2017 and Revised Statistics for 2014–2016 and the First Quarter of 2017,” Survey of Current Business (December 2017).
