
Integrated Industry-Level Production Account for the United States
Experimental Statistics for 1987–1997, Revised Statistics for 1998–2015, and Initial Statistics for 2016
On June 29, 2018, the integrated industry-level production account was expanded to include experimental historical statistics covering 1987–1997. This new dataset added more than a decade of historical data to the time series, enhancing the usefulness of the production account by allowing analysis of economic trends over a longer period. These statistics were prepared as part of an ongoing collaboration between the Bureau of Economic Analysis (BEA) and the Bureau of Labor Statistics (BLS).2
These new historical data provide information on the sources of economic growth over roughly three decades of economic history. The data reveal that about half of economic growth over this period was due to the accumulation of capital inputs. About 30 percent was due to growth in labor input, while the remainder (about 20 percent) was due to growth in multifactor productivity (MFP). The industry dataset shows that aggregate growth in capital input was driven by capital services growth employed in the trade; information; and finance, insurance, and real estate sectors. The preponderance of the contribution of labor input was due to an increase of labor services in the services industries, while the large majority of aggregate MFP growth was accounted for by MFP growth in the computer and electronic manufacturing and trade sectors.
In addition to the new historical data, the account was also updated to include revised data for 1997–2015 and new estimates for 2016. Minor revisions throughout this period are due to the incorporation of updated data on capital and labor inputs from the BLS’s productivity program published on March 21, 2018. Furthermore, revisions for 2014 and 2015 reflect new data from BEA’s most recent annual update to the industry accounts published on November 2, 2017.
The conceptual framework that underpins the estimates is identical throughout the time series. However, more limited data availability required that different techniques be employed to prepare estimates in the earlier periods. The primary purpose of this article is to summarize the insights gained from the new data for 1986–1996 and the methodology and data sources underpinning the results. Fleck and others (2012) provide a more detailed discussion of the methodologies and source data. The remainder of the article will provide an overview of the methodology and data sources as well as the results.
The integrated industry-level production account decomposes growth in industry gross output into contributions from growth in intermediate inputs, capital, labor, and MFP. Data on gross output and intermediate inputs by industry are drawn from BEA’s GDP by industry statistics while data on capital and labor inputs come primarily from BLS’s productivity program. Total capital and labor compensation by industry are controlled to match value added by industry estimates from BEA. As described below, labor, capital, and intermediate inputs are adjusted to account for changes in composition over time. Growth in MFP is defined residually as the difference between industry output growth and the sum of the share-weighted growth in industry inputs of intermediates, capital, and labor.
Gross output and intermediate inputs
BEA’s GDP by industry statistics provide a time series of nominal and real gross output, intermediate inputs (including a decomposition of energy, materials, and purchased services inputs), and value added by industry; the statistics are based on the 2007 North American Industry Classification System (NAICS). These data are fully integrated with expenditure-based GDP estimates from the National Income and Product Accounts (NIPAs). In addition, the data are prepared within a balanced supply-use framework that allows for simultaneous and consistent analysis of industry output, inputs, value added, and final demand.
These fully integrated statistics originally covered 1997–2012 and were subsequently extended to cover 1997–2015 (Kim and others 2014, Barefoot and others 2017). The earlier versions of the industry-level production account included statistics beginning with 1998. However, in February 2016, BEA released integrated make-use tables and GDP by industry statistics extending back to 1947, adding a half century of historical data to this time series. The availability of these new historical data opened the possibility of extending the industry-level production account back in time as well.
Gross output and intermediate inputs: Backcasting
The preparation of the historical make-use tables and GDP by industry statistics relied heavily on a series of benchmark input-output tables prepared by BEA for 1947 to 1992.3 Following a multi-step process, the tables were updated to incorporate definitional and conceptual changes to achieve consistency with the GDP by industry statistics covering 1997–2016. These updates included conversion from Standard Industrial Classification (SIC) industries to NAICS industries, capitalization of software and intellectual property products, and changes in the treatment of output for insurance and banking, among others. Annual tables were prepared for the inter-benchmark periods by interpolating between benchmark tables using a variety of indicators and each of these tables was then controlled to be consistent with historical GDP data using RAS balancing (Lyndaker and others 2016).
For the industry-level production account, additional steps were taken to decompose the historical time series of intermediate inputs into energy, materials, and purchased services (EMS) components. Although the time series of make-use tables for 1963–1996 includes a decomposition of intermediate inputs into 75 commodities, this level of detail was not sufficient to make a one-to-one assignment for each commodity to an EMS category. To address this, ratios for the EMS components of these 75 commodities were developed from the much more detailed working level data of the 1997 use table. These fixed ratios were applied to the historical use tables to generate estimates of EMS inputs for each industry for 1987–1996.
With the nominal data available in the make-use framework, estimates of real GDP by industry were prepared by double deflation, which is the standard methodology in the published GDP by industry statistics (Moyer and others 2004). Prices used for deflation were described in more detail in the article that accompanied the initial publication of the historical GDP by industry statistics (Lyndaker and others 2016).
Gross output and intermediate inputs: Revisions
This 2017 annual update to BEA’s GDP by Industry statistics incorporated the Census Bureau’s latest Service Annual Survey (SAS) tabulations, which revised statistics for 2014 and 2015. In addition, newly available data for 2016 from SAS replaced estimates based on the Census Bureau’s Quarterly Services Survey (QSS). Similarly, revised and newly available data from the Department of Treasury’s Statistics of Income (SOI) Division led to revisions in the underlying components of current-dollar value added by industry for 2014 and 2015. In addition, the annual update incorporated newly available Census Bureau data from the2015 Annual Retail Trade Survey, and the 2015 Annual Wholesale Trade Survey as well as data from the 2015 Annual Survey of Manufactures.
Capital services inputs
Capital services estimates reflect the price and quantity of the annual service flow into production from a capital asset over its useful life. Conceptually, “productive” capital stock represents the amount of new investment that would be required to produce the same flow of capital services as is actually produced by existing assets of all vintages. In other words, capital services are assumed to be proportional to the productive stock. The price of service flows or “rental price” for each asset is constructed so that the discounted value of all future services is equal to the purchase price of the asset.
Capital inputs: Backcasting
Estimates of productive capital stocks are constructed by BLS as vintage aggregates of real historical investments using the perpetual inventory method (Fleck and others 2012). Because net stocks require a vintage accounting of all previous investments, historical stocks covering 1987–1997 were already produced for the earlier releases of the industry level production account. However, calculation of historical rental prices required estimates of current-dollar value added components by industry from BEA’s historical make-use tables. With the release of the 2016 multifactor productivity statistics (Bureau of Labor Statistics 2017), BLS integrated these improved data into their official measures and these data are also used for this integrated industry-level production account.
Capital inputs: Revisions
Capital measures for the finance and insurance industries were revised to be more consistent with the national accounts. Previously, controls for capital compensation in these industries were not constrained to BEA income estimates due to concerns over certain features of the more detailed components of income. These concerns were addressed following improvements to the insurance and banking estimates with BEA’s 2013 comprehensive update, allowing capital compensation to be measured in the same manner for all industries in this set of accounts. See Strassner and Wasshausen (2013) and Hood (2013) for more details. This treatment of capital was also adopted by BLS with the publication of BLS Multifactor Productivity Trends 2017 (Bureau of Labor Statistics 2018). In real terms, the revisions to the capital input measures were small. In addition, a small correction to the constant-dollar investment of the aircraft asset in the finance industries was made to align with the BEA Fixed Asset Accounts.
Finally, capital services were revised to reflect an improved estimation method for the distribution of inventories among most non-manufacturing industries. BLS uses IRS book value data to distribute BEA “other” inventories to non-manufacturing industries (excluding mining, construction, and utilities). During this process, BLS employs a 3-year smoothing of the IRS book values for the data processing, internet publishing industry from 1999 through the last year available, whereas previously smoothing was only applied to 1999–2008.
Labor input
Labor hours
As in previous versions of this account, BLS prepared a time series of labor hours reflecting annual hours worked based on payroll employment and hours from BLS’s Current Employment Statistics (CES) survey as well as data on the number of self-employed persons and their average weekly hours from the Current Population Survey (CPS) (Fleck and others 2012). BLS’s National Compensation Survey (NCS) was also used to convert the hours of payrolled workers from a paid to a worked basis. Sources for industries that are not covered by CES or where data are missing include the Department of Agriculture, BLS’s Quarterly Census of Employment and Wages (QCEW), and Mine Safety and Health Administration (Rosenthal and others 2014).
Labor hours: Backcasting
In 2003, BLS’s CES program released historical employment and average weekly hours data for detailed industries on a NAICS basis back to 1990, along with the bridge ratios used in converting these measures. These data serve as the basis for the estimates in this set of accounts prior to 1997 and are consistent with the data after 1997. For the period before 1990, the CES provides reconstructed historical measures for all 2 digit NAICS sectors as well selected 3-digit, 4-digit, 5-digit, and 6-digit industries.
Where available, complete NAICS-based payrolled employment and hours from the CES series were used in the industry level production account. For the industries that were not available from CES, employment estimates were developed using historical SIC-based measures and conversion factors published by BLS’s CES program to reconstruct NAICS-based series back to 1987. The resulting converted employment estimates were historically linked to the published CES employment data series in 1990 to avoid series breaks. Hours for 1987–1989 were derived using a similar approach. To estimate consistent historical NAICS-based self-employed and supervisory average weekly hour estimates for 1987–2002, historical CPS data are converted from an SIC-based industry code to the NAICS-based codes used in this set of accounts. This conversion makes use of a 3-year average SIC-to-NAICS conversion bridge which was derived from SIC-NAICS dual coded CPS data from 2000–2002.
With the March 2017 release of Productivity and Costs data, BLS made an improvement to the hours paid to hours worked ratios for payrolled workers (Bureau of Labor Statistics 2017). From 2005 onward, fourth-quarter NCS data at the 3-digit NAICS level are used in place of the annual ratio value, as 98 percent of the sample rotation occurs during the fourth quarter during these years, and responses for subsequent quarters are generally held the same as the initial response. From 1996 through 2004, however, an average of the four quarterly NCS ratios is used as the NCS sample rotation was intermittent throughout the year. For 1990–1996, the 1996 NCS ratio values were carried backwards using BLS’s Hours At Work Survey (HWS) as an extrapolator series. For 1987–1989, ratios for 14 super sectors from the HWS were applied to backcast the ratios for more detailed industries.
Labor hours: Revisions
This update of the industry level production accounts reflects (1) improvements in the CES for educational services, health care and social assistance and (2) the incorporation of the all-employee hours measure for couriers and messengers within other transportation and support activities. These actions led to revisions throughout the time series (Petty and Hu 2014).
Labor composition
In order to create a constant quality index of labor input, hours worked are weighted to account for substitution between heterogeneous types of labor reflecting different skill levels. The change in labor input due to shifts in worker characteristics is referred to as the labor composition effect. For this set of accounts, workers are cross-classified by sex, age, education, employment class (payrolled vs. self-employed), and industry. Following this disaggregation, matrices of employment, hours, and compensation are initialized using the U.S. Census 1990 and 2000 1-Percent Public Use Microdata Sample (PUMS) files. These initial estimates are iteratively adjusted using the RAS balancing technique to match a series of marginal controls developed from the March supplement to the CPS.4 After balancing, the matrices are scaled to a sequence of employment, hours, and compensation controls from BLS and the NIPAs. In the final step, the hourly compensation of self-employed workers is replaced by the rate for payrolled workers in the same cell to avoid comingling labor and capital compensation for those workers. Additional methodological information is described in Fleck and others (2014) with updates in Rosenthal and others (2014).
Labor composition: Backcasting
Previous publications of these accounts made use of an SIC-to-NAICS bridge from the BLS CES program to convert SIC-based labor source data NAICS industries for 1998–2002. In preparing the new historical period covered by these accounts, a modified SIC-to-NAICS bridge was constructed to incorporate time-varying weights for manufacturing industries. These dynamic, employment-based weights were supplied by the Federal Reserve Board based on research from Bayard (2003), which made use of establishment-level microdata from the Census of Manufacturing and the Annual Survey of Manufactures spanning 1963–1997. For the period between 1997 and 2000, all updated manufacturing weights were interpolated to the static weights from the previous bridge.
The modified SIC-to-NAICS bridge was applied to the U.S. Census 1990 PUMS files as well as the 1987–2002 March CPS files to develop the labor composition matrices for these years. The bridge was also used in part to convert the SIC-based NIPA employment, hours, and compensation scaling controls to NAICS industries for 1987–1997. In addition to the modified bridge, the 1987–1991 March Supplement of the CPS required special handling for the reported level of educational attainment. Prior to 1992, respondents were asked for their number of years of schooling, whereas from 1992 on, respondents have been asked to select their highest degree attained. The number of years of schooling for the early periods were converted to an estimated highest degree attained via a frequency matrix developed from matched CPS respondents who had reported educational attainment under both versions of the questionnaire (Jaeger 1997).
Labor composition: Revisions
Revisions to the period 1998–2000 are a result of the interpolated Census PUMs matrices. The process of controlling to the CPS redistributed the marginal matrices based on the shares that resulted from the RAS procedure. Beyond that, revisions reflect updates to incorporate the latest data with hours and compensation estimates and are typically limited to 2014–2015.
The major advantage of the longer time series of integrated KLEMS (K-capital, L-labor, E-energy, M-materials, and S-purchased services) data is that it permits analysis of longer-term economic trends. Over the last three decades, this includes the information technology (IT) revolution and increased globalization of the production process. The dataset described above is an important tool for identifying the structural change that has taken place between 1987 and 2016, particularly at the industry level. This section describes industry-level sources of growth, including the industry-level contributions of capital, labor, and productivity to economic growth, as well as some aspects of structural change over this longer time period. To facilitate this discussion, results are focused on nine sectors that reflect major industry groupings, rather than the 63 industries described above.5
Industry-level sources of output growth for 1987–2016 are shown in table 1. Over this period, the three fastest growing industries were IT: computer systems design; data processing, internet publishing, and other information services; and computer and electronic products manufacturing, reflecting not only the importance of IT hardware, but also the related systems and development as well as the shift towards cloud computing. The textile and paper manufacturing industries contracted over the period. Since the Great Recession, imports in these three industries have shown robust growth, likely reflecting increased competition from foreign products and other shifts in demand toward cheaper substitutes. Relatively strong growth in rental and leasing; broadcasting and telecommunications; and data processing was driven by capital investments, while growth in computer systems design; social assistance; and warehousing and storage was driven by growth in labor inputs, reinforcing the importance of looking at the input side when analyzing the sources of growth. Between 1987 and 2016, the computer and electronic products; securities, commodity contracts, and investments; and warehousing and storage had the largest growth in MFP.
| Output growth | Capital contribution | Labor contribution | Intermediate contribution | MFP growth | |
|---|---|---|---|---|---|
| Farms | 1.69 | 0.09 | −0.18 | 0.37 | 1.42 |
| Forestry, fishing, and related activities | 0.11 | 0.42 | 0.99 | −0.49 | −0.81 |
| Oil and gas extraction | 1.29 | −0.08 | −0.08 | 0.06 | 1.40 |
| Mining, except oil and gas | 0.39 | 0.39 | −0.25 | −0.51 | 0.77 |
| Support activities for mining | 1.46 | 0.21 | 0.45 | −0.56 | 1.36 |
| Utilities | 0.31 | 0.74 | 0.03 | 0.05 | −0.50 |
| Construction | 0.39 | 0.21 | 0.52 | 0.34 | −0.68 |
| Wood products | 0.15 | 0.06 | −0.24 | 0.58 | −0.24 |
| Nonmetallic mineral products | 0.20 | 0.14 | −0.07 | 0.05 | 0.08 |
| Primary metals | 0.49 | −0.07 | −0.30 | 0.18 | 0.68 |
| Fabricated metal products | 1.18 | 0.18 | 0.05 | 0.99 | −0.04 |
| Machinery | 1.09 | 0.30 | −0.04 | 1.00 | −0.18 |
| Computer and electronic products | 6.56 | 0.56 | −0.49 | 0.53 | 5.96 |
| Electrical equipment, appliances, and components | 0.14 | 0.17 | −0.39 | 0.13 | 0.23 |
| Motor vehicles, bodies and trailers, and parts | 2.55 | 0.24 | 0.02 | 1.76 | 0.52 |
| Other transportation equipment | 1.04 | 0.23 | −0.28 | 1.37 | −0.28 |
| Furniture and related products | 0.16 | 0.16 | −0.33 | 0.33 | 0.00 |
| Miscellaneous manufacturing | 1.75 | 0.46 | 0.21 | 0.41 | 0.67 |
| Food and beverage and tobacco products | 1.10 | 0.25 | 0.09 | 0.93 | −0.17 |
| Textile mills and textile product mills | −1.90 | −0.10 | −0.85 | −1.44 | 0.49 |
| Apparel and leather and allied products | −2.95 | 0.00 | −1.74 | −1.75 | 0.54 |
| Paper products | −0.25 | 0.09 | −0.29 | 0.17 | −0.21 |
| Printing and related support activities | −0.77 | 0.01 | −0.53 | −0.75 | 0.51 |
| Petroleum and coal products | 0.85 | 0.10 | −0.07 | 0.00 | 0.81 |
| Chemical products | 1.29 | 1.12 | −0.01 | 0.71 | −0.53 |
| Plastics and rubber products | 1.37 | 0.29 | 0.02 | 0.71 | 0.35 |
| Wholesale trade | 3.31 | 1.12 | 0.43 | 0.82 | 0.94 |
| Retail trade | 2.93 | 0.86 | 0.37 | 0.78 | 0.91 |
| Air transportation | 0.99 | 0.40 | 0.05 | −0.03 | 0.57 |
| Rail transportation | 1.04 | 0.07 | −0.73 | 0.60 | 1.10 |
| Water transportation | 2.58 | 0.04 | 0.33 | 1.13 | 1.08 |
| Truck transportation | 2.89 | 0.35 | 0.49 | 1.73 | 0.31 |
| Transit and ground passenger transportation | 1.60 | 0.41 | 1.05 | 0.57 | −0.42 |
| Pipeline transportation | −0.44 | 1.12 | 0.03 | −2.43 | 0.84 |
| Other transportation and support activities | 2.85 | 0.02 | 1.35 | 2.04 | −0.56 |
| Warehousing and storage | 5.91 | 0.30 | 2.03 | 2.15 | 1.44 |
| Publishing industries, except Internet (includes software) | 3.31 | 0.90 | 0.07 | 0.95 | 1.38 |
| Motion picture and sound recording industries | 2.45 | 1.40 | 0.57 | 0.68 | −0.19 |
| Broadcasting and telecommunications | 4.77 | 1.90 | 0.00 | 2.29 | 0.58 |
| Data processing, internet publishing, and other information services | 7.12 | 2.58 | 1.09 | 3.62 | −0.17 |
| Federal Reserve banks, credit intermediation, and related activities | 1.52 | 1.87 | 0.30 | 0.68 | −1.33 |
| Securities, commodity contracts, and investments | 6.49 | 0.15 | 1.06 | 3.19 | 2.10 |
| Insurance carriers and related activities | 2.77 | 1.27 | 0.49 | 0.64 | 0.37 |
| Funds, trusts, and other financial vehicles | 2.78 | 0.11 | 0.07 | 2.35 | 0.26 |
| Real estate | 2.72 | 1.39 | 0.06 | 0.94 | 0.33 |
| Rental and leasing services and lessors of intangible assets | 3.63 | 3.99 | 0.18 | 1.73 | −2.27 |
| Legal services | 0.92 | 0.68 | 0.68 | 0.78 | −1.22 |
| Computer systems design and related services | 7.98 | 0.18 | 4.53 | 2.51 | 0.77 |
| Miscellaneous professional, scientific, and technical services | 3.69 | 0.80 | 1.38 | 1.64 | −0.13 |
| Management of companies and enterprises | 3.06 | 0.29 | 1.57 | 2.27 | −1.07 |
| Administrative and support services | 4.66 | 0.76 | 1.77 | 2.01 | 0.12 |
| Waste management and remediation services | 2.67 | 0.32 | 1.00 | 1.75 | −0.41 |
| Educational services | 2.96 | 0.22 | 1.45 | 1.53 | −0.23 |
| Ambulatory health care services | 3.35 | 0.22 | 1.79 | 1.58 | −0.24 |
| Hospitals and nursing and residential care | 2.77 | 0.26 | 1.15 | 1.86 | −0.51 |
| Social assistance | 3.69 | 0.10 | 2.53 | 1.60 | −0.54 |
| Performing arts, spectator sports, museums, and related activities | 3.73 | 0.08 | 1.19 | 1.86 | 0.61 |
| Amusements, gambling, and recreation industries | 3.68 | 0.68 | 1.03 | 1.79 | 0.18 |
| Accommodation | 2.11 | 0.69 | 0.28 | 0.84 | 0.30 |
| Food services and drinking places | 2.28 | 0.18 | 0.62 | 1.23 | 0.25 |
| Other services, except government | 1.74 | 0.43 | 0.51 | 1.10 | −0.29 |
| Federal | 0.72 | 0.37 | −0.17 | 0.46 | 0.07 |
| State and local | 1.90 | 0.45 | 0.64 | 0.73 | 0.08 |
- MFP
- Multifactor productivity
Notes. Average annual percentange growth. A contribution is a share-weighted growth rate.
Table 2 presents sector contributions to aggregate value-added growth and shows many familiar facets of economic growth over the last thirty years. Between 1987 and 2016, manufacturing contributed 0.34 percentage point to aggregate value-added growth of 2.38 percent per year on average. However, this contribution was skewed heavily towards the first part of the period (0.45 percentage point between 1987–1995 and 0.84 percentage point during the IT-Investment boom of 1995–2000), and has fallen off since. Between 2000 and 2007 manufacturing contributed 0.32 percentage point to aggregate growth and –0.01 between 2007 and 2016. Importantly, the manufacturing sector includes the relatively rapidly growing computer and electronic industry; excluding this industry the contribution of manufacturing to aggregate growth was 0.20 percentage point in 1987–1995 and –0.08 percentage point in 2007–2016. Over the same period, value added generated by services industries increased in importance. In particular, the information industries; finance, insurance, real estate, rental and leasing; and other services accounted for about 46 percent of real economic growth in the 1987–1995 period and 74 percent of real growth in the 2007–2016 period.
The bottom portion of table 2 includes the nominal value-added shares of each of the major sectors and conveys a similar story. The nominal value-added share encompasses payments to labor and capital services and shows how income is distributed throughout the economy. Factors of production in the manufacturing sectors earned 16.7 percent of aggregate income in 1987–1995, but only 11.6 percent of income in 2009–2016, reflecting the overall decline in the share of manufacturing in the economy. Other services produced 20.8 percent of income between 1987 and 1995, but this increased to 24.8 percent over the 2009–2016 period. The value-added share in finance, insurance, real estate, rental and leasing also increased, from 17.5 percent in the early periods to about 19.0 percent in the later period.
| 1987–2016 | 1987–1995 | 1995–2000 | 2000–2007 | 2007–2016 | 2007–2009 | 2009–2016 | |
|---|---|---|---|---|---|---|---|
| Contributions | |||||||
| Value-added | 2.38 | 2.65 | 4.22 | 2.34 | 1.14 | −1.56 | 1.91 |
| Agriculture, forestry, fishing, hunting, and mining | 0.08 | 0.04 | 0.05 | 0.06 | 0.14 | 0.25 | 0.11 |
| Transportation, warehousing, and utilities | 0.07 | 0.16 | 0.10 | 0.02 | 0.02 | −0.17 | 0.08 |
| Construction | 0.00 | 0.03 | 0.13 | −0.04 | −0.06 | −0.48 | 0.06 |
| Manufacturing | 0.34 | 0.45 | 0.84 | 0.32 | −0.01 | −0.64 | 0.18 |
| Computer and electronic products | 0.24 | 0.25 | 0.62 | 0.17 | 0.07 | 0.09 | 0.06 |
| Trade | 0.41 | 0.54 | 0.90 | 0.33 | 0.09 | −0.61 | 0.29 |
| Information | 0.20 | 0.17 | 0.20 | 0.30 | 0.14 | 0.03 | 0.17 |
| Finance, insurance, real estate, and rental and leasing | 0.50 | 0.46 | 0.89 | 0.57 | 0.27 | 0.02 | 0.34 |
| Other services | 0.57 | 0.60 | 0.89 | 0.49 | 0.44 | −0.12 | 0.60 |
| Government | 0.19 | 0.20 | 0.21 | 0.28 | 0.11 | 0.17 | 0.09 |
| Shares | |||||||
| Shares in nominal value-added | 100.0 | 100.0 | 100.0 | 100.0 | 100.0 | 100.0 | 100.0 |
| Agriculture, forestry, fishing, hunting, and mining | 2.7 | 2.6 | 2.1 | 2.4 | 3.3 | 3.2 | 3.3 |
| Transportation, warehousing, and utilities | 4.7 | 5.3 | 4.8 | 4.3 | 4.3 | 4.3 | 4.4 |
| Construction | 4.0 | 3.9 | 4.1 | 4.6 | 3.7 | 4.0 | 3.6 |
| Manufacturing | 13.9 | 16.7 | 15.4 | 12.7 | 11.6 | 11.6 | 11.6 |
| Computer and electronic products | 1.7 | 1.9 | 2.1 | 1.5 | 1.5 | 1.5 | 1.5 |
| Trade | 11.9 | 12.5 | 12.7 | 11.8 | 11.2 | 11.1 | 11.2 |
| Information | 4.6 | 4.5 | 4.7 | 4.7 | 4.5 | 4.7 | 4.5 |
| Finance, insurance, real estate, and rental and leasing | 18.6 | 17.5 | 18.5 | 19.3 | 19.0 | 18.6 | 19.1 |
| Other services | 23.0 | 20.8 | 22.5 | 23.4 | 24.8 | 24.6 | 24.8 |
| Government | 16.7 | 16.2 | 15.3 | 16.9 | 17.6 | 17.8 | 17.5 |
Notes. Average annual percentages. Aggregate value-added growth is the aggregate of share weighed industry value-added growth. Sector aggregates are the sum of contributions over the underlying industries. Shares are average nominal shares over the period.
Table 3 shows the sector-level sources of growth. Over the entire period, growth in capital input was the predominant source of economic growth, followed by growth of labor input and then growth in MFP. Growth in capital input in the finance and trade industries accounted for about half of the total contribution of capital input. However, breaking down the shares of capital growth across the different time periods reveals the effect of the 2007 housing crisis. In the more recent 2007–2016 period, the finance, insurance, real estate and rental and leasing sector’s contribution to capital was cut in half with the financial crisis from 39 percent in the earlier period to 19 percent in the 2007–2016 period. More than half of the contribution of labor input was accounted for by growth in labor input in the other services industries. Growth in MFP was dominated by MFP growth in manufacturing (mostly computers and electronic products) and the trade sectors.
| 1987–2016 | 1987–1995 | 1995–2000 | 2000–2007 | 2007–2016 | 2007–2009 | 2009–2016 | |
|---|---|---|---|---|---|---|---|
| Capital input | |||||||
| Aggregate | 1.19 | 1.25 | 1.91 | 1.35 | 0.62 | 0.64 | 0.61 |
| Agriculture, forestry, fishing, hunting, and mining | 0.01 | 0.00 | 0.00 | 0.00 | 0.03 | 0.01 | 0.04 |
| Transportation, warehousing, and utilities | 0.04 | 0.04 | 0.05 | 0.03 | 0.04 | 0.03 | 0.04 |
| Construction | 0.02 | 0.01 | 0.05 | 0.05 | −0.01 | −0.02 | −0.01 |
| Manufacturing | 0.14 | 0.17 | 0.26 | 0.07 | 0.11 | 0.13 | 0.10 |
| Trade | 0.17 | 0.17 | 0.31 | 0.22 | 0.08 | −0.02 | 0.10 |
| Information | 0.14 | 0.13 | 0.22 | 0.13 | 0.09 | 0.10 | 0.09 |
| Finance, insurance, real esate, and rental and leasing | 0.42 | 0.49 | 0.70 | 0.52 | 0.11 | 0.12 | 0.11 |
| Other services | 0.16 | 0.16 | 0.24 | 0.20 | 0.09 | 0.15 | 0.07 |
| Government | 0.10 | 0.09 | 0.08 | 0.13 | 0.09 | 0.15 | 0.07 |
| Labor input | |||||||
| Aggregate | 0.76 | 1.09 | 1.33 | 0.43 | 0.40 | −1.30 | 0.88 |
| Agriculture, forestry, fishing, hunting, and mining | 0.00 | −0.01 | −0.01 | 0.02 | 0.01 | −0.03 | 0.02 |
| Transportation, warehousing, and utilities | 0.03 | 0.07 | 0.04 | 0.00 | 0.03 | −0.07 | 0.06 |
| Construction | 0.04 | 0.04 | 0.16 | 0.07 | −0.04 | −0.40 | 0.06 |
| Manufacturing | −0.04 | 0.07 | 0.03 | −0.21 | −0.04 | −0.41 | 0.06 |
| Trade | 0.07 | 0.13 | 0.12 | 0.04 | 0.02 | −0.20 | 0.08 |
| Information | 0.01 | 0.04 | 0.11 | −0.05 | −0.01 | −0.08 | 0.01 |
| Finance, insurance, real esate, and rental and leasing | 0.07 | 0.07 | 0.16 | 0.08 | 0.02 | −0.15 | 0.07 |
| Other services | 0.48 | 0.60 | 0.61 | 0.39 | 0.39 | −0.06 | 0.52 |
| Government | 0.08 | 0.09 | 0.11 | 0.10 | 0.03 | 0.11 | 0.01 |
| MFP | |||||||
| Aggregate | 0.43 | 0.31 | 0.98 | 0.55 | 0.13 | −0.90 | 0.42 |
| Agriculture, forestry, fishing, hunting, and mining | 0.07 | 0.06 | 0.07 | 0.04 | 0.10 | 0.27 | 0.05 |
| Transportation, warehousing, and utilities | 0.00 | 0.05 | 0.01 | 0.00 | −0.04 | −0.13 | −0.02 |
| Construction | −0.06 | −0.02 | −0.09 | −0.15 | −0.01 | −0.06 | 0.01 |
| Manufacturing | 0.24 | 0.21 | 0.55 | 0.46 | −0.07 | −0.36 | 0.01 |
| Trade | 0.17 | 0.24 | 0.47 | 0.08 | 0.00 | −0.39 | 0.11 |
| Information | 0.05 | 0.00 | −0.13 | 0.22 | 0.06 | 0.02 | 0.08 |
| Finance, insurance, real esate, and rental and leasing | 0.01 | −0.10 | 0.03 | −0.03 | 0.14 | 0.05 | 0.16 |
| Other services | −0.07 | −0.16 | 0.04 | −0.10 | −0.04 | −0.21 | 0.01 |
| Government | 0.02 | 0.02 | 0.02 | 0.04 | −0.01 | −0.10 | 0.01 |
| Aggregate value-added growth | 2.38 | 2.65 | 4.22 | 2.33 | 1.15 | −1.56 | 1.91 |
- MFP
- Multifactor productivity
Notes. Average annual percentages. Aggregate value-added growth is the aggregate of share weighed industry value-added growth. Sector aggregates are the sum of contributions over the underlying industries.
It is worth summarizing a few of the main trends that the 1987–2016 KLEMS data reveal. Over this period, output growth shifted from manufacturing to services, and income shares shifted as well. Economic growth during the period of the ongoing recovery from 2009–2016 was significantly slower than the 1987–1995 period before the IT boom; this was driven mostly by slower capital and labor input growth. MFP growth was actually faster in the 2009–2016 period in comparison with the 1987–1995 period. The growth in other services was driven mostly by labor input growth and a recovery of MFP from negative early in the period to slightly positive towards the end of the period.
The next part of this section focuses on one particular component of structural change over the last 30 years: the industry sources of the change in the distribution of income. It is relatively well known that the share of value added accruing to labor has been in decline. In this part, new information is presented on the industry sources of this decline.
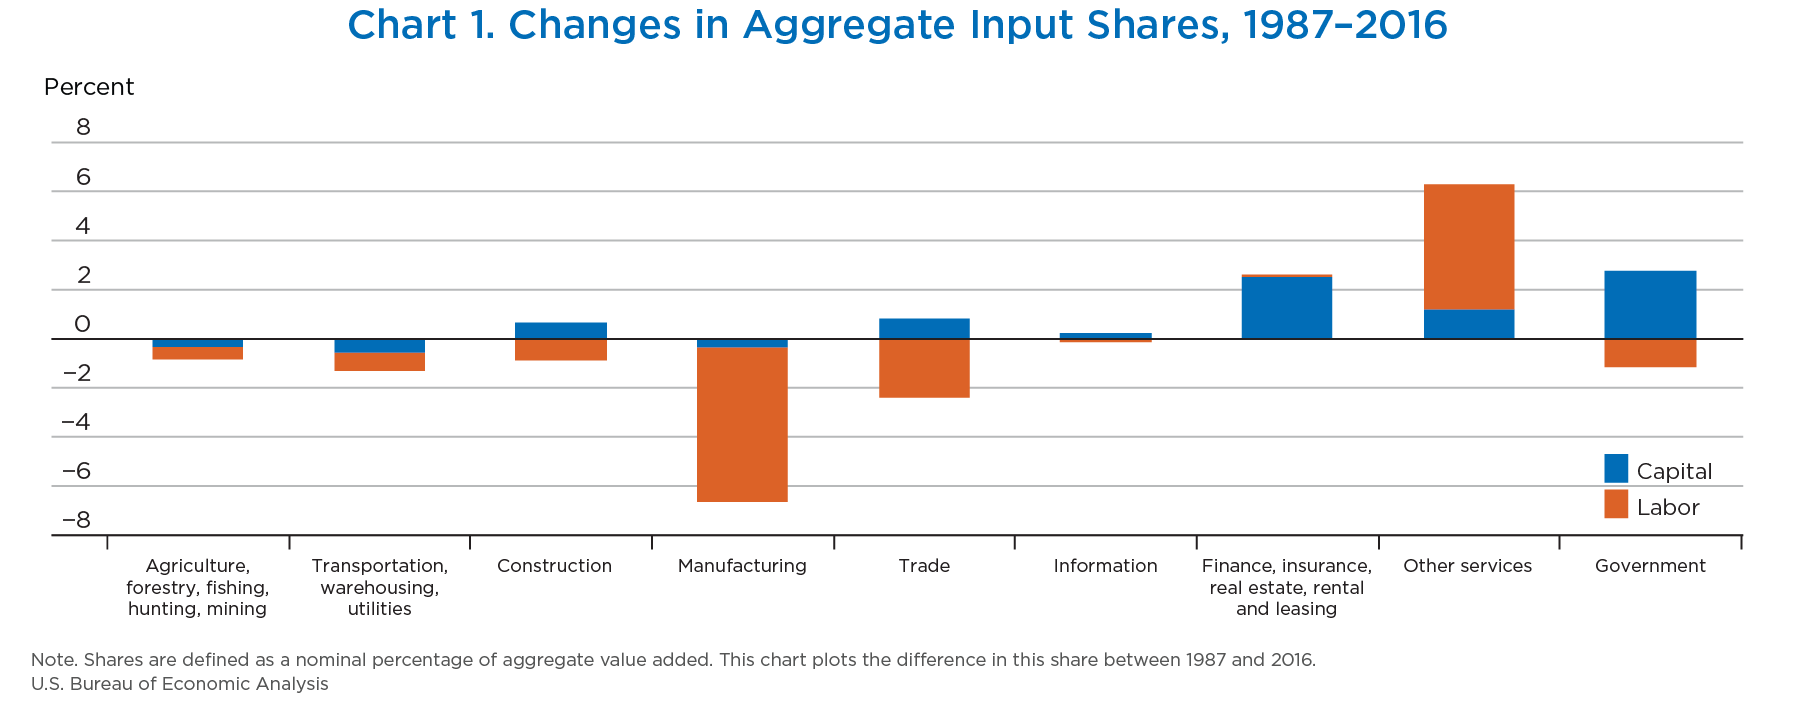
Chart 1 shows the change in the share of aggregate value added of capital and labor by sector. Over this period, the capital share increased from 38.6 percent of income in 1987 to 45.5 percent of income in 2016. Chart 1 indicates that this shift was not proportionate across sectors. For example, while the income share paid to labor generated in the manufacturing sector fell by a significant margin, it increased by almost as much in the other services sector. Thus, the shift in output from manufacturing to other services actually counterbalanced the trend of a falling labor share. In the trade sector, the share of income accruing to capital increased while that accruing to labor actually fell, providing evidence that an industry’s expansion does not necessarily produce proportional gains for labor and the owners of capital.
[Click Chart to Expand]
Charts 2 and 3 provide more information on the changes in the aggregate labor share by industry. Chart 2 shows that even though the aggregate labor share fell over the period, the share of income accruing to college-educated labor (those with a Bachelor of Arts degree and above) increased significantly over the period, so that the decline in the aggregate labor share was entirely due to a decline in the share of income paid to workers without a college degree. Chart 3 presents the decomposition by gender. Over the period, the share of income accruing to men fell from 44.2 percent to 36.6 percent between 1987 and 2016. This was driven mainly by large declines (relative to women) in the manufacturing, trade, and government sectors. With the shift towards services, the shares of income paid to both men and women in the services sector increased, and the service sector was the largest driver of increase in the aggregate share of income paid to female workers. This is interesting in light of the findings in Ngai and Petrongolo (2017) that the shift to services has narrowed the gender pay gap.6

[Click Chart to Expand]

[Click Chart to Expand]
The change in the capital share was not proportionate across industries and types of capital. For example, chart 4 shows significant increases to the share of income paid to capital in the finance, insurance, real estate, rental and leasing sector as well as in the other services sector. Within these sectors, a significant portion of the increase was attributed to the share of IT capital. In contrast, in the construction and manufacturing sectors, there was little change in the share of aggregate income paid to IT capital. In the manufacturing sector, the share of capital income attributed to research and development actually increased, thus the decline in the overall capital income share in manufacturing was driven by a decrease in the share of income accruing to other types of capital.

[Click Chart to Expand]
The purpose of this paper was to present an extended time series of integrated KLEMS-based production accounts for the United States. The longer time series yields important data on the evolution of U.S. economic growth over the last three decades. The account shows the shift from manufacturing towards services and the importance of isolating the effects of the computer and electronics product industry when studying the overall manufacturing sector (Houseman 2018). The KLEMS approach shows not only which industries are contributing to growth, but the industry-level sources of growth. The most important source of economic growth over the period was the accumulation of capital input. Of the 1.19 percentage points that capital input contributed to growth over the period, the services industries account for 0.89 percentage point. Aggregate labor input accounted for another 0.76 percentage point of economic growth between 1987 and 2016. Of this, the other services industries sector alone accounted for 0.48 percentage point, demonstrating the relative importance of labor in service producing industries. Finally, MFP growth accounted for 0.43 percentage point of aggregate economic growth. Almost all of this was accounted for by MFP growth in the manufacturing and trade sectors; within manufacturing almost all of the MFP growth was due to growth in MFP of the computer electronic products industry.
The account demonstrates the importance of structural change at the industry level in the evolution of the allocation of income between capital and labor. The share of income accruing to labor in the manufacturing sector shrank substantially over the period, while the share of income accruing to labor increased substantially in the services industries. In the manufacturing sector, this was mostly due a decline in the share of income paid to workers without a college degree, while workers with a college degree accounted for the large majority of the increase in the income paid to labor in the service sectors.
The new estimates presented in this paper are an important milestone because extending the account to cover 1987–1997 involved overcoming significant obstacles including the change in industrial classification between NAICS and SIC and changes in the reporting of educational attainment from years of school to attainment measures. However, this is not the final step in the development of the account. Important next steps could include extending the account even further back in time to span the entire period covered by BEA’s GDP by industry accounts (1947) and resolving existing difference in the measures of labor composition produced by BLS for the official MFP estimates and those produced by BEA for this set of accounts.
Barefoot, Kevin, Teresa L. Gilmore, and Chelsea K. Nelson. 2017. “The 2017 Annual Update of the Industry Economic Accounts, Initial Statistics for the Second Quarter of 2017, Revised Statistics for 2014–2016 and the First Quarter of 2017.” Survey of Current Business 97 (December).
Bayard, Kimberly, and Shawn Klimek. 2004. “Creating a Historical Bridge for Manufacturing Between the Standard Industrial Classification System and the North American Industry Classification System,” 2003 Proceedings of the American Statistical Association, Business and Economic Statistics Section [CD-ROM]: 478–84.
Bureau of Labor Statistics. “Methodology Change for Hours-Worked to Hours-Paid Ratios.” February 2017.
Bureau of Labor Statistics. “News Release: MULTIFACTOR PRODUCTIVITY TRENDS—2016.” March 2017.
Bureau of Labor Statistics. “News Release: MULTIFACTOR PRODUCTIVITY TRENDS—2017.” March 2018.
Fleck, Susan, Steven Rosenthal, Matthew Russell, Erich H. Strassner, and Lisa Usher. 2012. “A Prototype BEA/BLS Industry-Level Production Account for the United States,” in Measuring Economic Sustainability and Progress, edited by Dale W. Jorgenson, J. Steven Landefeld, and Paul Schreyer. Chicago: University of Chicago Press, for the National Bureau of Economic Research (2014).
Hood, Kyle K. 2013. “Measuring the Services of Commercial Banks in the National Income and Products Accounts.” Survey of Current Business 93 (February).
Houseman, Susan N. 2018. “Understanding the Decline of U.S. Manufacturing Employment.” Upjohn Institute Working Paper, 18–287 (January 2018).
Jaeger, David A. 1997. “Reconciling the Old and New Census Bureau Education Questions: Recommendations for Researchers.” Journal of Business and Economic Statistics 15, no. 3 (July).
Jorgenson, Dale, and Schreyer, P. 2013. “Industry-level Productivity Measurement and the 2008 System of National Accounts.” Review of Income and Wealth 59, no. 2.
Kim, Donald, Erich H. Strassner, and David B. Wasshausen. 2014. “Industry Economic Accounts, Results of the Comprehensive Revision, Revised Statistics for 1997–2012.” Survey of Current Business 94 (February).
Lyndaker, Amanda S., Thomas F. Howells III, Erich H. Strassner, and David B. Wasshausen. 2016. “BEA Briefing, Integrated Historical Input-Output and GDP by Industry Accounts, 1947–1996,” Survey of Current Business 96 (February).
Moyer, Brian C., Mark A. Planting, Mahnaz Fahim-Nader, and Sherlene K. S. Lum. 2004. “Integrating the Annual Input-Output Accounts and Gross-Domestic-Product-by-Industry Accounts,” Survey of Current Business 84 (March).
Ngai, L. R., and Petrongolo, B. 2017. “Gender Gaps and the Rise of the Service Economy.” American Economic Journal: Macroeconomics 9, no. 4.
Petty, Wade, and Patrick Hu. 2014. “CES–National Benchmark Article, BLS Establishment Survey National Estimates Revised to Incorporate March 2013 Benchmarks.” (February).
Rosenthal, Steven, Matthew Russell, Jon D. Samuels, Erich H. Strassner and Lisa Usher. 2014. “Integrated Industry-Level Production Account for the United States: Intellectual Property Product ” and the 2007 NAICS paper presented at the Third WORLD KLEMS conference, Tokyo, Japan. (May 19–20).
Strassner, Erich H., and David B. Wasshausen. 2013. “Preview of the 2013 Comprehensive Revision of the Industry Economic Accounts,” Survey of Current Business 93 (June).
- Garner and Russell are with the Bureau of Labor Statistics Office on Productivity and Technology. Harper, Howells, and Samuels are with the Bureau of Economic Analysis Industry Economic Accounts. We are grateful to Matt Calby, Eugene Njinkeu, Ethan Schein, Randy Kinoshita, and Corey Holman for their work on the estimates and to Kim Bayard for providing the time-varying SIC-NAICS concordance.
- This BEA Briefing summarizes a more detailed paper on the experimental historical statistics that was published to the BEA website along with the new dataset. The more detailed paper is available as a BEA working paper.
- Benchmark tables in this period were prepared for the following years: 1947, 1958, 1963, 1967, 1972, 1977, 1982, 1987, and 1992.
- Labor composition estimates for the published BLS MFP data are constructed using the Basic Monthly CPS data. BLS and BEA are collaborating to reconcile the labor composition measures produced by BLS for the official MFP estimates and those produced by BEA for the account presented in this article.
- This is the same industry classification used by Jorgenson and Schreyer (2013).
- The finding of Ngai and Petrongolo (2017) focuses on wage rates, while the information that presented here is about aggregate income shares. While they are not directly comparable, both suggest that shift to services is an important component in how wages and income have evolved.