
U.S. Net International Investment Position
First Quarter 2018, Year 2017, and Annual Update
This article presents the U.S. international investment position (IIP) statistics for the first quarter of 2018 and the annual update of the IIP accounts, which introduces new annual statistical detail for 2017, including changes in position resulting from financial transactions and other changes in position such as price changes, exchange-rate changes, and changes in volume and valuation not included elsewhere (n.i.e.). This year’s annual update also includes revisions to position statistics for 2010–2017. The revisions reflect newly available and revised source data, including data from the 2014 Benchmark Survey of U.S. Direct Investment Abroad, and an improved method for estimating exports of military goods, which caused revisions to U.S. liabilities in trade credit and advances.
The U.S. international investment position is a statistical balance sheet that presents the dollar value of U.S. external financial assets and liabilities at a specific point in time. The U.S. net international investment position is defined as the value of U.S. assets less the value of U.S. liabilities. The negative net investment position represents a U.S. net liability to the rest of the world.
Highlights
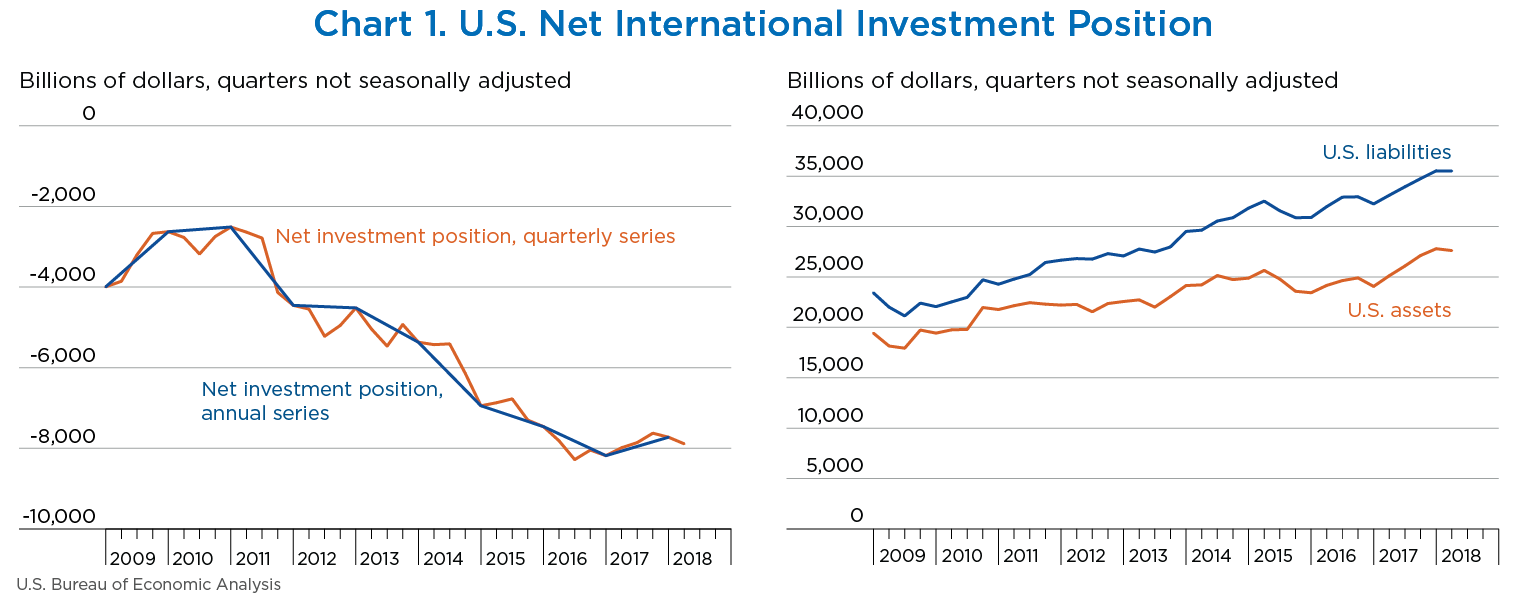
- The U.S. net international investment position decreased to −$7,888.1 billion (preliminary) at the end of the first quarter of 2018 from −$7,725.0 billion (revised) at the end of the fourth quarter of 2017 (chart 1). The $163.1 billion decrease reflected a $182.8 billion decrease in U.S. assets and a $19.7 billion decrease in U.S. liabilities (table A).
- The U.S. net international investment position increased to −$7,725.0 billion (revised) at the end of 2017 from −$8,181.6 billion (revised) at the end of 2016. The $456.6 billion increase reflected a $3,738.5 billion increase in U.S. assets and a $3,281.9 billion increase in U.S. liabilities (table C).
[Click Chart to Expand]
The U.S. net international investment position decreased to −$7,888.1 billion (preliminary) at the end of the first quarter of 2018 from −$7,725.0 billion (revised) at the end of the fourth quarter of 2017 (chart 1). The $163.1 billion decrease reflected a $182.8 billion decrease in U.S. assets and a $19.7 billion decrease in U.S. liabilities (table A).
- The $163.1 billion decrease in the net investment position reflected net financial transactions of −$164.8 billion and net other changes in position, such as price and exchange-rate changes, of $1.7 billion.
- The net investment position decreased 2.1 percent in the first quarter, compared with a decrease of 1.3 percent in the fourth quarter. The net investment position decreased an average of 4.7 percent from the first quarter of 2011 through the third quarter of 2017.
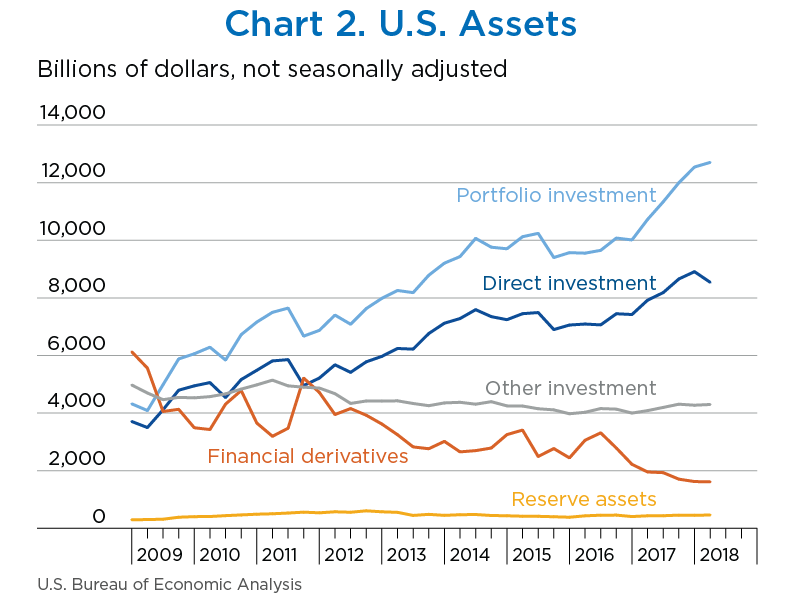
U.S. assets decreased $182.8 billion to $27,616.3 billion at the end of the first quarter, mostly reflecting a decrease in direct investment assets that was partly offset by an increase in portfolio investment assets (table A, chart 2).
- Assets excluding financial derivatives decreased $171.9 billion to $26,004.7 billion. The decrease resulted from other changes in position of −$440.8 billion and financial transactions of $268.9 billion.
- Other changes in position were driven by foreign equity price decreases that lowered the value of portfolio investment and direct investment equity assets. These price decreases were partly offset by increases from exchange-rate changes, as major foreign currencies appreciated against the U.S. dollar, raising the value of foreign-currency-denominated assets in dollar terms.
- Financial transactions mostly reflected net acquisition of portfolio investment assets that was partly offset by net withdrawal of direct investment assets. The net withdrawal of direct investment assets resulted from U.S. parent repatriation of previously reinvested earnings. For more information on the repatriation, see the box ”Effects of the 2017 Tax Cuts and Jobs Act on Components of Direct Investment.“
- Financial derivatives decreased $10.9 billion to $1,611.6 billion, reflecting decreases in single-currency interest rate contracts and foreign exchange contracts.
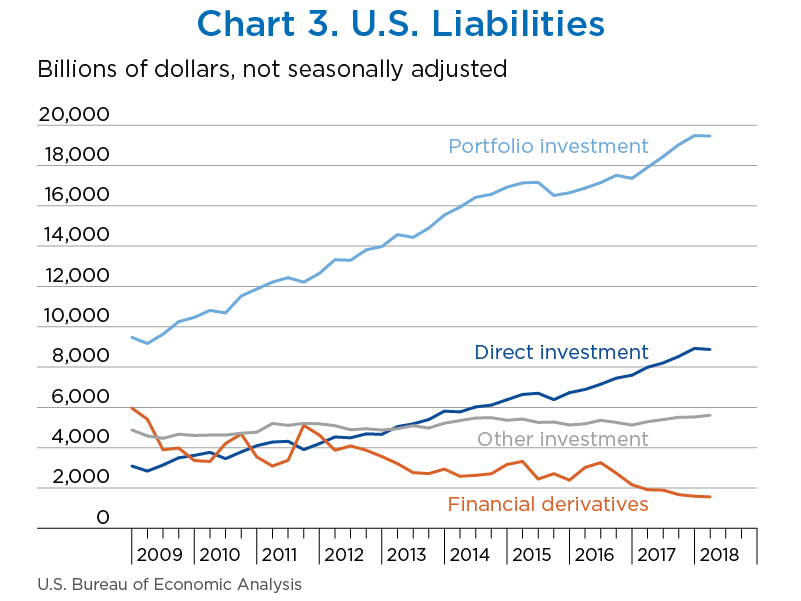
U.S. liabilities decreased $19.7 billion to $35,504.4 billion at the end of the first quarter, reflecting decreases in direct investment, financial derivatives, and portfolio investment liabilities (table A, chart 3).
- Financial derivatives decreased $33.2 billion to $1,561.0 billion, reflecting decreases in single-currency interest rate contracts and foreign exchange contracts.
- Liabilities excluding financial derivatives increased $13.5 billion to $33,943.3 billion. The increase resulted from financial transactions of $462.4 billion and other changes in position of −$448.9 billion.
- Financial transactions reflected net incurrence of liabilities in all major investment categories, especially in portfolio investment.
- Other changes in position were driven by U.S. equity and bond price decreases, which lowered the value of portfolio investment liabilities. Equity price decreases also lowered the value of direct investment equity liabilities.
| Type of investment | Position, 2017:IV | Change in position in 2018:I | Position, 2018:I | ||
|---|---|---|---|---|---|
| Total | Attributable to: | ||||
| Financial transactions | Other changes in position 1 | ||||
| U.S. net international investment position | −7,725.0 | −163.1 | −164.8 | 1.7 | −7,888.1 |
| Net position excluding financial derivatives | −7,753.3 | −185.3 | −193.5 | 8.1 | −7,938.6 |
| Financial derivatives other than reserves, net 2 | 28.3 | 22.3 | 28.7 | −6.4 | 50.5 |
| U.S. assets | 27,799.1 | −182.8 | (2) | (2) | 27,616.3 |
| Assets excluding financial derivatives | 26,176.6 | −171.9 | 268.9 | −440.8 | 26,004.7 |
| Financial derivatives other than reserves | 1,622.5 | −10.9 | (2) | (2) | 1,611.6 |
| By functional category: | |||||
| Direct investment at market value | 8,910.0 | −368.3 | −105.5 | −262.8 | 8,541.7 |
| Equity | 7,645.9 | −414.1 | −156.0 | −258.1 | 7,231.7 |
| Debt instruments | 1,264.1 | 45.9 | 50.5 | −4.6 | 1,310.0 |
| Portfolio investment | 12,543.8 | 159.6 | 365.5 | −205.9 | 12,703.4 |
| Equity and investment fund shares | 9,129.5 | 61.2 | 242.5 | −181.3 | 9,190.7 |
| Debt securities | 3,414.4 | 98.4 | 122.9 | −24.5 | 3,512.8 |
| Short term | 649.8 | 26.8 | 21.9 | 4.9 | 676.6 |
| Long term | 2,764.6 | 71.6 | 101.0 | −29.4 | 2,836.1 |
| Financial derivatives other than reserves | 1,622.5 | −10.9 | (2) | (2) | 1,611.6 |
| Over-the-counter contracts | 1,582.0 | −8.8 | (2) | (2) | 1,573.2 |
| Single-currency interest rate contracts | 1,150.5 | −14.6 | (2) | (2) | 1,135.9 |
| Foreign exchange contracts | 261.3 | −6.8 | (2) | (2) | 254.6 |
| Other contracts | 170.1 | 12.6 | (2) | (2) | 182.7 |
| Exchange-traded contracts | 40.5 | −2.2 | (2) | (2) | 38.4 |
| Other investment | 4,273.0 | 25.2 | 8.9 | 16.2 | 4,298.2 |
| Currency and deposits | 1,774.9 | −13.0 | −22.6 | 9.6 | 1,761.9 |
| Loans | 2,446.4 | 39.7 | 33.2 | 6.5 | 2,486.0 |
| Insurance technical reserves | n.a. | n.a. | n.a. | n.a. | n.a. |
| Trade credit and advances | 51.8 | −1.5 | −1.7 | 0.2 | 50.3 |
| Reserve assets | 449.7 | 11.6 | (*) | 11.7 | 461.3 |
| Monetary gold | 337.6 | 8.6 | 0.0 | 8.6 | 346.2 |
| Special drawing rights | 51.9 | 1.1 | (*) | 1.1 | 53.0 |
| Reserve position in the International Monetary Fund | 17.6 | 0.3 | −0.1 | 0.4 | 17.9 |
| Other reserve assets | 42.6 | 1.6 | (*) | 1.6 | 44.3 |
| U.S. liabilities | 35,524.1 | −19.7 | (2) | (2) | 35,504.4 |
| Liabilities excluding financial derivatives | 33,929.8 | 13.5 | 462.4 | −448.9 | 33,943.3 |
| Financial derivatives other than reserves | 1,594.2 | −33.2 | (2) | (2) | 1,561.0 |
| By functional category: | |||||
| Direct investment at market value | 8,925.5 | −53.7 | 95.6 | −149.3 | 8,871.8 |
| Equity | 7,132.8 | −73.5 | 60.7 | −134.2 | 7,059.3 |
| Debt instruments | 1,792.6 | 19.9 | 34.9 | −15.1 | 1,812.5 |
| Portfolio investment | 19,482.2 | −22.5 | 292.1 | −314.6 | 19,459.7 |
| Equity and investment fund shares | 7,951.9 | 31.0 | 150.3 | −119.4 | 7,982.9 |
| Debt securities | 11,530.3 | −53.5 | 141.7 | −195.3 | 11,476.8 |
| Short term | 959.2 | 32.0 | 31.4 | 0.7 | 991.2 |
| Long term | 10,571.1 | −85.5 | 110.4 | −195.9 | 10,485.6 |
| Financial derivatives other than reserves | 1,594.2 | −33.2 | (2) | (2) | 1,561.0 |
| Over-the-counter contracts | 1,554.4 | −28.0 | (2) | (2) | 1,526.4 |
| Single-currency interest rate contracts | 1,112.6 | −18.2 | (2) | (2) | 1,094.4 |
| Foreign exchange contracts | 266.8 | −13.2 | (2) | (2) | 253.6 |
| Other contracts | 175.1 | 3.4 | (2) | (2) | 178.4 |
| Exchange-traded contracts | 39.9 | −5.2 | (2) | (2) | 34.6 |
| Other investment | 5,522.2 | 89.7 | 74.6 | 15.0 | 5,611.9 |
| Currency and deposits | 3,196.6 | 1.1 | −1.7 | 2.9 | 3,197.8 |
| Loans | 2,091.1 | 78.3 | 67.3 | 11.0 | 2,169.4 |
| Insurance technical reserves | n.a. | n.a. | n.a. | n.a. | n.a. |
| Trade credit and advances | 184.2 | 9.2 | 9.1 | 0.1 | 193.4 |
| Special drawing rights allocations | 50.3 | 1.1 | 0.0 | 1.1 | 51.3 |
- n.a.
- Not available
- (*)
- Value between zero and +/− $50 million.
- Disaggregation of other changes in position into price changes, exchange-rate changes, and other changes in volume and valuation is only presented for annual statistics (table C).
- Financial transactions and other changes in financial derivatives positions are available only on a net basis; they are not separately available for U.S. assets and U.S. liabilities.
Note. The statistics on positions are presented in table 1.2 of the international investment position (IIP) accounts on BEA’s website. The statistics on financial transactions are not seasonally adjusted and are presented in table 1.2 of the international transactions accounts (ITA) on BEA’s website.
The U.S. net international investment position statistics for 2010–2017 have been updated to incorporate newly available and revised source data and improved estimation methodologies (table B). Key changes to the statistics and the results of the annual update for 2017 are highlighted below.
- The revised statistics for the net international investment position incorporate newly available and revised source data.
- Revised statistics on direct investment positions and transactions in financial assets and liabilities for 2014–2017 incorporate the results of BEA’s 2014 Benchmark Survey of U.S. Direct Investment Abroad. This survey collects data on the U.S. and foreign operations of all U.S. investors that own 10 percent or more of a foreign business enterprise. For more information, see “Activities of U.S. Multinational Enterprises in the United States and Abroad: Preliminary Results From the 2014 Benchmark Survey” in the December 2016 issue of the Survey of Current Business.
- Revised statistics on portfolio investment positions for 2016–2017 incorporate the results of the U.S. Department of Treasury’s 2016 Benchmark Survey of U.S. Ownership of Foreign Securities and 2017 Annual Survey of Foreign-Residents’ Holdings of U.S. Securities.
- The revised statistics for the net international investment position also incorporate revisions to trade credit and advances, a component of other investment liabilities, beginning with statistics for 2010. The revisions result from an improved method for estimating exports under the U.S. Foreign Military Sales (FMS) program in the U.S. international transactions accounts (ITAs). This change in methodology also affects U.S. liabilities in the ITAs and in the U.S. international investment position (IIP) accounts because the value of exports of FMS goods is recorded under general government trade credit and advances as a reduction in the liabilities of the U.S. government. U.S. government liabilities, which reflect pre-payments made by foreign purchasers, are reduced when the foreign purchaser takes ownership of the goods. For more information, see “Annual Update of the U.S. International Transactions Accounts” in this issue of the Survey of Current Business.
Table B. Updates to the U.S. Net International Investment Position at Yearend, 2010–2017
[Billions of dollars]
| Type of investment | 2010 | 2011 | 2012 | 2013 | ||||||||
|---|---|---|---|---|---|---|---|---|---|---|---|---|
| Previously published | Revised | Amount of revision | Previously published | Revised | Amount of revision | Previously published | Revised | Amount of revision | Previously published | Revised | Amount of revision | |
| U.S. net international investment position | −2,511.8 | −2,511.8 | (*) | −4,455.0 | −4,455.4 | −0.4 | −4,518.3 | −4,518.0 | 0.3 | −5,372.7 | −5,368.6 | 4.0 |
| Net position excluding financial derivatives | −2,622.2 | −2,622.2 | (*) | −4,541.0 | −4,541.4 | −0.4 | −4,576.1 | −4,575.8 | 0.3 | −5,450.2 | −5,446.2 | 4.0 |
| Financial derivatives other than reserves, net | 110.4 | 110.4 | 0.0 | 86.0 | 86.0 | 0.0 | 57.8 | 57.8 | 0.0 | 77.6 | 77.6 | 0.0 |
| U.S. assets | 21,767.8 | 21,767.8 | 0.0 | 22,208.9 | 22,208.9 | 0.0 | 22,562.2 | 22,562.2 | 0.0 | 24,144.8 | 24,144.8 | 0.0 |
| Direct investment at market value | 5,486.4 | 5,486.4 | 0.0 | 5,214.8 | 5,214.8 | 0.0 | 5,969.5 | 5,969.5 | 0.0 | 7,120.7 | 7,120.7 | 0.0 |
| Portfolio investment | 7,160.4 | 7,160.4 | 0.0 | 6,871.7 | 6,871.7 | 0.0 | 7,984.0 | 7,984.0 | 0.0 | 9,206.1 | 9,206.1 | 0.0 |
| Financial derivatives other than reserves | 3,652.3 | 3,652.3 | 0.0 | 4,716.6 | 4,716.6 | 0.0 | 3,619.8 | 3,619.8 | 0.0 | 3,017.1 | 3,017.1 | 0.0 |
| Other investment | 4,980.1 | 4,980.1 | 0.0 | 4,868.7 | 4,868.7 | 0.0 | 4,416.6 | 4,416.6 | 0.0 | 4,352.5 | 4,352.5 | 0.0 |
| Reserve assets | 488.7 | 488.7 | 0.0 | 537.0 | 537.0 | 0.0 | 572.4 | 572.4 | 0.0 | 448.3 | 448.3 | 0.0 |
| U.S. liabilities | 24,279.6 | 24,279.6 | (*) | 26,663.9 | 26,664.3 | 0.4 | 27,080.5 | 27,080.2 | −0.3 | 29,517.4 | 29,513.4 | −4.0 |
| Direct investment at market value | 4,099.1 | 4,099.1 | 0.0 | 4,199.2 | 4,199.2 | 0.0 | 4,662.4 | 4,662.4 | 0.0 | 5,814.9 | 5,814.9 | 0.0 |
| Portfolio investment | 11,869.3 | 11,869.3 | 0.0 | 12,647.2 | 12,647.2 | 0.0 | 13,978.9 | 13,978.9 | 0.0 | 15,541.3 | 15,541.3 | 0.0 |
| Financial derivatives other than reserves | 3,541.9 | 3,541.9 | 0.0 | 4,630.5 | 4,630.5 | 0.0 | 3,562.0 | 3,562.0 | 0.0 | 2,939.5 | 2,939.5 | 0.0 |
| Other investment | 4,769.3 | 4,769.3 | (*) | 5,186.9 | 5,187.3 | 0.4 | 4,877.2 | 4,876.9 | −0.3 | 5,221.7 | 5,217.7 | −4.0 |
| Type of investment | 2014 | 2015 | 2016 | 2017 | ||||||||
|---|---|---|---|---|---|---|---|---|---|---|---|---|
| Previously published | Revised | Amount of revision | Previously published | Revised | Amount of revision | Previously published | Revised | Amount of revision | Previously published | Revised | Amount of revision | |
| U.S. net international investment position | −6,980.2 | −6,945.4 | 34.8 | −7,493.5 | −7,461.6 | 31.9 | −8,318.4 | −8,181.6 | 136.8 | −7,845.8 | −7,725.0 | 120.8 |
| Net position excluding financial derivatives | −7,065.8 | −7,030.9 | 34.8 | −7,549.8 | −7,516.1 | 33.7 | −8,379.7 | −8,239.8 | 139.9 | −7,874.1 | −7,753.3 | 120.8 |
| Financial derivatives other than reserves, net | 85.5 | 85.5 | 0.0 | 56.3 | 54.5 | −1.8 | 61.3 | 58.2 | −3.1 | 28.3 | 28.3 | 0.0 |
| U.S. assets | 24,832.6 | 24,882.9 | 50.3 | 23,352.4 | 23,430.6 | 78.3 | 23,849.4 | 24,060.6 | 211.1 | 27,632.8 | 27,799.1 | 166.2 |
| Direct investment at market value | 7,189.4 | 7,242.1 | 52.7 | 6,998.9 | 7,057.1 | 58.2 | 7,375.0 | 7,421.9 | 46.8 | 8,863.4 | 8,910.0 | 46.6 |
| Portfolio investment | 9,704.2 | 9,704.2 | 0.0 | 9,570.2 | 9,570.2 | 0.0 | 9,879.2 | 10,011.4 | 132.1 | 12,443.2 | 12,543.8 | 100.7 |
| Financial derivatives other than reserves | 3,252.3 | 3,252.3 | 0.0 | 2,428.2 | 2,443.4 | 15.1 | 2,209.0 | 2,220.5 | 11.5 | 1,622.5 | 1,622.5 | 0.0 |
| Other investment | 4,252.4 | 4,250.0 | −2.4 | 3,971.4 | 3,976.4 | 5.0 | 3,978.9 | 3,999.7 | 20.7 | 4,254.1 | 4,273.0 | 18.9 |
| Reserve assets | 434.3 | 434.3 | 0.0 | 383.6 | 383.6 | 0.0 | 407.2 | 407.2 | 0.0 | 449.7 | 449.7 | 0.0 |
| U.S. liabilities | 31,812.8 | 31,828.3 | 15.5 | 30,845.9 | 30,892.2 | 46.4 | 32,167.8 | 32,242.2 | 74.4 | 35,478.6 | 35,524.1 | 45.4 |
| Direct investment at market value | 6,369.5 | 6,378.9 | 9.4 | 6,700.8 | 6,729.2 | 28.4 | 7,569.3 | 7,596.1 | 26.9 | 8,871.4 | 8,925.5 | 54.1 |
| Portfolio investment | 16,921.4 | 16,921.8 | 0.4 | 16,645.8 | 16,645.8 | 0.0 | 17,352.3 | 17,360.0 | 7.7 | 19,504.2 | 19,482.2 | −22.0 |
| Financial derivatives other than reserves | 3,166.8 | 3,166.8 | 0.0 | 2,371.9 | 2,388.9 | 17.0 | 2,147.7 | 2,162.3 | 14.6 | 1,594.2 | 1,594.2 | 0.0 |
| Other investment | 5,355.1 | 5,360.8 | 5.7 | 5,127.2 | 5,128.3 | 1.0 | 5,098.6 | 5,123.8 | 25.2 | 5,508.9 | 5,522.2 | 13.3 |
- (*)
- Value between zero and +/− $50 million.
The U.S. net international investment position increased to −$7,725.0 billion (revised) at the end of 2017 from −$8,181.6 billion (revised) at the end of 2016. The $456.6 billion increase reflected a $3,738.5 billion increase in U.S. assets and a $3,281.9 billion increase in U.S. liabilities (table C).
- The $456.6 billion increase in the net investment position reflected net financial transactions of −$331.9 billion and net other changes in position, such as price and exchange-rate changes, of $788.4 billion.
- The net investment position increased 5.6 percent in 2017, compared with a decrease of 9.6 percent in 2016.
U.S. assets increased $3,738.5 billion to $27,799.1 billion at the end of 2017, mostly reflecting increases in portfolio investment and direct investment assets that were partly offset by a decrease in financial derivatives (table C).
- Assets excluding financial derivatives increased $4,336.5 billion to $26,176.6 billion. The increase resulted from other changes in position of $3,153.7 billion and financial transactions of $1,182.7 billion.
- Other changes in position mostly reflected (1) foreign equity price increases that raised the value of portfolio investment and direct investment equity assets and (2) the appreciation of major foreign currencies against the U.S. dollar that raised the value of foreign-currency-denominated assets in dollar terms.
- Financial transactions reflected net acquisition of assets in all major investment categories except reserve assets.
- Financial derivatives decreased $598.0 billion to $1,622.5 billion, mostly in single-currency interest rate contracts and foreign exchange contracts.
U.S. liabilities increased $3,281.9 billion to $35,524.1 billion at the end of 2017, mostly reflecting increases in portfolio investment and direct investment liabilities that were partly offset by a decrease in financial derivatives (table C).
- Liabilities excluding financial derivatives increased $3,849.9 billion to $33,929.8 billion. The increase resulted from other changes in position of $2,312.3 billion and financial transactions of $1,537.7 billion.
- Other changes in position mostly reflected U.S. equity price increases that raised the value of portfolio investment and direct investment equity liabilities.
- Financial transactions reflected net incurrence of liabilities in all major investment categories.
- Financial derivatives decreased $568.1 billion to $1,594.2 billion, reflecting decreases in single-currency interest rate contracts and foreign exchange contracts.
| Type of investment | Yearend position, 2016 | Change in position in 2017 | Yearend position, 2017 | |||||
|---|---|---|---|---|---|---|---|---|
| Total | Attributable to: | |||||||
| Financial transactions | Other changes in position | |||||||
| Total | Price changes | Exchange-rate changes 1 | Changes in volume and valuation n.i.e. 2 | |||||
| U.S. net international investment position | −8,181.6 | 456.6 | −331.9 | 788.4 | (4) | (4) | (4) | −7,725.0 |
| Net position excluding financial derivatives | −8,239.8 | 486.5 | −354.9 | 841.4 | −349.6 | 1,176.2 | 14.9 | −7,753.3 |
| Financial derivatives other than reserves, net 3 | 58.2 | −29.9 | 23.1 | −53.0 | (4) | (4) | (4) | 28.3 |
| U.S. assets | 24,060.6 | 3,738.5 | (3) | (3) | (3) | (3) | (3) | 27,799.1 |
| Assets excluding financial derivatives | 21,840.1 | 4,336.5 | 1,182.7 | 3,153.7 | 1,837.9 | 1,280.2 | 35.6 | 26,176.6 |
| Financial derivatives other than reserves | 2,220.5 | −598.0 | (3) | (3) | (3) | (3) | (3) | 1,622.5 |
| By functional category: | ||||||||
| Direct investment at market value | 7,421.9 | 1,488.1 | 379.2 | 1,108.9 | 582.3 | 505.4 | 21.2 | 8,910.0 |
| Equity | 6,200.7 | 1,445.2 | 352.5 | 1,092.7 | 582.3 | 505.4 | 5.0 | 7,645.9 |
| Debt instruments | 1,221.2 | 42.9 | 26.7 | 16.2 | ...... | ...... | 16.2 | 1,264.1 |
| Portfolio investment | 10,011.4 | 2,532.5 | 586.7 | 1,945.8 | 1,219.1 | 706.0 | 20.6 | 12,543.8 |
| Equity and investment fund shares | 7,146.3 | 1,983.2 | 166.8 | 1,816.3 | 1,150.4 | 647.9 | 18.0 | 9,129.5 |
| Debt securities | 2,865.0 | 549.3 | 419.9 | 129.5 | 68.7 | 58.1 | 2.6 | 3,414.4 |
| Short term | 451.1 | 198.7 | 193.9 | 4.9 | ...... | 4.9 | 0.0 | 649.8 |
| Long term | 2,414.0 | 350.6 | 226.0 | 124.6 | 68.7 | 53.2 | 2.6 | 2,764.6 |
| Financial derivatives other than reserves | 2,220.5 | −598.0 | (3) | (3) | (3) | (3) | (3) | 1,622.5 |
| Over-the-counter contracts | 2,183.8 | −601.8 | (3) | (3) | (3) | (3) | (3) | 1,582.0 |
| Single-currency interest rate contracts | 1,635.8 | −485.3 | (3) | (3) | (3) | (3) | (3) | 1,150.5 |
| Foreign exchange contracts | 387.9 | −126.6 | (3) | (3) | (3) | (3) | (3) | 261.3 |
| Other contracts | 160.1 | 10.0 | (3) | (3) | (3) | (3) | (3) | 170.1 |
| Exchange-traded contracts | 36.7 | 3.9 | (3) | (3) | (3) | (3) | (3) | 40.5 |
| Other investment | 3,999.7 | 273.4 | 218.5 | 54.8 | ...... | 61.1 | −6.3 | 4,273.0 |
| Currency and deposits | 1,572.3 | 202.6 | 172.0 | 30.6 | ...... | 40.9 | −10.3 | 1,774.9 |
| Loans | 2,381.9 | 64.4 | 40.9 | 23.6 | ...... | 19.6 | 4.0 | 2,446.4 |
| Insurance technical reserves | n.a. | n.a. | n.a. | n.a. | n.a. | n.a. | n.a. | n.a. |
| Trade credit and advances | 45.4 | 6.4 | 5.7 | 0.7 | ...... | 0.7 | 0.0 | 51.8 |
| Reserve assets | 407.2 | 42.5 | −1.7 | 44.2 | 36.5 | 7.7 | 0.0 | 449.7 |
| Monetary gold | 301.1 | 36.5 | 0.0 | 36.5 | 36.5 | ...... | 0.0 | 337.6 |
| Special drawing rights | 48.9 | 3.0 | 0.1 | 2.9 | ...... | 2.9 | 0.0 | 51.9 |
| Reserve position in the International Monetary Fund | 18.4 | −0.8 | −1.8 | 1.1 | ...... | 1.1 | 0.0 | 17.6 |
| Other reserve assets | 38.9 | 3.7 | (*) | 3.7 | 0 | 3.7 | 0.0 | 42.6 |
| U.S. liabilities | 32,242.2 | 3,281.9 | (3) | (3) | (3) | (3) | (3) | 35,524.1 |
| Liabilities excluding financial derivatives | 30,079.9 | 3,849.9 | 1,537.7 | 2,312.3 | 2,187.6 | 104.0 | 20.7 | 33,929.8 |
| Financial derivatives other than reserves | 2,162.3 | −568.1 | (3) | (3) | (3) | (3) | (3) | 1,594.2 |
| By functional category: | ||||||||
| Direct investment at market value | 7,596.1 | 1,329.3 | 354.8 | 974.5 | 999.7 | ...... | −25.2 | 8,925.5 |
| Equity | 5,851.2 | 1,281.6 | 308.4 | 973.2 | 999.7 | ...... | −26.5 | 7,132.8 |
| Debt instruments | 1,744.9 | 47.7 | 46.4 | 1.3 | ...... | ...... | 1.3 | 1,792.6 |
| Portfolio investment | 17,360.0 | 2,122.2 | 799.2 | 1,323.0 | 1,187.9 | 62.0 | 73.2 | 19,482.2 |
| Equity and investment fund shares | 6,570.2 | 1,381.7 | 155.7 | 1,226.0 | 1,180.5 | ...... | 45.5 | 7,951.9 |
| Debt securities | 10,789.8 | 740.6 | 643.5 | 97.1 | 7.3 | 62.0 | 27.7 | 11,530.3 |
| Short term | 942.0 | 17.2 | 15.9 | 1.4 | ...... | 1.4 | (*) | 959.2 |
| Long term | 9,847.8 | 723.4 | 627.7 | 95.7 | 7.3 | 60.7 | 27.7 | 10,571.1 |
| Financial derivatives other than reserves | 2,162.3 | −568.1 | (3) | (3) | (3) | (3) | (3) | 1,594.2 |
| Over-the-counter contracts | 2,121.8 | −567.5 | (3) | (3) | (3) | (3) | (3) | 1,554.4 |
| Single-currency interest rate contracts | 1,580.5 | −467.9 | (3) | (3) | (3) | (3) | (3) | 1,112.6 |
| Foreign exchange contracts | 368.5 | −101.8 | (3) | (3) | (3) | (3) | (3) | 266.8 |
| Other contracts | 172.8 | 2.3 | (3) | (3) | (3) | (3) | (3) | 175.1 |
| Exchange-traded contracts | 40.5 | −0.6 | (3) | (3) | (3) | (3) | (3) | 39.9 |
| Other investment | 5,123.8 | 398.4 | 383.7 | 14.7 | ...... | 41.9 | −27.2 | 5,522.2 |
| Currency and deposits | 2,965.8 | 230.8 | 217.4 | 13.4 | ...... | 11.1 | 2.3 | 3,196.6 |
| Loans | 1,942.1 | 149.0 | 150.8 | −1.9 | ...... | 27.6 | −29.5 | 2,091.1 |
| Insurance technical reserves | n.a. | n.a. | n.a. | n.a. | n.a. | n.a. | n.a. | n.a. |
| Trade credit and advances | 168.4 | 15.8 | 15.4 | 0.4 | ...... | 0.4 | 0.0 | 184.2 |
| Special drawing rights allocations | 47.5 | 2.8 | 0.0 | 2.8 | ...... | 2.8 | 0.0 | 50.3 |
- n.a.
- Not available
- ......
- Not applicable
- (*)
- Value between zero and +/− $50 million
- Represents gains or losses on foreign-currency-denominated assets and liabilities due to their revaluation at current exchange rates.
- Includes changes due to year-to-year shifts in the composition of reporting panels and to the incorporation of more comprehensive survey results. Also includes capital gains and losses of direct investment affiliates and changes in positions that cannot be allocated to financial transactions, price changes, or exchange-rate changes.
- Financial transactions and other changes in financial derivatives positions are available only on a net basis; they are not separately available for U.S. assets and U.S. liabilities.
- Data are not separately available for price changes, exchange-rate changes, and changes in volume and valuation not included elsewhere.
Note. The statistics are presented in IIP table 1.3 on BEA’s website.