
U.S. International Transactions
First Quarter 2018
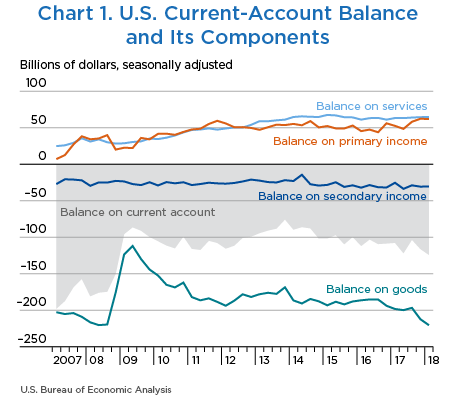
The U.S. current-account deficit—a net measure of transactions between the United States and the rest of the world in goods, services, primary income, and secondary income—increased to $124.1 billion (preliminary) in the first quarter of 2018 from $116.1 billion (revised) in the fourth quarter of 2017 (chart 1 and table A). The deficit was 2.5 percent of current-dollar gross domestic product (GDP) in the first quarter, up from 2.4 percent in the fourth quarter.
The $8.0 billion increase in the current-account deficit reflected an $8.1 billion increase in the deficit on goods and relatively small, nearly offsetting changes in the balances on services, primary income, and secondary income.
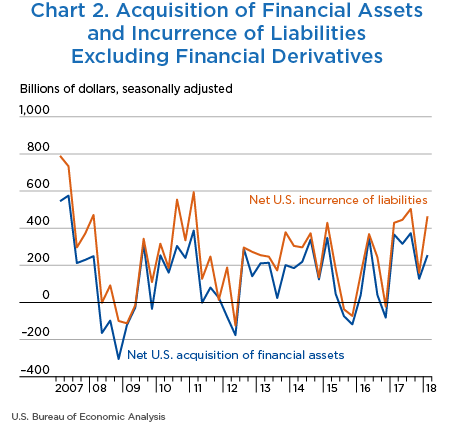
Net U.S. borrowing measured by financial-account transactions was $180.6 billion in the first quarter, an increase from net borrowing of $31.3 billion in the fourth quarter.
| 2017 | 2018 | Change 2017:IV to 2018:I |
|||
|---|---|---|---|---|---|
| II r | III r | IV r | I p | ||
| Current account | |||||
| Exports of goods and services and income receipts (credits) | 839,280 | 868,997 | 890,393 | 913,358 | 22,965 |
| Exports of goods and services | 579,743 | 589,107 | 605,916 | 619,243 | 13,327 |
| Goods | 382,492 | 387,814 | 401,939 | 411,416 | 9,477 |
| Services | 197,252 | 201,293 | 203,977 | 207,828 | 3,851 |
| Primary income receipts | 223,979 | 237,632 | 248,940 | 258,786 | 9,846 |
| Secondary income (current transfer) receipts | 35,557 | 42,258 | 35,537 | 35,329 | −208 |
| Imports of goods and services and income payments (debits) | 961,117 | 972,445 | 1,006,541 | 1,037,464 | 30,923 |
| Imports of goods and services | 716,443 | 721,899 | 753,742 | 774,870 | 21,128 |
| Goods | 582,440 | 584,637 | 614,317 | 631,934 | 17,617 |
| Services | 134,004 | 137,261 | 139,426 | 142,936 | 3,510 |
| Primary income payments | 175,444 | 179,410 | 186,569 | 196,775 | 10,206 |
| Secondary income (current transfer) payments | 69,229 | 71,136 | 66,229 | 65,819 | −410 |
| Capital account | |||||
| Capital transfer receipts and other credits | 0 | 24,788 | 0 | 0 | 0 |
| Capital transfer payments and other debits | 0 | 1 | 40 | n.a. | n.a. |
| Financial account | |||||
| Net U.S. acquisition of financial assets excluding financial derivatives (net increase in assets / financial outflow (+)) | 315,922 | 373,591 | 127,135 | 254,728 | 127,593 |
| Direct investment assets | 49,976 | 102,936 | 91,256 | −119,662 | −210,918 |
| Portfolio investment assets | 180,700 | 175,910 | 88,301 | 365,467 | 277,166 |
| Other investment assets | 85,095 | 94,804 | −50,883 | 8,930 | 59,813 |
| Reserve assets | 150 | −61 | −1,539 | −7 | 1,532 |
| Net U.S. incurrence of liabilities excluding financial derivatives (net increase in liabilities / financial inflow (+)) | 445,338 | 504,082 | 159,164 | 464,054 | 304,890 |
| Direct investment liabilities | 97,118 | 107,107 | 38,250 | 97,344 | 59,094 |
| Portfolio investment liabilities | 263,170 | 294,275 | 81,626 | 292,084 | 210,458 |
| Other investment liabilities | 85,050 | 102,701 | 39,288 | 74,626 | 35,338 |
| Financial derivatives other than reserves, net transactions | 9,306 | 18,600 | 777 | 28,678 | 27,901 |
| Statistical discrepancy | |||||
| Statistical discrepancy1 | 1,727 | −33,231 | 84,936 | −56,544 | −141,480 |
| Balances | |||||
| Balance on current account | −121,837 | −103,447 | −116,148 | −124,105 | −7,957 |
| Balance on goods and services | −136,700 | −132,791 | −147,826 | −155,626 | −7,800 |
| Balance on goods | −199,948 | −196,823 | −212,378 | −220,518 | −8,140 |
| Balance on services | 63,248 | 64,032 | 64,551 | 64,892 | 341 |
| Balance on primary income | 48,535 | 58,222 | 62,371 | 62,012 | −359 |
| Balance on secondary income | −33,672 | −28,878 | −30,692 | −30,491 | 201 |
| Balance on capital account | 0 | 24,787 | −40 | 0 | 40 |
| Net lending (+) or net borrowing (−) from current- and capital-account transactions 2 | −121,837 | −78,660 | −116,188 | −124,105 | −7,917 |
| Net lending (+) or net borrowing (−) from financial-account transactions 3 | −120,111 | −111,891 | −31,252 | −180,649 | −149,397 |
- p
- Preliminary
- r
- Revised
- n.a.
- Not available
- The statistical discrepancy is the difference between net acquisition of financial assets and net incurrence of liabilities in the financial account (including financial derivatives) less the difference between total credits and total debits recorded in the current and capital accounts.
- Sum of current- and capital-account balances.
- Sum of net U.S. acquisition of financial assets and net transactions in financial derivatives less net U.S. incurrence of liabilities.
Note. The statistics are presented in table 1.2 on BEA’s website.
Current-account highlights
- The deficit on goods increased $8.1 billion in the first quarter to $220.5 billion.
- The surplus on primary income decreased $0.4 billion to $62.0 billion.
- The surplus on services increased $0.3 billion to $64.9 billion.
- The deficit on secondary income decreased $0.2 billion to $30.5 billion.
Financial-account highlights
- Net U.S. acquisition of financial assets excluding financial derivatives increased $127.6 billion to $254.7 billion (chart 2).
- Net U.S. incurrence of liabilities excluding financial derivatives increased $304.9 billion to $464.1 billion.
- Transactions in financial derivatives other than reserves reflected first-quarter net lending of $28.7 billion, a $27.9 billion increase from the fourth quarter.
Statistical discrepancy
The statistical discrepancy was −$56.5 billion in the first quarter following a statistical discrepancy of $84.9 billion in the fourth quarter.
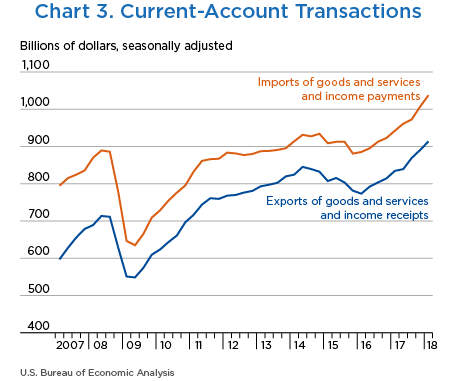
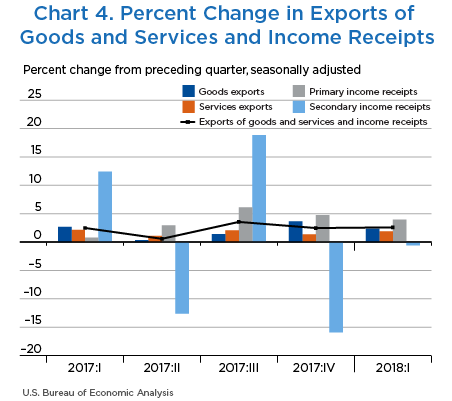
Exports of goods and services and income receipts increased $23.0 billion, or 2.6 percent, in the first quarter to $913.4 billion (charts 3 and 4 and table B).
- Primary income receipts increased $9.8 billion, or 4.0 percent, to $258.8 billion, reflecting increases in direct investment income, portfolio investment income, and other investment income. For more information on direct investment income, see ”Effects of the 2017 Tax Cuts and Jobs Act on Components of Direct Investment.“
- Goods exports increased $9.5 billion, or 2.4 percent, to $411.4 billion, mostly reflecting increases in automotive vehicles, parts, and engines, in consumer goods, primarily jewelry and collectibles, and in nonmonetary gold.
[Click Chart to Expand]
[Click Chart to Expand]
| 2017 | 2018 | Change 2017:IV to 2018:I |
|||
|---|---|---|---|---|---|
| II r | III r | IV r | I p | ||
| Exports of goods and services and income receipts | 839,280 | 868,997 | 890,393 | 913,358 | 22,965 |
| Exports of goods | 382,492 | 387,814 | 401,939 | 411,416 | 9,477 |
| General merchandise | 376,756 | 382,828 | 397,143 | 404,919 | 7,776 |
| Foods, feeds, and beverages | 33,752 | 34,209 | 32,099 | 33,338 | 1,239 |
| Industrial supplies and materials | 110,346 | 111,819 | 124,271 | 125,403 | 1,132 |
| Energy products | 38,318 | 38,716 | 46,234 | 46,945 | 711 |
| Of which: Petroleum and products | 32,441 | 33,122 | 40,384 | 40,071 | −313 |
| Nonenergy products | 72,028 | 73,103 | 78,037 | 78,458 | 421 |
| Capital goods except automotive | 130,882 | 134,985 | 137,341 | 138,209 | 868 |
| Automotive vehicles, parts, and engines | 39,047 | 39,078 | 39,761 | 42,207 | 2,446 |
| Consumer goods except food and automotive | 49,198 | 48,879 | 49,807 | 51,598 | 1,791 |
| Other general merchandise | 13,531 | 13,858 | 13,866 | 14,163 | 297 |
| Net exports of goods under merchanting | 47 | 47 | 56 | 47 | −9 |
| Nonmonetary gold | 5,689 | 4,940 | 4,740 | 6,450 | 1,710 |
| Exports of services1 | 197,252 | 201,293 | 203,977 | 207,828 | 3,851 |
| Maintenance and repair services n.i.e. | 6,574 | 6,213 | 6,740 | 7,171 | 431 |
| Transport | 21,756 | 22,483 | 22,696 | 23,116 | 420 |
| Travel (for all purposes including education) | 52,391 | 52,980 | 53,429 | 53,800 | 371 |
| Business | 9,931 | 9,906 | 9,956 | 9,918 | −38 |
| Personal | 42,460 | 43,074 | 43,473 | 43,882 | 409 |
| Insurance services | 4,392 | 4,708 | 4,755 | 4,862 | 107 |
| Financial services | 26,854 | 27,927 | 28,751 | 29,443 | 692 |
| Charges for the use of intellectual property n.i.e. | 32,214 | 32,273 | 32,762 | 33,359 | 597 |
| Telecommunications, computer, and information services | 10,341 | 10,735 | 10,902 | 11,184 | 282 |
| Other business services | 37,886 | 38,936 | 39,326 | 40,144 | 818 |
| Government goods and services n.i.e. | 4,844 | 5,037 | 4,617 | 4,748 | 131 |
| Primary income receipts | 223,979 | 237,632 | 248,940 | 258,786 | 9,846 |
| Investment income | 222,406 | 236,058 | 247,367 | 257,193 | 9,826 |
| Direct investment income | 120,486 | 127,799 | 135,929 | 137,995 | 2,066 |
| Portfolio investment income | 86,627 | 91,154 | 93,614 | 98,978 | 5,364 |
| Income on equity and investment fund shares | 57,597 | 61,241 | 62,535 | 65,997 | 3,462 |
| Interest on debt securities | 29,031 | 29,913 | 31,078 | 32,981 | 1,903 |
| Other investment income | 15,158 | 16,996 | 17,741 | 20,051 | 2,310 |
| Reserve asset income | 135 | 109 | 82 | 169 | 87 |
| Compensation of employees | 1,573 | 1,573 | 1,573 | 1,593 | 20 |
| Secondary income (current transfer) receipts2 | 35,557 | 42,258 | 35,537 | 35,329 | −208 |
- p
- Preliminary
- r
- Revised
- n.i.e.
- Not included elsewhere
- See also Alexis N. Grimm and Shari Allen, “U.S. International Services: Trade in Services in 2016 and Services Supplied Through Affiliates in 2015,” Survey of Current Business 97 (October 2017).
- Secondary income receipts include U.S. government and private transfers, such as fines and penalties, withholding taxes, insurance-related transfers, and other current transfers.
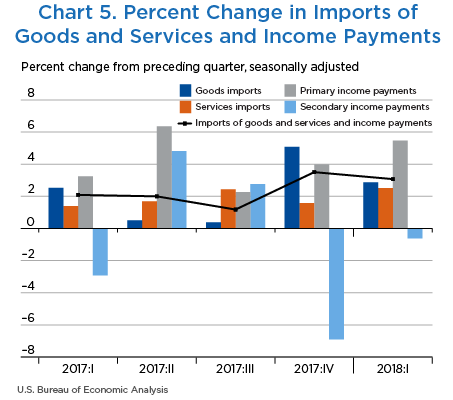
Imports of goods and services and income payments increased $30.9 billion, or 3.1 percent, in the first quarter to $1,037.5 billion (charts 3 and 5 and table C).
- Goods imports increased $17.6 billion, or 2.9 percent, to $631.9 billion, mostly reflecting increases in industrial supplies and materials, primarily petroleum and products, and in consumer goods, primarily medicinal, dental, and pharmaceutical products.
- Primary income payments increased $10.2 billion, or 5.5 percent, to $196.8 billion, reflecting increases in direct investment income, portfolio investment income, and other investment income.
| 2017 | 2018 | Change 2017:IV to 2018:I |
|||
|---|---|---|---|---|---|
| II r | III r | IV r | I p | ||
| Imports of goods and services and income payments | 961,117 | 972,445 | 1,006,541 | 1,037,464 | 30,923 |
| Imports of goods | 582,440 | 584,637 | 614,317 | 631,934 | 17,617 |
| General merchandise | 579,845 | 581,849 | 610,844 | 629,125 | 18,281 |
| Foods, feeds, and beverages | 34,470 | 35,069 | 35,551 | 37,014 | 1,463 |
| Industrial supplies and materials | 125,834 | 123,450 | 133,707 | 142,001 | 8,294 |
| Energy products | 52,427 | 49,448 | 55,863 | 61,760 | 5,897 |
| Of which: Petroleum and products | 48,025 | 45,444 | 51,926 | 58,352 | 6,426 |
| Nonenergy products | 73,407 | 74,002 | 77,844 | 80,241 | 2,397 |
| Capital goods except automotive | 157,945 | 163,218 | 169,186 | 170,589 | 1,403 |
| Automotive vehicles, parts, and engines | 89,551 | 89,455 | 90,589 | 92,885 | 2,296 |
| Consumer goods except food and automotive | 149,365 | 148,197 | 157,597 | 164,007 | 6,410 |
| Other general merchandise | 22,679 | 22,460 | 24,214 | 22,630 | −1,584 |
| Nonmonetary gold | 2,594 | 2,789 | 3,473 | 2,809 | −664 |
| Imports of services1 | 134,004 | 137,261 | 139,426 | 142,936 | 3,510 |
| Maintenance and repair services n.i.e. | 2,136 | 2,004 | 2,059 | 2,016 | −43 |
| Transport | 25,319 | 25,352 | 25,872 | 26,284 | 412 |
| Travel (for all purposes including education) | 33,525 | 33,813 | 34,906 | 35,615 | 709 |
| Business | 4,220 | 4,147 | 4,140 | 4,189 | 49 |
| Personal | 29,306 | 29,666 | 30,766 | 31,426 | 660 |
| Insurance services | 12,820 | 13,094 | 12,434 | 12,095 | −339 |
| Financial services | 7,076 | 7,478 | 7,628 | 7,965 | 337 |
| Charges for the use of intellectual property n.i.e. | 12,298 | 13,136 | 13,808 | 15,318 | 1,510 |
| Telecommunications, computer, and information services | 9,805 | 10,068 | 10,280 | 10,465 | 185 |
| Other business services | 25,549 | 26,774 | 26,929 | 27,607 | 678 |
| Government goods and services n.i.e. | 5,477 | 5,541 | 5,510 | 5,572 | 62 |
| Primary income payments | 175,444 | 179,410 | 186,569 | 196,775 | 10,206 |
| Investment income | 170,545 | 174,430 | 181,601 | 191,803 | 10,202 |
| Direct investment income | 52,298 | 51,342 | 55,978 | 58,914 | 2,936 |
| Portfolio investment income | 106,870 | 109,845 | 111,305 | 115,353 | 4,048 |
| Income on equity and investment fund shares | 36,032 | 36,670 | 36,625 | 38,841 | 2,216 |
| Interest on debt securities | 70,838 | 73,175 | 74,680 | 76,512 | 1,832 |
| Other investment income | 11,377 | 13,243 | 14,317 | 17,536 | 3,219 |
| Compensation of employees | 4,899 | 4,980 | 4,969 | 4,972 | 3 |
| Secondary income (current transfer) payments2 | 69,229 | 71,136 | 66,229 | 65,819 | −410 |
- p
- Preliminary
- r
- Revised
- n.i.e.
- Not included elsewhere
- See also Alexis N. Grimm and Shari Allen, “U.S. International Services: Trade in Services in 2016 and Services Supplied Through Affiliates in 2015,” Survey of Current Business 97 (October 2017).
- Secondary income payments include U.S. government and private transfers, such as U.S. government grants and pensions, fines and penalties, withholding taxes, personal transfers (remittances), insurance-related transfers, and other current transfers.
Acquisition of financial assets
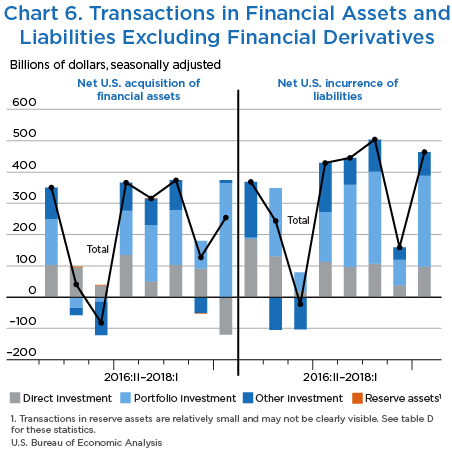
- Net U.S. acquisition of portfolio investment assets increased $277.2 billion to $365.5 billion, reflecting net U.S. purchases of foreign equity and investment fund shares following net sales in the fourth quarter (chart 6 and table D).
- Net U.S. acquisition of other investment assets was $8.9 billion, following net liquidation of $50.9 billion in the fourth quarter. This change mostly reflected net U.S. provision of loans to foreigners, following net foreign repayment in the fourth quarter.
- Net U.S. withdrawal of direct investment assets was $119.7 billion, following net U.S. acquisition of $91.3 billion in the fourth quarter. This change partly offset the changes in portfolio investment assets and other investment assets. The net withdrawal of direct investment assets reflected U.S. parent repatriation of previously reinvested earnings. For more information, see ”Effects of the 2017 Tax Cuts and Jobs Act on Components of Direct Investment.“
Incurrence of liabilities
- Net U.S. incurrence of portfolio investment liabilities increased $210.5 billion to $292.1 billion, mostly reflecting net foreign purchases of U.S. equity and investment fund shares following net foreign sales in the fourth quarter.
- Net U.S. incurrence of direct investment liabilities increased $59.1 billion to $97.3 billion, mostly reflecting net U.S. incurrence of debt liabilities following net repayment in the fourth quarter.
- Net U.S. incurrence of other investment liabilities increased $35.3 billion to $74.6 billion, reflecting partly offsetting changes in transactions in loan and deposit liabilities. Net U.S. incurrence of loan liabilities in the first quarter followed net repayment in the fourth quarter. Net foreign withdrawal of deposits in the United States followed net incurrence in the fourth quarter.
| 2017 | 2018 | Change 2017:IV to 2018:I |
|||
|---|---|---|---|---|---|
| II r | III r | IV r | I p | ||
| Net U.S. acquisition of financial assets excluding financial derivatives (net increase in assets / financial outflow (+)) | 315,922 | 373,591 | 127,135 | 254,728 | 127,593 |
| Direct investment assets | 49,976 | 102,936 | 91,256 | −119,662 | −210,918 |
| Equity | 92,569 | 69,079 | 101,537 | −170,162 | −271,699 |
| Equity other than reinvestment of earnings | 13,047 | 3,850 | −472 | 4,859 | 5,331 |
| Reinvestment of earnings | 79,521 | 65,229 | 102,009 | −175,022 | −277,031 |
| Debt instruments | −42,593 | 33,857 | −10,281 | 50,500 | 60,781 |
| Portfolio investment assets | 180,700 | 175,910 | 88,301 | 365,467 | 277,166 |
| Equity and investment fund shares | 110,542 | 63,399 | −39,233 | 242,518 | 281,751 |
| Debt securities | 70,158 | 112,512 | 127,534 | 122,949 | −4,585 |
| Short-term securities | 38,799 | 74,149 | 40,467 | 21,945 | −18,522 |
| Long-term corporate securities | 21,717 | 26,957 | 62,231 | 72,160 | 9,929 |
| Other long-term securities | 9,642 | 11,406 | 24,836 | 28,844 | 4,008 |
| Other investment assets | 85,095 | 94,804 | −50,883 | 8,930 | 59,813 |
| Currency and deposits | 25,883 | 78,488 | 4,850 | −22,575 | −27,425 |
| Loans | 59,564 | 15,099 | −55,760 | 33,191 | 88,951 |
| Trade credit and advances | −352 | 1,217 | 26 | −1,686 | −1,712 |
| Reserve assets | 150 | −61 | −1,539 | −7 | 1,532 |
| Monetary gold | 0 | 0 | 0 | 0 | 0 |
| Special drawing rights | 15 | 26 | 26 | 33 | 7 |
| Reserve position in the International Monetary Fund | 82 | −98 | −1,535 | −73 | 1,462 |
| Other reserve assets | 54 | 11 | −29 | 34 | 63 |
| Net U.S. incurrence of liabilities excluding financial derivatives (net increase in liabilities / financial inflow (+)) | 445,338 | 504,082 | 159,164 | 464,054 | 304,890 |
| Direct investment liabilities | 97,118 | 107,107 | 38,250 | 97,344 | 59,094 |
| Equity | 77,022 | 72,927 | 64,320 | 62,395 | −1,925 |
| Equity other than reinvestment of earnings | 52,806 | 42,799 | 36,488 | 26,165 | −10,323 |
| Reinvestment of earnings | 24,215 | 30,127 | 27,832 | 36,229 | 8,397 |
| Debt instruments | 20,097 | 34,180 | −26,070 | 34,949 | 61,019 |
| Portfolio investment liabilities | 263,170 | 294,275 | 81,626 | 292,084 | 210,458 |
| Equity and investment fund shares | 21,024 | 80,561 | −3,377 | 150,345 | 153,722 |
| Debt securities | 242,147 | 213,713 | 85,003 | 141,739 | 56,736 |
| Short term | 15,264 | −20,035 | 25,215 | 31,354 | 6,139 |
| Treasury bills and certificates | 3,820 | 9,132 | 20,270 | 13,560 | −6,710 |
| Federally sponsored agency securities | −4,592 | −1,927 | 2,160 | 2,214 | 54 |
| Other short-term securities | 16,036 | −27,240 | 2,785 | 15,580 | 12,795 |
| Long term | 226,882 | 233,748 | 59,788 | 110,385 | 50,597 |
| Treasury bonds and notes | 51,155 | 150,035 | 546 | 76,491 | 75,945 |
| Federally sponsored agency securities | 21,605 | 14,153 | 8,523 | 28,912 | 20,389 |
| Corporate bonds and notes | 148,860 | 70,281 | 51,058 | 4,731 | −46,327 |
| Other | 5,262 | −721 | −339 | 251 | 590 |
| Other investment liabilities | 85,050 | 102,701 | 39,288 | 74,626 | 35,338 |
| Currency (short term) | 15,830 | 15,850 | 17,262 | 16,970 | −292 |
| Deposits | 94,915 | −31,642 | 44,161 | −18,689 | −62,850 |
| Loans | −25,350 | 112,549 | −23,436 | 67,255 | 90,691 |
| Trade credit and advances | −346 | 5,943 | 1,302 | 9,090 | 7,788 |
| Special drawing rights allocations | 0 | 0 | 0 | 0 | 0 |
- p
- Preliminary
- r
- Revised
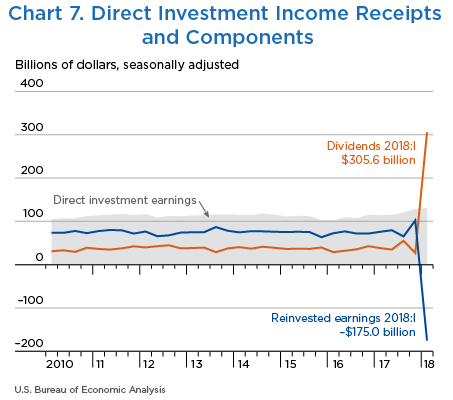
In the international transactions accounts, income on equity, or earnings, of foreign affiliates of U.S. multinational enterprises consist of repatriated earnings to the parent company in the United States in the form of dividends and reinvested earnings in foreign affiliates. When dividends exceed earnings in a given period, there is a net withdrawal of equity assets. In the first quarter of 2018, direct investment earnings were $130.6 billion, reflecting dividends and withdrawals of $305.6 billion and reinvested earnings of −$175.0 billion (chart 7).
The large magnitudes for dividends and withdrawals and the negative reinvested earnings reflect the repatriation of accumulated earnings by foreign affiliates of U.S. multinational enterprises to their parent companies in the United States in response to the 2017 Tax Cuts and Jobs Act (TCJA). The TCJA requires U.S. parent companies to pay a one-time tax on their accumulated earnings held abroad but generally eliminates taxes on repatriated earnings. The negative reinvested earnings of −$175.0 billion reflect the fact that dividends exceeded earnings in the first quarter and U.S parent companies withdrew accumulated prior earnings from their foreign affiliates. The negative reinvested earnings are also reflected in the net acquisition of direct investment assets in the financial account, which was −$119.7 billion in the first quarter of 2018 (table D).
For more information, see “How does the 2017 Tax Cuts and Jobs Act affect BEA’s business income statistics?” and “How are the international transactions accounts affected by an increase in direct investment dividend receipts?”
The U.S. international transactions statistics for the first quarter of 2010 through the fourth quarter of 2017 have been updated to incorporate newly available and revised source data, updated seasonal factors, and improved estimation methodologies (table E).
| Preliminary estimates | Revised estimates | |
|---|---|---|
| Balance on goods | −214,261 | −212,378 |
| Balance on services | 60,375 | 64,551 |
| Balance on primary income | 57,195 | 62,371 |
| Balance on secondary income (current transfers) | −31,467 | −30,692 |
| Balance on current account | −128,158 | −116,148 |
| Net U.S. acquisition of financial assets | 177,861 | 127,135 |
| Net U.S. incurrence of liabilities | 208,437 | 159,164 |
| Net lending or borrowing from financial-account transactions | −29,799 | −31,252 |
For more information, see Barbara Berman and Erin (Yiran) Xin, “Annual Update of the U.S. International Transactions Accounts” in this issue of the Survey of Current Business.