Direct Investment Positions for 2017
Country and Industry Detail
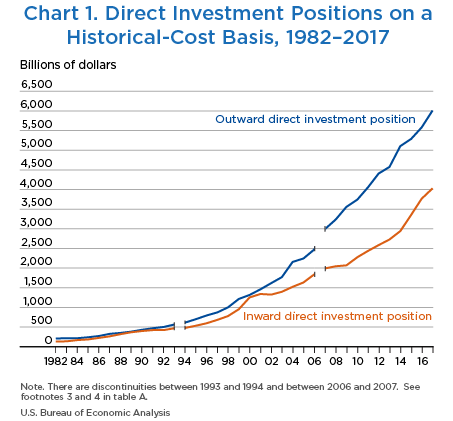
Growth in U.S. direct investment abroad (outward investment) accelerated in 2017 while growth in foreign direct investment in the United States (inward investment) decelerated, amid improving economic conditions both in the United States and in major foreign host countries. Growth in the outward investment position valued at historical cost was 7.6 percent in 2017, up from 5.6 percent in 2016 (table A and chart 1). The inward investment position valued at historical cost grew 6.9 percent in 2017, down from 12.2 percent in 2016.
| Yearend | Billions of dollars | Percent change from preceding year | ||
|---|---|---|---|---|
| Outward position1 | Inward position2 | Outward position1 | Inward position2 | |
| 1982 | 207.8 | 124.7 | ||
| 1983 | 212.2 | 137.1 | 2.1 | 9.9 |
| 1984 | 218.1 | 164.6 | 2.8 | 20.1 |
| 1985 | 238.4 | 184.6 | 9.3 | 12.2 |
| 1986 | 270.5 | 220.4 | 13.5 | 19.4 |
| 1987 | 326.3 | 263.4 | 20.6 | 19.5 |
| 1988 | 347.2 | 314.8 | 6.4 | 19.5 |
| 1989 | 381.8 | 368.9 | 10.0 | 17.2 |
| 1990 | 430.5 | 394.9 | 12.8 | 7.0 |
| 1991 | 467.8 | 419.1 | 8.7 | 6.1 |
| 1992 | 502.1 | 423.1 | 7.3 | 1.0 |
| 1993 | 564.3 | 467.4 | 12.4 | 10.5 |
| 1994 | 612.9 | 480.7 | (3) | (3) |
| 1995 | 699.0 | 535.6 | 14.1 | 11.4 |
| 1996 | 795.2 | 598.0 | 13.8 | 11.7 |
| 1997 | 871.3 | 681.8 | 9.6 | 14.0 |
| 1998 | 1,000.7 | 778.4 | 14.8 | 14.2 |
| 1999 | 1,216.0 | 955.7 | 21.5 | 22.8 |
| 2000 | 1,316.2 | 1,256.9 | 8.2 | 31.5 |
| 2001 | 1,460.4 | 1,344.0 | 10.9 | 6.9 |
| 2002 | 1,616.5 | 1,327.2 | 10.7 | −1.3 |
| 2003 | 1,769.6 | 1,395.2 | 9.5 | 5.1 |
| 2004 | 2,160.8 | 1,520.3 | 22.1 | 9.0 |
| 2005 | 2,241.7 | 1,634.1 | 3.7 | 7.5 |
| 2006 | 2,477.3 | 1,840.5 | 10.5 | 12.6 |
| 2007 | 2,994.0 | 1,993.2 | (4) | (4) |
| 2008 | 3,232.5 | 2,046.7 | 8.0 | 2.7 |
| 2009 | 3,565.0 | 2,069.4 | 10.3 | 1.1 |
| 2010 | 3,741.9 | 2,280.0 | 5.0 | 10.2 |
| 2011 | 4,050.0 | 2,433.8 | 8.2 | 6.7 |
| 2012 | 4,410.0 | 2,584.7 | 8.9 | 6.2 |
| 2013 | 4,579.7 | 2,727.8 | 3.8 | 5.5 |
| 2014 | 5,108.8r | 2,945.8 | 11.6 | 8.0 |
| 2015 | 5,289.1r | 3,354.9r | 3.5 | 13.9 |
| 2016 | 5,586.0r | 3,765.1r | 5.6 | 12.2 |
| 2017 | 6,013.3p | 4,025.5p | 7.6 | 6.9 |
- p
- Preliminary
- r
- Revised
- U.S. direct investment position abroad.
- Foreign direct investment position in the United States.
- The direct investment positions reflect a discontinuity between 1993 and 1994 because of the reclassification of debt instruments between parent companies and affiliates that are nondepository financial intermediaries from direct investment to other investment accounts.
- The direct investment positions reflect a discontinuity between 2006 and 2007 because of the reclassification of permanent debt between affiliated depository institutions from direct investment to other investment accounts.
The contrast between the acceleration in outward investment and the deceleration in inward investment partly reflects differences in factors influencing direct investment in the United States and abroad. Both outward and inward investment were supported by conditions that led to general economic growth. Real gross domestic product growth in the Group of 20 (G–20) countries, for example, increased from 3.2 percent to 3.8 percent.1 However, the tax policy environment was particularly uncertain in the United States in 2017 compared with that in other countries. The prospect of U.S. tax law changes, which were passed at the end of 2017, may have slowed inward investment, particularly for investments structured—at least in part—to take advantage of lower tax rates abroad. The decline in the inward financial transactions was especially sharp for investments from countries such as Ireland and Luxembourg, countries in which corporate inversions occurred in 2016.2
The annual changes in the outward and inward investment positions reflect financial transactions—investment in equity and debt instruments—and other changes in the position, such as capital gains and losses and currency-translation adjustments. Inward financial transactions were 41 percent lower in 2017 ($277.3 billion) compared with 2016 ($471.8 billion). The Bureau of Economic Analysis (BEA) statistics on new foreign direct investment showed a 32 percent decrease in expenditures by foreign multinational enterprises to acquire, establish, and expand U.S. affiliates in 2017.3 In contrast, outward financial transactions were 4 percent larger in 2017 ($300.4 billion) than in 2016 ($289.3 billion).
This article highlights the changes in the outward and inward direct investment positions from 2016 to 2017 by type of direct investment transaction, such as equity or debt. It also presents direct investment positions at the end of 2017 by primary industry of the affiliate and by country. The outward statistics are classified by country of the foreign affiliate with which the U.S. parent has direct transactions and positions, meaning they are not routed through a third country. The inward statistics are classified by (1) country of the foreign parent or of other members of the foreign parent group that have direct transactions and positions with the U.S. affiliate and by (2) country of ultimate beneficial owner (UBO). Updates to previously released statistics are also highlighted.
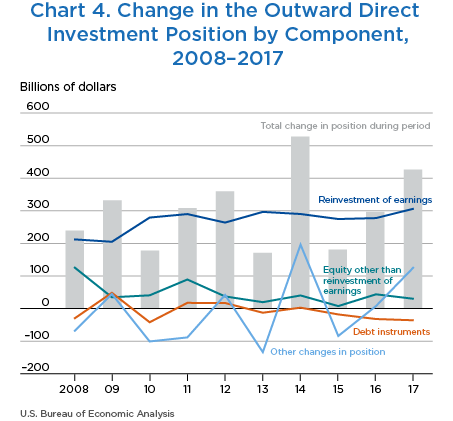
The U.S. direct investment position abroad valued at historical cost—the book value of U.S. direct investors’ equity in, and net outstanding loans to, their foreign affiliates—was $6,013.3 billion at the end of 2017. The position grew $427.3 billion, or 7.6 percent, in 2017 after growing 5.6 percent in 2016. The growth in 2017 mostly reflected reinvestment of earnings in ongoing operations of $306.5 billion (table B, line 4) and valuation and other changes of $126.9 billion (table B, line 9). Equity investment increases other than reinvestment of earnings, including greenfield investment, was $85.7 billion (table B, line 6).
| Line | 2016 | 2017 | Change | Percent change | |
|---|---|---|---|---|---|
| 1 | Total change in position during period | 297.0 | 427.3 | 130.3 | 43.9 |
| 2 | Financial transactions without current-cost adjustment | 289.3 | 300.4 | 11.1 | 3.8 |
| 3 | Equity | 321.4 | 336.4 | 15.1 | 4.7 |
| 4 | Reinvestment of earnings without current-cost adjustment | 277.6 | 306.5 | 28.9 | 10.4 |
| 5 | Equity other than reinvestment of earnings | 43.7 | 29.9 | −13.8 | −31.7 |
| 6 | Increases | 99.6 | 85.7 | −13.9 | −14.0 |
| 7 | Decreases | 55.8 | 55.8 | −0.1 | −0.1 |
| 8 | Debt instruments | −32.1 | −36.0 | −3.9 | 12.3 |
| 9 | Other changes in position | 7.7 | 126.9 | 119.2 | (Z) |
| 10 | Capital gains and losses of affiliates | 2.3 | 21.1 | 18.8 | (Z) |
| 11 | Translation adjustments | −19.2 | 48.9 | 68.1 | n.s. |
| 12 | Other changes in volume and valuation | 24.7 | 56.9 | 32.3 | 130.9 |
- (Z)
- Represents absolute percentage changes greater than 400 percent.
- n.s.
- Not shown. The data are not available, do not apply, or are not defined.
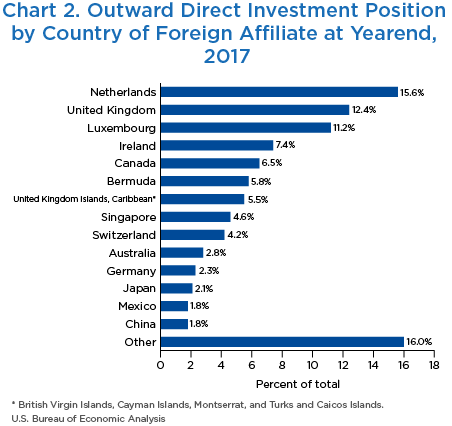
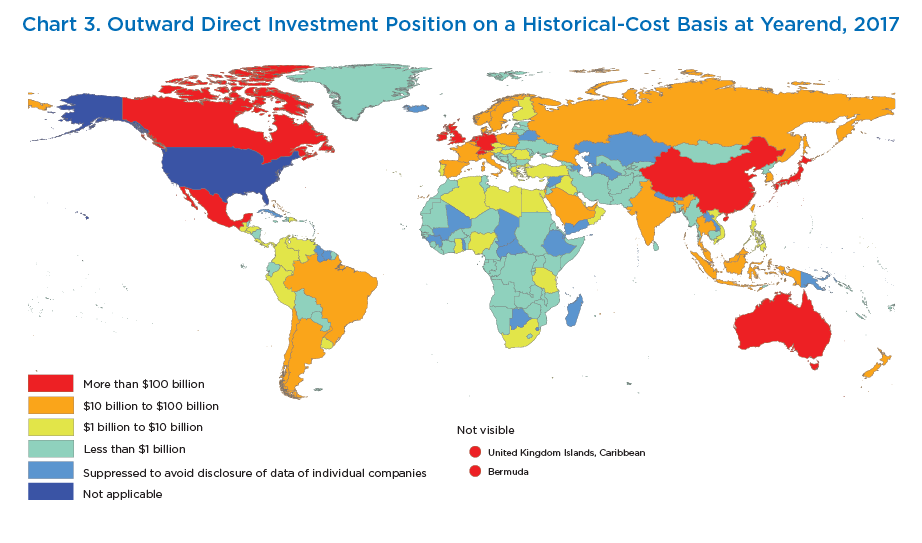
U.S. multinational enterprises (MNEs) invest in nearly every country around the world, but five host countries accounted for more than half of the total position at the end of 2017 (table C and charts 2 and 3). The Netherlands was the top host country with a position of $936.7 billion, followed by the United Kingdom ($747.6 billion), Luxembourg ($676.4 billion), Ireland ($446.4 billion), and Canada ($391.2 billion). Across all countries, holding companies accounted for nearly half of the outward position at the end of 2017.
| Total | Equity1 | Debt instruments | |||
|---|---|---|---|---|---|
| Net | U.S. parents' receivables | U.S. parents' payables | |||
| All Countries | 6,013.3 | 5,830.5 | 182.9 | 829.4 | 646.6 |
| Canada | 391.2 | 371.8 | 19.4 | 55.3 | 35.9 |
| Europe | 3,553.4 | 3,434.9 | 118.5 | 470.9 | 352.3 |
| Of which: | |||||
| Netherlands | 936.7 | 903.1 | 33.6 | 87.9 | 54.3 |
| United Kingdom | 747.6 | 701.0 | 46.6 | 111.7 | 65.2 |
| Luxembourg | 676.4 | 638.2 | 38.2 | 99.4 | 61.2 |
| Ireland | 446.4 | 430.0 | 16.4 | 80.7 | 64.4 |
| Switzerland | 250.0 | 255.6 | −5.7 | 21.7 | 27.3 |
| Germany | 136.1 | 135.0 | 1.1 | 26.9 | 25.8 |
| Latin America and Other Western Hemisphere | 1,008.1 | 1,021.1 | −13.1 | 110.2 | 123.3 |
| Of which: | |||||
| Bermuda | 346.8 | 410.7 | −63.8 | 19.4 | 83.2 |
| United Kingdom Islands, Caribbean2 | 331.4 | 312.0 | 19.4 | 26.1 | 6.7 |
| Mexico | 109.7 | 105.4 | 4.3 | 14.1 | 9.9 |
| Africa | 50.3 | 44.2 | 6.1 | 11.4 | 5.4 |
| Of which: | |||||
| Egypt | 9.4 | 9.2 | 0.1 | 0.4 | 0.3 |
| Middle East | 69.1 | 82.5 | −13.3 | 18.9 | 32.2 |
| Of which: | |||||
| Israel | 26.7 | 27.0 | −0.4 | 2.2 | 2.6 |
| Asia and Pacific | 941.2 | 875.9 | 65.3 | 162.8 | 97.5 |
| Of which: | |||||
| Singapore | 274.3 | 267.9 | 6.4 | 24.6 | 18.2 |
| Australia | 168.9 | 109.3 | 59.5 | 70.0 | 10.5 |
| Japan | 129.1 | 145.4 | −16.4 | 10.3 | 26.6 |
| China | 107.6 | 100.8 | 6.7 | 17.2 | 10.5 |
| Hong Kong | 81.2 | 77.8 | 3.5 | 12.4 | 8.9 |
| India | 44.5 | 43.5 | 0.9 | 7.2 | 6.2 |
| Korea, Republic of | 41.6 | 38.3 | 3.3 | 5.5 | 2.2 |
- Includes capital stock, additional paid-in capital, retained earnings, and cumulative translation adjustments.
- The “United Kingdom Islands, Caribbean” includes British Virgin Islands, Cayman Islands, Montserrat, and Turks and Caicos Islands.
Changes by component
The $427.3 billion increase in the outward direct investment position reflected financial transactions outflows and other changes in position (table B and chart 4).
Financial transactions
Financial transactions outflows were $300.4 billion in 2017, up $11.1 billion, or 3.8 percent, from $289.3 billion in 2016. The increase mostly consisted of reinvestment of earnings in ongoing operations.
Reinvestment of earnings. Reinvestment of earnings—the difference between the U.S. parents’ share of their foreign affiliates’ current-period earnings and any dividends paid by the foreign affiliates to their parents—increased $28.9 billion, or 10.4 percent, to $306.5 billion in 2017.4 The increase was the net result of a $44.8 billion increase in foreign affiliate earnings and a $15.8 billion increase in dividends. While dividends increased overall for the year, dividends in the fourth quarter of 2017 were unusually small, possibly as a result of companies anticipating changes to U.S. tax laws at the end of 2017. The share of current-year earnings that was reinvested (the reinvestment ratio) was nearly unchanged from 2016 at about 66 percent.
Equity other than reinvestment of earnings. U.S. parent net equity outflows other than reinvestment of earnings decreased $13.8 billion, or 31.7 percent, to $29.9 billion in 2017. The net outflows in 2017 resulted from equity investment increases other than reinvestment of earnings of $85.7 billion (table B, line 6), which were partly offset by equity investment decreases, including divestments,5 of $55.8 billion (table B, line 7). The $85.7 billion increase in equity resulted from $42.1 billion in equity for the acquisition or establishment of new foreign affiliates, including greenfield investment, and $43.6 billion in equity contributions to existing foreign affiliates. Equity increases in 2017 were down 14.0 percent from 2016, despite a 13.1 percent increase in the value of global merger and acquisition activity for non-U.S. target companies.6 The $55.8 billion decrease in equity resulted from $16.8 billion in liquidations or sales of affiliates and $39.0 billion in withdrawals of capital from foreign affiliates by their U.S. parents.
Debt instruments investment. In 2017, U.S. parents’ borrowing and lending transactions with their foreign affiliates decreased their net debt claims on affiliates by $36.0 billion, compared with a decrease of $32.1 billion in 2016. The decrease in net debt claims in 2017 resulted from a $3.8 billion increase in U.S. parent debt claims on their foreign affiliates and a $39.8 billion increase in U.S. parent debt obligations to their foreign affiliates.
Other changes in position
Other changes in position were $126.9 billion in 2017, compared with $7.7 billion in 2016 (table B, line 9). Other changes in position in 2017 consisted of currency-translation adjustments of $48.9 billion, capital gains and losses of $21.1 billion, and other changes in volume and valuation of $56.9 billion (table B, lines 10–12). Translation adjustments reflected the increase in the U.S. dollar value of investments in foreign affiliates caused by a 6.1 percent depreciation of the U.S. dollar’s direct investment-weighted exchange value at yearend. The largest dollar depreciations occurred against the Euro and the British pound. Other changes in volume and valuation most commonly reflect capital gains and losses recorded by U.S. parents or the difference between affiliates’ book value and their current sale or purchase price, when U.S. parents sell their full interest in a foreign affiliate. For consistent historical-cost valuation, when a foreign affiliate is sold, the direct investment position abroad decreases by the amount of the U.S. parent’s share of the foreign affiliate’s book value. In cases where the sale price (included in the financial transaction) exceeds the book value of the foreign affiliate, BEA incorporates positive adjustments to volume and valuation to reconcile the financial transactions and the direct investment position.
Changes by area and by country
In 2017, the outward direct investment position increased in five of the six major geographic areas (tables 1.1 and 1.2). U.S. parents’ investment in their European affiliates had the largest dollar and percentage increases. The next largest increases by major area occurred in Latin America and Other Western Hemisphere and in Asia and Pacific. Africa was the only major area to experience a decrease in the outward position.
Europe. The U.S. direct investment position in Europe increased $243.6 billion to $3,553.4 billion in 2017. The largest increases occurred in Switzerland, the United Kingdom, Ireland, the Netherlands, and Luxembourg.
Latin America and Other Western Hemisphere. The U.S. direct investment position in Latin America and Other Western Hemisphere increased $78.6 billion, to $1,008.1 billion in 2017. The largest increases occurred in Bermuda and in the United Kingdom Islands in the Caribbean (British Virgin Islands, Cayman Islands, Montserrat, and Turks and Caicos Islands).
Asia and Pacific. The U.S. direct investment position in Asia and Pacific increased $60.1 billion, to $941.2 billion in 2017. The largest increases occurred in Singapore, Hong Kong, and China.
The foreign direct investment position in the United States valued at historical cost—the book value of foreign direct investors’ equity in, and net outstanding loans to, their U.S. affiliates—was $4,025.5 billion at the end of 2017. The position grew $260.4 billion, or 6.9 percent, in 2017 after growing 12.2 percent in 2016. The growth in 2017 reflected $277.3 billion of direct investment financial transactions inflows, mostly consisting of increases in equity investment other than reinvestment of earnings of $218.2 billion (table D, line 6) and reinvestment of earnings in ongoing operations of $93.0 billion (table D, line 4).
| Line | 2016 | 2017 | Change | Percent change | |
|---|---|---|---|---|---|
| 1 | Total change in position during period | 410.2 | 260.4 | −149.8 | −36.5 |
| 2 | Financial transactions without current-cost adjustment | 471.8 | 277.3 | −194.5 | −41.2 |
| 3 | Equity | 373.4 | 293.6 | −79.8 | −21.4 |
| 4 | Reinvestment of earnings without current-cost adjustment | 77.4 | 93.0 | 15.6 | 20.2 |
| 5 | Equity other than reinvestment of earnings | 296.0 | 200.5 | −95.4 | −32.2 |
| 6 | Increases | 317.8 | 218.2 | −99.6 | −31.4 |
| 7 | Decreases | 21.8 | 17.6 | −4.2 | −19.4 |
| 8 | Debt instruments | 98.4 | −16.3 | −114.8 | −116.6 |
| 9 | Other changes in position | −61.6 | −16.9 | 44.7 | −72.6 |
| 10 | Capital gains and losses of affiliates | −22.9 | −11.7 | 11.2 | −48.9 |
| 11 | Translation adjustments | −3.3 | 4.6 | 7.9 | −242.4 |
| 12 | Other changes in volume and valuation | −35.4 | −9.8 | 25.6 | −72.3 |
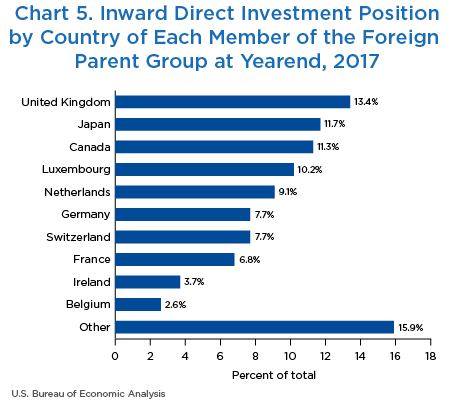
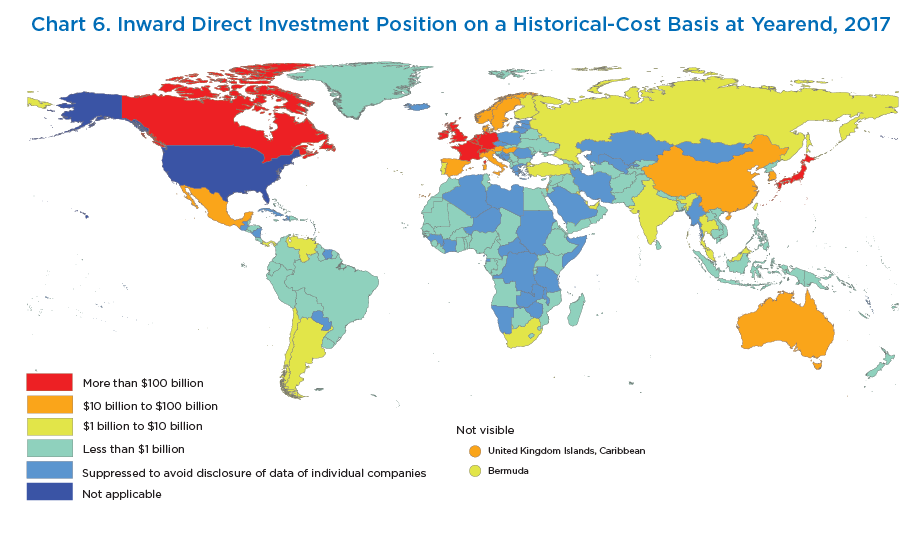
The United States has received over a billion dollars of direct investment from dozens of countries, however, five investing countries accounted for more than half of the overall foreign direct investment position in the United States at the end of 2017 (table E and charts 5 and 6). The United Kingdom was the top investing country with a position of $540.9 billion, followed by Japan ($469.0 billion), Canada ($453.1 billion), Luxembourg ($410.7 billion), and the Netherlands ($367.1 billion). Foreign direct investment was concentrated in the U.S. manufacturing sector, which accounted for almost 40 percent of the inward position at the end of 2017.
| Total | Equity1 | Debt instruments | |||
|---|---|---|---|---|---|
| Net | U.S. affiliates' payables | U.S. affiliates' recievables | |||
| All countries | 4,025.5 | 3,314.1 | 711.4 | 1,146.0 | 434.7 |
| Canada | 453.1 | 417.7 | 35.4 | 79.3 | 43.9 |
| Europe | 2,731.3 | 2,134.8 | 596.5 | 897.2 | 300.7 |
| Of which: | |||||
| United Kingdom | 540.9 | 456.4 | 84.5 | 132.5 | 48.0 |
| Luxembourg | 410.7 | 244.1 | 166.7 | 190.9 | 24.3 |
| Netherlands | 367.1 | 298.0 | 69.2 | 110.6 | 41.4 |
| Germany | 310.2 | 279.8 | 30.4 | 46.8 | 16.4 |
| Switzerland | 309.4 | 166.4 | 142.9 | 187.6 | 44.7 |
| France | 275.5 | 239.5 | 35.9 | 42.7 | 6.8 |
| Latin America and Other Western Hemisphere | 124.9 | 146.8 | −22.0 | 38.6 | 60.5 |
| Of which: | |||||
| United Kingdom Islands, Caribbean2 | 87.4 | 75.3 | 12.1 | 18.7 | 6.6 |
| Africa | 5.6 | 5.8 | −0.2 | 1.9 | 2.1 |
| Middle East | 26.0 | 19.5 | 6.5 | 9.4 | 2.9 |
| Of which: | |||||
| Israel | 11.9 | 10.9 | 1.1 | 3.2 | 2.1 |
| Asia and Pacific | 684.6 | 589.5 | 95.1 | 119.7 | 24.6 |
| Of which: | |||||
| Japan | 469.0 | 425.7 | 43.3 | 52.9 | 9.6 |
| Australia | 66.7 | 61.9 | 4.8 | 7.4 | 2.6 |
| Korea, Republic of | 51.8 | 41.0 | 10.8 | 12.6 | 1.8 |
- Includes capital stock, additional paid-in capital, retained earnings, and cumulative translation adjustments.
- The “United Kingdom Islands, Caribbean” includes British Virgin Islands, Cayman Islands, Montserrat, and Turks and Caicos Islands.
Changes by component
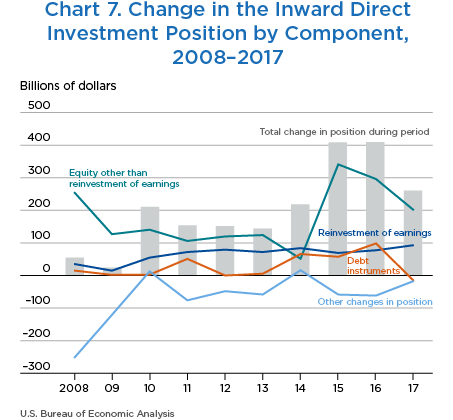
The $260.4 billion increase in the inward direct investment position resulted from financial transactions inflows and other changes in position (table D and chart 7).
Financial transactions
Financial transactions inflows were $277.3 billion in 2017, down $194.5 billion, or 41.2 percent, from $471.8 billion in 2016. Most of the inflows in 2017 were equity investment other than reinvestment of earnings, including greenfield investment (table D, line 6).
Reinvestment of earnings. Reinvestment of earnings—the difference between the foreign parent’s share of their U.S. affiliates’ current-period earnings and any dividends paid by U.S. affiliates to their parents—increased $15.6 billion, or 20.2 percent, to $93.0 billion.7 The increase was the net result of a $14.7 billion increase in U.S. affiliate earnings and a $1.0 billion decrease in dividends. The share of current-year earnings that was reinvested (the reinvestment ratio) increased from 62.5 percent in 2016 to 67.1 percent in 2017.
Equity other than reinvestment of earnings. Net equity inflows other than reinvestment of earnings decreased $95.4 billion, or 32.2 percent, to $200.5 billion in 2017. The net inflows in 2017 resulted from equity increases other than reinvestment of earnings, including greenfield investment, of $218.2 billion (table D, line 6), which were partly offset by equity decreases, including divestments,8 of $17.6 billion (table D, line 7). The $218.2 billion increase in equity reflected $146.1 billion in equity for the acquisition or establishment of new affiliates, including greenfield investment, and $72.1 billion in equity contributions to existing affiliates. The $17.6 billion decrease in equity resulted from $3.8 billion in liquidations or sales of U.S. affiliates and $13.8 billion in withdrawals of capital from U.S. affiliates by their foreign parents.
Debt instruments investment. U.S. affiliates’ borrowing and lending transactions with their foreign parent groups decreased their net debt liabilities by $16.3 billion. This decrease in debt liabilities contrasts with a $98.4 billion increase in debt liabilities in 2016. The decrease in 2017 resulted from a $6.6 billion increase in U.S. affiliate debt obligations to members of their foreign parent groups and a $23.0 billion increase in U.S. affiliate debt claims on members of their foreign parent groups.
Other changes in position
Other changes in position totaled –$16.9 billion in 2017, compared with –$61.6 billion in 2016 (table D, line 9). Other changes in position in 2017 consisted of capital gains and losses of –$11.7 billion, currency-translation adjustments of $4.6 billion, and other changes in volume and valuation of –$9.8 billion (table D, lines 10–12). Other changes in volume and valuation mainly resulted from differences between the purchase price and book value of acquired U.S. businesses. For consistent historical-cost valuation, when a U.S. affiliate is acquired, the foreign direct investment equity position in the United States increases by the amount of the foreign parent’s share of the U.S. affiliate’s book value. In cases where the purchase price (included in financial transactions) exceeds the book value of the U.S. business, BEA incorporates negative adjustments to volume and valuation to reconcile the financial transactions and the direct investment position. The currency translation adjustments of $4.6 billion are smaller than those for outward investment because most U.S. affiliates maintain their accounting records in U.S. dollars and because most of their assets and liabilities are denominated in U.S. dollars.
Changes by area and by country of the foreign parent group
In 2017, the inward direct investment position increased for all major geographic areas (tables E, 2.1 and 2.2). The position increased the most for investors from Europe, followed by Canada and Asia and Pacific.
Europe. European direct investment in the United States increased $128.2 billion to $2,731.3 billion in 2017. The three largest increases were from Ireland, Switzerland, and the Netherlands.
Canada. Canadian direct investment in the United States increased $72.4 billion to $453.1 billion in 2017.
Asia and Pacific. Asian and Pacific direct investment in the United States increased $56.7 billion to $684.6 billion in 2017. The largest increase was from Japan.
Changes by area and country of ultimate beneficial owner (UBO)
The statistics on inward direct investment positions presented in this article thus far reflect investment by the country of the foreign parent or by the member of the foreign parent group, classified by the country of the first entity outside of the United States with an equity or debt claim on the U.S. affiliate.9 In addition to the data collected by the country of foreign parent, BEA collects data on the country of the ultimate beneficial owner (UBO) of the U.S. affiliate and presents the inward position classified by area and country of UBO.10 By area of UBO, the position increased the most for investors from Europe followed by Asia and Pacific and Canada (Table F).
| By country of each member of the foreign parent group | By country of UBO | |||||
|---|---|---|---|---|---|---|
| 2016 | 2017 | Change | 2016 | 2017 | Change | |
| All countries | 3,765.1 | 4,025.5 | 260.4 | 3,765.1 | 4,025.5 | 260.4 |
| Canada | 380.7 | 453.1 | 72.4 | 457.6 | 523.8 | 66.2 |
| Europe | 2,603.1 | 2,731.3 | 128.2 | 2,239.3 | 2,369.8 | 130.5 |
| Of which: | ||||||
| Belguim | 104.0 | 103.5 | −0.6 | 71.2 | 80.4 | 9.1 |
| France | 256.0 | 275.5 | 19.5 | 272.1 | 301.5 | 29.4 |
| Germany | 294.3 | 310.2 | 15.9 | 371.1 | 405.6 | 34.4 |
| Ireland | 105.8 | 147.8 | 42.1 | 320.1 | 328.7 | 8.6 |
| Luxembourg | 424.1 | 410.7 | −13.4 | 29.8 | 28.8 | −1.0 |
| Netherlands | 345.9 | 367.1 | 21.2 | 189.9 | 169.2 | −20.7 |
| Switzerland | 283.2 | 309.4 | 26.2 | 180.9 | 201.9 | 21.0 |
| United Kingdom | 535.1 | 540.9 | 5.8 | 572.2 | 614.9 | 42.7 |
| Latin America and Other Western Hemisphere | 124.6 | 124.9 | 0.3 | 163.7 | 172.7 | 9.0 |
| Of which: | ||||||
| Bermuda | 9.1 | 6.7 | −2.4 | 33.2 | 35.9 | 2.7 |
| Brazil | −2.4 | −2.0 | 0.4 | 38.8 | 42.8 | 4.1 |
| Mexico | 17.2 | 18.0 | 0.8 | 34.8 | 35.4 | 0.6 |
| United Kingdom Islands, Caribbean2 | 86.9 | 87.4 | 0.6 | 12.3 | 13.4 | 1.1 |
| Africa | 4.5 | 5.6 | 1.1 | 4.5 | 5.8 | 1.3 |
| Middle East | 24.4 | 26.0 | 1.6 | 100.7 | 84.3 | −16.4 |
| Of which: | ||||||
| Israel | 12.3 | 11.9 | −0.3 | 59.2 | 39.3 | −19.9 |
| United Arab Emarites | 3.2 | 4.8 | 1.6 | 25.0 | 26.0 | 1.0 |
| Asia and Pacific | 627.9 | 684.6 | 56.7 | 725.9 | 793.6 | 67.7 |
| Of which: | ||||||
| Australia | 69.3 | 66.7 | −2.5 | 76.2 | 73.0 | −3.2 |
| China | 40.4 | 39.5 | −0.9 | 59.0 | 58.0 | −0.9 |
| Japan | 418.3 | 469.0 | 50.7 | 422.2 | 476.9 | 54.6 |
| Korea, Republic of | 42.5 | 51.8 | 9.3 | 41.2 | 50.6 | 9.4 |
| Singapore | 23.6 | 22.4 | −1.2 | 82.8 | 88.6 | 5.8 |
| United States | 73.4 | 75.6 | 2.2 | |||
- The ultimate beneficial owner (UBO) is that person, proceeding up a U.S. affiliate's ownership chain, beginning with and including the foreign parent, that is not owned more than 50 percent by another person. The country of UBO is often the same as that of the foreign parent, but it may be a different foreign country or the United States.
- The “United Kingdom Islands, Caribbean” includes British Virgin Islands, Cayman Islands, Montserrat, and Turks and Caicos Islands.
Europe. European direct investment in the United States on a UBO basis increased $130.5 billion to $2,369.8 billion in 2017. The three largest increases were from the United Kingdom, Germany, and France.
Asia and Pacific. Asian and Pacific direct investment in the United States on a UBO basis increased $67.7 billion to $793.6 billion in 2017. The three largest increases were from Japan, South Korea, and Singapore.
Canada. Canadian direct investment in the United States on a UBO basis increased $66.2 billion to $523.8 billion in 2017.
The statistics on direct investment positions by country and by industry for 2017 presented in this article are preliminary. Updated statistics on positions and related financial transactions for 2014–2016 for outward investment and 2015–2016 for inward investment incorporate newly available data collected on (1) BEA’s quarterly surveys of transactions between parents and their affiliates and (2) BEA’s surveys of the activities of multinational enterprises. The revisions to the outward direct investment position for 2014–2016 reflect the incorporation of the results of the 2014 Benchmark Survey of U.S. Direct Investment Abroad. Updated outward positions for 2014 reflect revisions to financial transactions and other changes in position for 2014 (table G). Updated positions for 2015 reflect revisions to financial transactions and other changes in position for 2015 and to outward positions for 2014. Updated positions for 2016 reflect revisions to financial transactions and other changes in position for 2016 and to positions for 2015.
| Outward position1 | Inward position2 | ||||
|---|---|---|---|---|---|
| 2014 | 2015 | 2016 | 2015 | 2016 | |
| Total revision | 198.8 | 240.3 | 253.8 | 51.3 | 39.7 |
| Financial transactions without current-cost adjustment | 38.3 | 1.8 | 8.6 | 1.9 | 14.7 |
| Other changes in position | 160.5 | 39.7 | 4.9 | 49.5 | −26.3 |
| Revision to prior year's position | 198.8 | 240.3 | 51.3 | ||
- U.S. direct investment position abroad.
- Foreign direct investment position in the United States.
- Based on data from the International Monetary Fund’s Main Economic Indicators. The G–20 is a group of major world economies whose leaders meet to discuss policies toward ensuring stability in the international financial system. Its members are Argentina, Australia, Brazil, Canada, China, France, Germany, India, Indonesia, Italy, Japan, Mexico, Russia, Saudi Arabia, South Africa, South Korea, Turkey, the United Kingdom, the United States, and the European Union.
- A corporate inversion occurs when the U.S. corporation forms a new corporation (or acquires an existing corporation) in a foreign country of convenience and simultaneously inverts its ownership structure so that the U.S. corporation is now a U.S. affiliate of a foreign corporation. See Jessica M. Hanson, Howard I. Krakower, Raymond J. Mataloni Jr., and Kate L.S. Pinard, “The Effects of Corporate Inversions on International and National Economic Accounts,” Survey of Current Business 95 (February 2015).
- See Thomas Anderson, “New Foreign Direct Investment in the United States in 2017,” Survey 98 (August 2018).
- The estimates for 2017 are the second in a series of four estimates for 2017. Recent experience has shown that subsequent estimates of reinvestment of earnings could be revised downward; for example, the third estimate of reinvestment of earnings for 2016 was 0.4 percent lower than the second estimate, the third estimate for 2015 was 4.6 percent lower than the second estimate, and the third estimate for 2014 was 3.9 percent lower than the second estimate. Revisions from the second estimates to the third estimates largely result from reconciling dividends reported on BEA’s quarterly direct investment surveys with those reported on BEA’s annual surveys, in which affiliates generally report data based on their audited financial statements.
- A divestment covers the sale or liquidation of the U.S. parent’s full direct investment equity position in an affiliate.
- Andrew Kelly, Mergers and Acquisitions Review: Financial Advisors, Full Year 2018 (Thomson Reuters, 2018).
- These estimates for 2017 are the second in a series of four estimates for 2017. Recent experience has shown that subsequent estimates of reinvestment of earnings could be revised downward; for example, the third estimate of reinvestment of earnings in 2016 was 10.5 percent lower than the second estimate, and the third estimate in 2015 was 0.9 percent lower than the second estimate. Revisions from the second estimates to the third estimates largely result from reconciling dividends reported on BEA’s quarterly direct investment surveys with those reported on BEA’s annual surveys, in which affiliates generally report data based on their audited financial statements.
- A divestment covers the sale or liquidation of the foreign parent’s full direct investment equity position in an affiliate.
- This convention follows guidelines in the International Monetary Fund’s Balance of Payments and International Investment Position Manual, Sixth Edition (Washington, DC: International Monetary Fund, 2009).
- The UBO is defined as the entity that ultimately owns or controls an affiliate and thus ultimately derives the benefits and assumes the risks from owning or controlling an affiliate.
