
Improved Estimates of the National Income and Product Accounts
Results of the 2018 Comprehensive Update
Jason F. Haurie and Shelly Smith contributed to the analysis in this article.
On July 27, 2018, the Bureau of Economic Analysis (BEA) released the initial results of the 15th comprehensive update of the National Income and Product Accounts (NIPAs), with revised estimates beginning with 1929.
Comprehensive updates provide the opportunity for BEA to make changes to its economic statistics to increase their overall quality and relevance. For example, as part of this update, BEA expanded the economic perspective of the accounts by introducing the value of capital services into measures of investment in own-account research and development (R&D) and in own-account software. BEA also improved its methods for deflating software, medical equipment, and communications equipment, and it harmonized the treatment of implicit services provided by savings banks and credit unions with the treatment of implicit services provided by commercial depository institutions. These improvements better align the NIPAs with the recommendations of international standards for compiling national and international economic accounts and maintain comparability with other nations’ accounts.1
Comprehensive updates also provide BEA with an opportunity to introduce entirely new measures. This year, BEA introduced measures of gross domestic product (GDP), gross domestic income (GDI), and their major components that are not seasonally adjusted. These measures facilitate analyses of seasonal adjustment methods by distinguishing movements that are attributable to underlying source data from those that are attributable to seasonal adjustment. BEA also introduced improved seasonally adjusted statistics for several NIPA series for which residual seasonality—that is, the presence of a seasonal pattern after adjustment for seasonality—had been detected. These included estimates of federal compensation for 1978 forward, estimates of federal consumption expenditures and gross investment for 1972 forward, and estimates of services exports for 1959–1971. For other series, improvements to seasonal adjustment that had been introduced in recent annual updates of the NIPAs were carried back to earlier years.2
With the exception of new data products, improvements to BEA’s accounts are implemented through changes in definitions, methodologies, and source data. To facilitate analyses of the effects of these changes, BEA classifies these changes as either definitional changes (those that involve a change in concepts or accounting treatments) or statistical changes (those that involve improvements in the sources or methods underlying the accounts, including the incorporation of newly available or revised source data). Most of the improvements to the NIPAs this year were previewed in an April article in the Survey of Current Business.3
The major changes include the following:
- Recognized the value of capital services in measures of own-account investment in software and in R&D beginning with 2007, bringing these measures into greater alignment with economic theory
- Reclassified R&D for software from private fixed investment in software to private fixed investment in R&D beginning with 1987, resolving an inconsistency between the NIPA measures of R&D and the source data underlying the NIPA measures
- Reclassified payments by the Federal Reserve banks to the U.S. government as dividend payments, rather than as corporate tax payments, improving the consistency of the NIPAs with international guidelines and the practices of other countries
- Reclassified selected state and local taxes as “other” taxes on production, rather than as personal taxes, beginning with 2007, bringing the NIPAs into closer alignment with BEA’s supply-use tables
- Improved seasonally adjusted measures to address residual seasonality
- Improved price indexes for software, medical equipment, and communications equipment, and extended improvements that were introduced in prior updates to earlier years
- Improved the measurement of the implicit financial output provided by savings banks and credit unions using the same “reference rate” approach that is used for measuring the implicit services provided by commercial banks, established a new treatment of borrower defaults and refined the computation of the reference rate
- Harmonized the measurement of state and local defined benefit pension plans with the measurement of federal defined benefit pension plans, for 1929–2017
- Updated the presentation of government structures for 1929–1996 to make them consistent with the measures beginning with 1997, using a single classification system that categorizes construction projects by function rather than by building type
- Updated the reference year (to 2012 from 2009) for chain-type quantity and price indexes and for chained-dollar estimates
The revised estimates also reflect the incorporation of newly available and revised source data, notably the incorporation of BEA’s 2012 benchmark input-output (I-O) accounts.4 These accounts, which provide the most thorough and detailed information on the structure of the U.S. economy, are used to benchmark the expenditure components of GDP.
In general, the picture of the economy shown by the revised estimates is similar to the picture shown by the previously published estimates. The similarity and some of the differences can be seen in the following:
- The long-run growth rates of real GDP are similar to those in the previously published estimates. For 1929–2017, the average annual growth rate of real GDP is 3.2 percent, the same as in the previously published estimates. For 2007–2017, the growth rate is 1.5 percent, 0.1 percentage point higher than in previously published estimates. For 2012–2017, the growth rate is 2.2 percent, the same as in previously published estimates.
- The highest upward revision to the year-to-year percent change in real GDP is 0.3 percentage point for 2013; for 2005, 2006, and 2008, real GDP was revised up by 0.2 percentage point. Real GDP was unrevised for 2015, revised up 0.1 percentage point for 2016, and revised down –0.1 percentage point for 2017. Downward revisions to real GDP do not exceed –0.1 percentage point in any year (table 1).
- The most recent recession was less steep than previously estimated. From the fourth quarter of 2007 to the second quarter of 2009, real GDP decreased 2.7 percent at an average annual rate; in the previously published estimates, it had decreased 2.8 percent.
- Real GDP increased at an average annual rate of 2.2 percent, unrevised from the previously published estimates, for the current period of expansion from the second quarter of 2009 through the first quarter of 2018.
- The average rate of change in the prices paid by U.S. residents for 2007–2017 was revised down to 1.4 percent from 1.5 percent. For 2012–2017, the average rate of change was revised down to 1.2 percent from 1.3 percent.
- Personal saving was revised up for most years, and the personal saving rate—personal saving as a percentage of disposable personal income (DPI)—was revised up for all but one year (it was unrevised for 2009), mostly reflecting downward revisions to personal spending and, in many years, upward revisions to personal income (table 2). For 2007–2017, the personal saving rate averaged 6.6 percent; in the previously published estimates, it averaged 5.3 percent.
| Year | Revised | Previously published |
Revision |
|---|---|---|---|
| 1930 | −8.5 | −8.5 | 0.0 |
| 1931 | −6.4 | −6.4 | 0.0 |
| 1932 | −12.9 | −12.9 | 0.0 |
| 1933 | −1.2 | −1.3 | 0.1 |
| 1934 | 10.8 | 10.8 | 0.0 |
| 1935 | 8.9 | 8.9 | 0.0 |
| 1936 | 12.9 | 12.9 | 0.0 |
| 1937 | 5.1 | 5.1 | 0.0 |
| 1938 | −3.3 | −3.3 | 0.0 |
| 1939 | 8.0 | 8.0 | 0.0 |
| 1940 | 8.8 | 8.8 | 0.0 |
| 1941 | 17.7 | 17.7 | 0.0 |
| 1942 | 18.9 | 18.9 | 0.0 |
| 1943 | 17.0 | 17.0 | 0.0 |
| 1944 | 8.0 | 8.0 | 0.0 |
| 1945 | −1.0 | −1.0 | 0.0 |
| 1946 | −11.6 | −11.6 | 0.0 |
| 1947 | −1.1 | −1.1 | 0.0 |
| 1948 | 4.1 | 4.1 | 0.0 |
| 1949 | −0.6 | −0.5 | −0.1 |
| 1950 | 8.7 | 8.7 | 0.0 |
| 1951 | 8.0 | 8.1 | −0.1 |
| 1952 | 4.1 | 4.1 | 0.0 |
| 1953 | 4.7 | 4.7 | 0.0 |
| 1954 | −0.6 | −0.6 | 0.0 |
| 1955 | 7.1 | 7.1 | 0.0 |
| 1956 | 2.1 | 2.1 | 0.0 |
| 1957 | 2.1 | 2.1 | 0.0 |
| 1958 | −0.7 | −0.7 | 0.0 |
| 1959 | 6.9 | 6.9 | 0.0 |
| 1960 | 2.6 | 2.6 | 0.0 |
| 1961 | 2.6 | 2.6 | 0.0 |
| 1962 | 6.1 | 6.1 | 0.0 |
| 1963 | 4.4 | 4.4 | 0.0 |
| 1964 | 5.8 | 5.8 | 0.0 |
| 1965 | 6.5 | 6.5 | 0.0 |
| 1966 | 6.6 | 6.6 | 0.0 |
| 1967 | 2.7 | 2.7 | 0.0 |
| 1968 | 4.9 | 4.9 | 0.0 |
| 1969 | 3.1 | 3.1 | 0.0 |
| 1970 | 0.2 | 0.2 | 0.0 |
| 1971 | 3.3 | 3.3 | 0.0 |
| 1972 | 5.3 | 5.2 | 0.1 |
| 1973 | 5.6 | 5.6 | 0.0 |
| 1974 | −0.5 | −0.5 | 0.0 |
| 1975 | −0.2 | −0.2 | 0.0 |
| 1976 | 5.4 | 5.4 | 0.0 |
| 1977 | 4.6 | 4.6 | 0.0 |
| 1978 | 5.5 | 5.6 | −0.1 |
| 1979 | 3.2 | 3.2 | 0.0 |
| 1980 | −0.3 | −0.2 | −0.1 |
| 1981 | 2.5 | 2.6 | −0.1 |
| 1982 | −1.8 | −1.9 | 0.1 |
| 1983 | 4.6 | 4.6 | 0.0 |
| 1984 | 7.2 | 7.3 | −0.1 |
| 1985 | 4.2 | 4.2 | 0.0 |
| 1986 | 3.5 | 3.5 | 0.0 |
| 1987 | 3.5 | 3.5 | 0.0 |
| 1988 | 4.2 | 4.2 | 0.0 |
| 1989 | 3.7 | 3.7 | 0.0 |
| 1990 | 1.9 | 1.9 | 0.0 |
| 1991 | −0.1 | −0.1 | 0.0 |
| 1992 | 3.5 | 3.6 | −0.1 |
| 1993 | 2.8 | 2.7 | 0.1 |
| 1994 | 4.0 | 4.0 | 0.0 |
| 1995 | 2.7 | 2.7 | 0.0 |
| 1996 | 3.8 | 3.8 | 0.0 |
| 1997 | 4.4 | 4.5 | −0.1 |
| 1998 | 4.5 | 4.5 | 0.0 |
| 1999 | 4.8 | 4.7 | 0.1 |
| 2000 | 4.1 | 4.1 | 0.0 |
| 2001 | 1.0 | 1.0 | 0.0 |
| 2002 | 1.7 | 1.8 | −0.1 |
| 2003 | 2.9 | 2.8 | 0.1 |
| 2004 | 3.8 | 3.8 | 0.0 |
| 2005 | 3.5 | 3.3 | 0.2 |
| 2006 | 2.9 | 2.7 | 0.2 |
| 2007 | 1.9 | 1.8 | 0.1 |
| 2008 | −0.1 | −0.3 | 0.2 |
| 2009 | −2.5 | −2.8 | 0.3 |
| 2010 | 2.6 | 2.5 | 0.1 |
| 2011 | 1.6 | 1.6 | 0.0 |
| 2012 | 2.2 | 2.2 | 0.0 |
| 2013 | 1.8 | 1.7 | 0.1 |
| 2014 | 2.5 | 2.6 | −0.1 |
| 2015 | 2.9 | 2.9 | 0 |
| 2016 | 1.6 | 1.5 | 0.1 |
| 2017 | 2.2 | 2.3 | −0.1 |
| Year | Personal saving rate | National saving rate | ||||
|---|---|---|---|---|---|---|
| Revised | Previously published |
Revision | Revised | Previously published |
Revision | |
| 1970 | 12.8 | 12.6 | 0.2 | 21.2 | 21.2 | 0.0 |
| 1971 | 13.5 | 13.3 | 0.2 | 21.2 | 21.1 | 0.1 |
| 1972 | 12.4 | 12.1 | 0.3 | 21.7 | 21.6 | 0.1 |
| 1973 | 13.5 | 13.1 | 0.4 | 23.4 | 23.4 | 0.0 |
| 1974 | 13.3 | 12.9 | 0.4 | 22.5 | 22.4 | 0.1 |
| 1975 | 13.4 | 13.0 | 0.4 | 20.7 | 20.6 | 0.1 |
| 1976 | 11.6 | 11.1 | 0.5 | 21.4 | 21.3 | 0.1 |
| 1977 | 10.7 | 10.2 | 0.5 | 22.1 | 22.0 | 0.1 |
| 1978 | 10.7 | 10.2 | 0.5 | 23.3 | 23.3 | 0.0 |
| 1979 | 10.3 | 9.8 | 0.5 | 23.5 | 23.4 | 0.1 |
| 1980 | 11.1 | 10.6 | 0.5 | 22.1 | 22.1 | 0.0 |
| 1981 | 11.8 | 11.2 | 0.6 | 23.2 | 23.2 | 0.0 |
| 1982 | 12.0 | 11.5 | 0.5 | 21.5 | 21.6 | −0.1 |
| 1983 | 10.0 | 9.4 | 0.6 | 19.8 | 19.9 | −0.1 |
| 1984 | 11.3 | 10.7 | 0.6 | 21.9 | 21.9 | 0.0 |
| 1985 | 9.2 | 8.6 | 0.6 | 20.4 | 20.5 | −0.1 |
| 1986 | 8.8 | 8.2 | 0.6 | 19.1 | 19.2 | −0.1 |
| 1987 | 7.9 | 7.3 | 0.6 | 19.7 | 19.6 | 0.1 |
| 1988 | 8.5 | 7.8 | 0.7 | 20.5 | 20.5 | 0.0 |
| 1989 | 8.4 | 7.8 | 0.6 | 19.8 | 19.8 | 0.0 |
| 1990 | 8.4 | 7.8 | 0.6 | 18.9 | 18.9 | 0.0 |
| 1991 | 8.8 | 8.2 | 0.6 | 18.9 | 18.9 | 0.0 |
| 1992 | 9.4 | 8.9 | 0.5 | 17.8 | 17.8 | 0.0 |
| 1993 | 7.9 | 7.4 | 0.5 | 17.3 | 17.3 | 0.0 |
| 1994 | 6.9 | 6.3 | 0.6 | 18.1 | 18.1 | 0.0 |
| 1995 | 7.0 | 6.4 | 0.6 | 18.8 | 18.8 | 0.0 |
| 1996 | 6.5 | 5.9 | 0.6 | 19.6 | 19.6 | 0.0 |
| 1997 | 6.3 | 5.7 | 0.6 | 20.7 | 20.7 | 0.0 |
| 1998 | 6.8 | 6.2 | 0.6 | 21.1 | 21.1 | 0.0 |
| 1999 | 5.1 | 4.4 | 0.7 | 20.7 | 20.6 | 0.1 |
| 2000 | 4.8 | 4.2 | 0.6 | 20.5 | 20.3 | 0.2 |
| 2001 | 5.0 | 4.3 | 0.7 | 19.3 | 19.2 | 0.1 |
| 2002 | 5.8 | 5.0 | 0.8 | 18.1 | 17.9 | 0.2 |
| 2003 | 5.6 | 4.8 | 0.8 | 17.3 | 17.2 | 0.1 |
| 2004 | 5.2 | 4.5 | 0.7 | 17.6 | 17.4 | 0.2 |
| 2005 | 3.2 | 2.6 | 0.6 | 18.0 | 17.7 | 0.3 |
| 2006 | 3.8 | 3.3 | 0.5 | 18.9 | 18.7 | 0.2 |
| 2007 | 3.7 | 2.9 | 0.8 | 17.4 | 17.1 | 0.3 |
| 2008 | 5.0 | 4.9 | 0.1 | 15.3 | 15.3 | 0.0 |
| 2009 | 6.1 | 6.1 | 0.0 | 13.9 | 14.3 | −0.4 |
| 2010 | 6.5 | 5.6 | 0.9 | 15.3 | 14.9 | 0.4 |
| 2011 | 7.2 | 6.0 | 1.2 | 16.1 | 15.4 | 0.7 |
| 2012 | 8.9 | 7.6 | 1.3 | 18.2 | 17.2 | 1.0 |
| 2013 | 6.4 | 5 | 1.4 | 18.7 | 17.9 | 0.8 |
| 2014 | 7.3 | 5.7 | 1.6 | 19.7 | 18.8 | 0.9 |
| 2015 | 7.6 | 6.1 | 1.5 | 19.6 | 18.9 | 0.7 |
| 2016 | 6.7 | 4.9 | 1.8 | 18.3 | 17.7 | 0.6 |
| 2017 | 6.7 | 3.4 | 3.3 | 18.5 | 17.2 | 1.3 |
This article discusses the revisions that are attributable to the various definitional and statistical changes for each of the major NIPA aggregates and their components. Specifically, it discusses:
- Revisions to the annual current-dollar estimates
- Revisions to the annual estimates of real GDP and of prices
- Revisions to the quarterly estimates of real GDP
Revisions to current dollar measures reflect the definitional and statistical changes, including the incorporation of newly available or revised source data, introduced in this comprehensive update. In the aggregate, statistical changes had larger effects on GDP and GDI than definitional changes (table 3). The definitional changes affected GDP and GDI equally, while the effects of statistical changes vary (table 3).
| 1946 | 1987 | 2007 | 2012 | 2013 | 2014 | 2015 | 2016 | 2017 | |
|---|---|---|---|---|---|---|---|---|---|
| Gross domestic product | −0.3 | −15.0 | −25.8 | 41.8 | 93.3 | 94.1 | 98.6 | 82.7 | 94.8 |
| Definitional | 0.0 | 0.0 | 0.3 | 12.8 | 13.9 | 13.8 | 14.9 | 15.9 | 16.6 |
| Introduction of capital services into own-account investment | 0.0 | 0.0 | 0.0 | 11.2 | 11.9 | 12.4 | 13.2 | 13.8 | 14.4 |
| Reclassification of software research and development (R&D) | 0.0 | 0.0 | 0.0 | 0.0 | 0.0 | 0.0 | 0.0 | 0.0 | 0.0 |
| Reclassification of selected state taxes from personal taxes to taxes on production and imports | 0.0 | 0.0 | 0.3 | 1.6 | 2.0 | 1.4 | 1.7 | 2.1 | 2.2 |
| Statistical | −0.3 | −15.0 | −26.1 | 29.0 | 79.4 | 80.4 | 83.7 | 66.9 | 78.1 |
| Improved measures of the implicit services of savings institutions and credit unions | −0.1 | −15.8 | −29.8 | −28.8 | −37.0 | −44.5 | −47.6 | −60.5 | −63.5 |
| Measures of state and local defined benefit pension plans | −0.1 | −1.8 | −19.8 | −34.7 | −37.0 | −37.8 | −38.1 | −40.7 | −41.0 |
| Other statistical | −0.1 | 2.6 | 23.5 | 92.4 | 153.4 | 162.7 | 169.4 | 168.1 | 182.6 |
| Gross domestic income | −0.3 | −18.3 | −26.0 | 79.8 | 115.7 | 163.2 | 97.6 | 62.5 | 200.8 |
| Definitional | 0.0 | 0.0 | 0.3 | 12.8 | 13.9 | 13.8 | 14.9 | 15.9 | 16.6 |
| Introduction of capital services into own-account investment | 0.0 | 0.0 | 0.0 | 11.2 | 11.9 | 12.4 | 13.2 | 13.8 | 14.4 |
| Reclassification of software R&D | 0.0 | 0.0 | 0.0 | 0.0 | 0.0 | 0.0 | 0.0 | 0.0 | 0.0 |
| Reclassification of selected state taxes from personal taxes to taxes on production and imports | 0.0 | 0.0 | 0.3 | 1.6 | 2.0 | 1.4 | 1.7 | 2.1 | 2.2 |
| Statistical | −0.3 | −18.3 | −26.3 | 67.0 | 101.8 | 149.4 | 82.7 | 46.6 | 184.2 |
| Misreporting adjustment1 | 0.0 | 0.0 | 16.4 | 98.3 | 98.6 | 107.8 | 90.3 | … | … |
| Improved measures of the implicit services of savings institutions and credit unions | −0.1 | −15.8 | −28.5 | −26.9 | −31.2 | −34.2 | −33.6 | −38.8 | −38.4 |
| Measures of state and local defined benefit pension plans | −0.1 | −1.8 | −19.8 | −34.7 | −37.0 | −37.8 | −38.1 | −40.7 | −41.0 |
| Other statistical | −0.1 | −0.7 | 5.5 | 30.3 | 71.3 | 113.6 | 64.0 | 126.1 | 263.6 |
| National income | −0.2 | −20.7 | −31.0 | 32.8 | 49.9 | 101.4 | 43.4 | 6.9 | 146.2 |
| Definitional | 0.0 | 0.0 | 8.8 | 17.7 | 17.8 | 16.8 | 17.3 | 18.0 | 18.3 |
| Introduction of capital services into own-account investment | 0.0 | 0.0 | 0.0 | 6.3 | 5.5 | 4.7 | 4.3 | 3.9 | 3.5 |
| Reclassification of software R&D | 0.0 | 0.0 | 8.5 | 9.8 | 10.3 | 10.7 | 11.3 | 12.0 | 12.6 |
| Reclassification of selected state taxes from personal taxes to taxes on production and imports | 0.0 | 0.0 | 0.3 | 1.6 | 2.0 | 1.4 | 1.7 | 2.1 | 2.2 |
| Statistical | −0.2 | −20.7 | −39.8 | 15.1 | 32.1 | 84.6 | 26.1 | −11.1 | 127.9 |
| Misreporting adjustment1 | 0.0 | 0.0 | 16.4 | 98.3 | 98.6 | 107.8 | 90.3 | … | … |
| Improved measures of the implicit services of savings institutions and credit unions | −0.1 | −15.8 | −28.5 | −26.9 | −31.2 | −34.2 | −33.6 | −38.8 | −38.4 |
| Measures of state and local defined benefit pension plans | −0.1 | −1.8 | −19.8 | −34.7 | −37.0 | −37.8 | −38.1 | −40.7 | −41.0 |
| Other statistical | 0.0 | −3.1 | −8.0 | −21.7 | 1.7 | 48.8 | 7.4 | 68.5 | 207.3 |
| Personal income | −0.1 | 5.7 | 7.6 | 95.0 | 107.4 | 173.6 | 166.6 | 196.4 | 401.9 |
| Definitional | 0.0 | 0.0 | 0.8 | 1.6 | 1.6 | 1.6 | 1.5 | 1.6 | 1.7 |
| Introduction of capital services into own-account investment | 0.0 | 0.0 | 0.0 | 0.6 | 0.6 | 0.5 | 0.4 | 0.4 | 0.4 |
| Reclassification of software R&D | 0.0 | 0.0 | 0.8 | 1.0 | 1.0 | 1.1 | 1.1 | 1.2 | 1.3 |
| Statistical | −0.1 | 5.7 | 6.8 | 93.4 | 105.8 | 172.0 | 165.1 | 194.8 | 400.2 |
| Misreporting adjustment2 | 0.0 | 0.0 | 16.4 | 98.3 | 98.6 | 107.8 | 90.3 | −4.1 | … |
| Improved measures of the implicit services of savings institutions and credit unions | −0.1 | −17.6 | −33.3 | −42.2 | −36.5 | −40.0 | −41.1 | −46.9 | −52.2 |
| Measures of state and local defined benefit pension plans | 0.0 | 26.5 | 47.4 | 37.5 | 37.8 | 38.9 | 39.4 | 36.8 | 39.0 |
| Other statistical | 0.0 | −3.3 | −23.7 | −0.2 | 5.9 | 65.3 | 76.4 | 209.0 | 413.3 |
- Impacts of revised estimates of misreporting adjustment for 2016–2017 cannot be distinguished.
- Impact of revised estimate of misreporting adjustment for 2017 cannot be distinguished.
GDP. The revisions to the level of current-dollar GDP are downward for most of the revision period but are upward for 2009 through 2017. The downward revisions are less than $10 billion until 1986; the largest downward revision, more than $61 billion, or 0.5 percent of the previously published estimate, is for 2004. The largest upward revision, more than $98 billion, is for 2015. In the aggregate, statistical changes (improved source data and methodologies) had a greater effect on GDP than definitional changes throughout the revision period (chart 1); definitional changes had upward effects starting with 2007, increasing to a peak of over $16 billion in 2017.

[Click chart to expand]
The definitional change with the greatest effect on GDP is the introduction of capital services into own-account investment in software and in R&D, which led to upward revisions ranging from about $2 billion for 2008 to over $14 billion for 2017. The incorporation of revised and newly available source data was the most significant statistical change in recent years, leading to revisions that exceeded $182 billion for 2017. In years prior to 2009, the downward effects from the use of (1) the reference rate approach for credit unions and savings banks and (2) the projected benefit obligation (PBO) method, rather than the accumulated benefit obligation (ABO) method, for measures of state and local defined benefit pension plans more than offset the upward effects of source data.
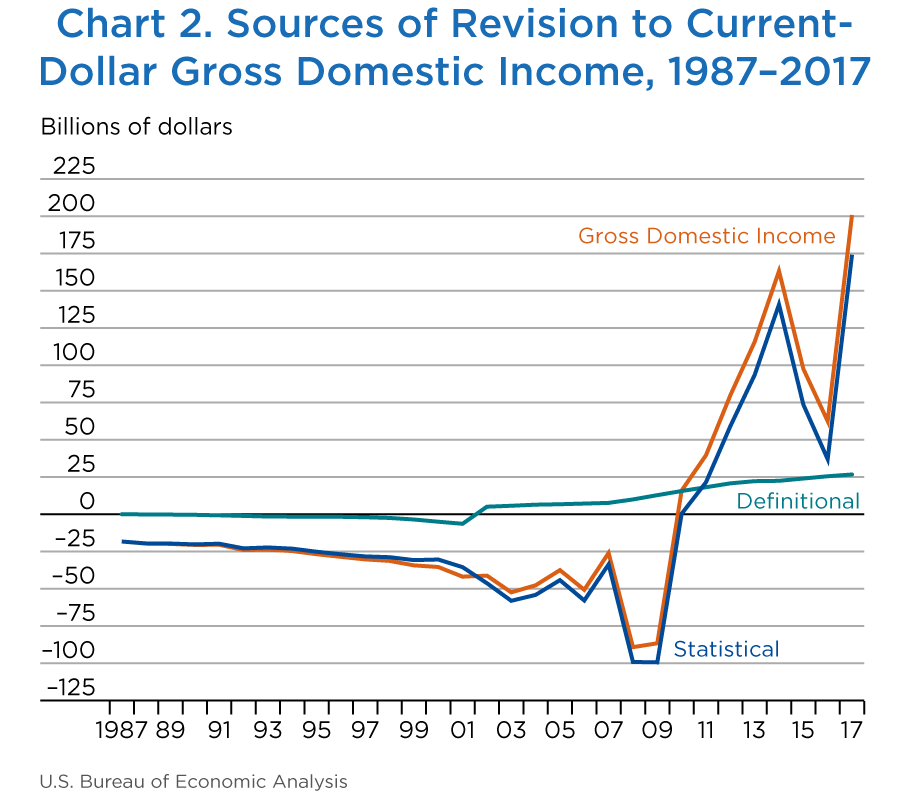
GDI. Revisions to GDI are generally downward and less than $10 billion until 1985. For 1985–2009, the revisions are downward and larger; the largest downward revision is about $89 billion for 2008. The revisions are upward for 2010 through 2017; the largest upward revision, more than $200 billion, was for 2017. The dollar effect of the definitional changes on the level of GDI is the same as the effect on GDP (chart 2). For most years through 2009, the downward revisions to GDI are mostly due to the downward effects of statistical changes.
The use of the PBO method, rather than the ABO method, for measuring employees’ claims to benefits and the pension liabilities of state and local defined benefit pension plans reduced GDI and is a significant source of revision to GDI throughout the period; its effects on GDP and GDI are the same. The introduction of the reference rate approach for measures of the implicit output of savings banks and credit unions also reduced GDI, as it had downward effects on businesses’ net operating surplus (specifically, net interest payments); the approach is important starting with 1946. Revised estimates of misreporting, along with the effects of other statistical changes, including the incorporation of newly available and revised source data, more than offset the downward effects of the reference rate approach and PBO method for 2011–2017.
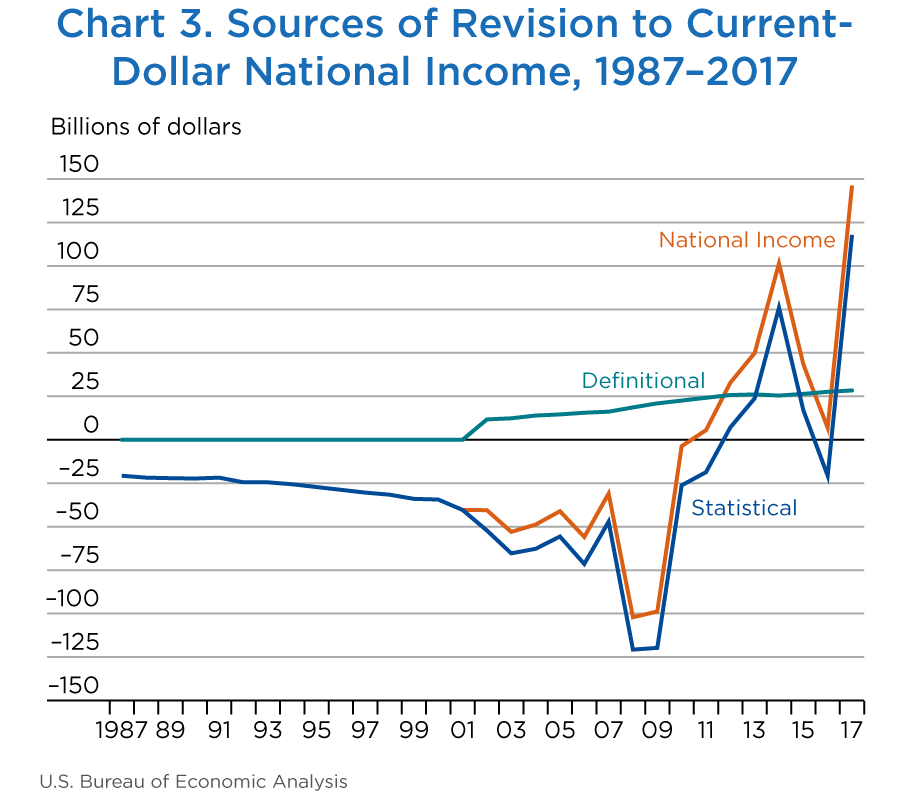
National income. The revisions to national income vary in both direction and magnitude over time. Revisions are downward and less than $10 billion until 1984; for 1984–2010 the downward revisions are generally increasing and peak at just over –$100 billion in 2008. For 2011–2017, revisions are upward and range from about $5 billion to over $146 billion.
The effects of several revisions to national income are the same as those for GDI, and as with GDI, statistical changes had more bearing on the revisions than definitional changes (chart 3). The effects on national income of the introduction of capital services and the reclassification of R&D for software from private fixed investment in software to private fixed investment in R&D differ from the effects on GDI, however. The introduction of capital services had lesser effects on national income than on GDI because national income excludes the consumption of fixed capital (CFC); the effects of this change on CFC supplements the effects on other components of GDI. There are no net effects on GDI of the reclassification of R&D for software because the effects of this change on CFC offsets the effects of the change on other income components. As CFC is excluded from national income, this offset does not occur, and the reclassification of R&D for software had upward effects.
[Click chart to expand]
[Click chart to expand]
Personal income. The revisions to personal income are mostly upward and less than $5 billion until 1980; for 1981–2007, the revisions are upward and range from about $5 billion to about $15 billion; for 2008–2009, revisions are downward and large. The largest downward revision is over $60 billion for 2008. For 2010–2017 the revisions are upward and large; the largest upward revision, more than $400 billion, is for 2017.
As with other aggregates, the effect of statistical changes exceeds that of definitional changes (chart 4); this is more pronounced for personal income, which is less affected by the introduction of capital services and the reclassification of R&D for software. (Personal income is affected by these changes only through proprietors’ income, while GDI is affected through both proprietors’ income and profits as well as CFC).
Additional detail on GDP, GDI, and other NIPA aggregates and their major components is presented below. The accompanying tables show the revisions for 1946, 1987, 2007, and 2012–2017 as allocated among changes in definition and statistical improvements. Appendix A presents the seven summary accounts of the NIPAs for 2017. Appendix B presents the revised current-dollar estimates for 2012 and 2017, shows the revisions in level for 2012–2017, and summarizes the major source data incorporated and the sources of revision for selected detailed components.

[Click chart to expand]
The remainder of this section is organized according to the seven-account framework for the NIPAs:
- Domestic income and product, account 1, shows the consolidated production of all sectors of the economy as the sum of goods and services sold to final users and as the sum of incomes generated by the production of those goods and services.
- Private enterprise income, account 2, provides additional information on the sources and uses of income by private enterprises.
- Personal income and outlays, account 3, shows the sources and uses of income of individuals, enterprises that are owned by households, and nonprofit institutions that serve households.
- Government current receipts and expenditures, account 4, shows the receipts and uses of income for federal, state, and local governments (including government enterprises).
- Foreign transactions current account, account 5, summarizes all the current transactions of the United States with the rest of the world. The foreign transactions capital account, account 7, shows capital-account transactions with the rest of the world.
- Domestic capital, account 6, shows the relationship between saving and investment in the U.S. economy.
Domestic income and product (account 1)
GDP. The revisions to GDP are downward until 2009 and are less than $10 billion until 1986; the largest downward revision, about $61 billion, is for 2004. For 2009–2017, revisions to GDP are upward and exceed $10 billion (the largest revision, over $98 billion, is for 2015 (table 3).
The introduction of the reference rate approach for measuring the implicit output of savings institutions and credit unions, beginning with 1946, had downward effects on GDP, as the new method reduced the value of final expenditures for these services. The use of the PBO method for measures of state and local defined benefit pension plans also had downward effects on GDP for the entire period, as the change reduced the compensation costs of state and local governments, which are treated as government consumption expenditures in the NIPAs. Other statistical changes, including the incorporation of newly available and revised source data in the components of GDP, had upward effects for much of the revision span and more than offset the effects of these two changes in recent years. Statistical changes had their greatest effect in 2015, increasing GDP by about $85 billion.
GDI and the statistical discrepancy. Through 2009, revisions to GDI are generally downward; for 2010–2017, the revisions are upward and vary in size. The largest downward revision, over $89 billion, is for 2008; the largest upward revision, over $200 billion, is for 2017. Throughout the period, the revisions primarily reflect the effects of the statistical changes.
For 1929–2003, the statistical discrepancy—GDP less GDI—is revised by less than $10 billion in absolute value.5 Through 2007, both GDP and GDI are revised down; for 2004–2005, downward revisions to GDP are greater than downward revisions to GDI, and revisions to the statistical discrepancy are downward (and range from about $13 billion to about $20 billion). For 2009, GDP is revised up and GDI is revised down; the upward revision to the statistical discrepancy for that year is the largest, over $116 billion. For 2010 and 2015–2016, GDP is revised up more than GDI and the statistical discrepancy is revised up. For 2011–2014 and for 2017, GDI is revised up more than GDP, and the statistical discrepancy is revised down. The largest downward revision to the discrepancy is over $100 billion for 2017. For 2007–2017, the revised estimates (without regard to sign) of the statistical discrepancy average 0.9 percent of GDP; the previously published estimates average 0.7 percent of GDP.
Product-side components
Personal consumption expenditures (PCE). Revisions to PCE are downward for all years. Revisions are less than $10 billion until 1986; the largest downward revision, about $74 billion, is for 2017.
For 1946–1996, revisions to total PCE are within services; afterward, revisions are to both goods and services. Revisions to services are downward until 2009; for 2009–2017, revisions to services are upward. The largest downward revisions to services, over $49 billion, are for 2004–2005 and 2007. The largest upward revision to services is almost $76 billion for 2015. Revisions to goods start with 1997; they are upward and less than $6 billion until 2008. For 2008–2017, revisions to goods are downward and range from about $12 billion to almost $140 billion (table 4).
| 1946 | 1987 | 2007 | 2012 | 2013 | 2014 | 2015 | 2016 | 2017 | |
|---|---|---|---|---|---|---|---|---|---|
| Total revision | −0.1 | −15.8 | −44.1 | −43.8 | −44.0 | −39.6 | −37.7 | −53.8 | −74.1 |
| Definitional | 0.0 | 0.0 | 0.3 | 1.6 | 2.0 | 1.4 | 1.7 | 2.1 | 2.2 |
| Reclassification of selected state taxes from personal taxes to taxes on production and imports | 0.0 | 0.0 | 0.3 | 1.6 | 2.0 | 1.4 | 1.7 | 2.1 | 2.2 |
| Statistical | −0.1 | −15.8 | −44.4 | −45.4 | −46.0 | −41.0 | −39.4 | −55.9 | −76.3 |
| Improved measures of the implicit services of savings institutions and credit unions | −0.1 | −15.8 | −31.3 | −31.3 | −38.6 | −45.9 | −48.6 | −61.0 | −64.6 |
| Other statistical | 0.0 | 0.0 | −13.1 | −14.1 | −7.5 | 4.9 | 9.2 | 5.2 | −11.7 |
| Goods | 0.0 | 0.0 | 5.5 | −101.3 | −104.5 | −108.9 | −113.5 | −125.1 | −139.2 |
| Durable goods | 0.0 | 0.0 | 3.4 | −47.6 | −52.3 | −54.0 | −60.6 | −64.4 | −67.3 |
| Nondurable goods | 0.0 | 0.0 | 2.0 | −53.7 | −52.3 | −54.9 | −52.9 | −60.7 | −71.9 |
| Services | −0.1 | −15.8 | −49.5 | 57.5 | 60.6 | 69.3 | 75.8 | 71.3 | 65.1 |
| Definitional | 0.0 | 0.0 | 0.0 | 0.0 | 0.0 | 0.0 | 0.0 | 0.0 | 0.0 |
| Statistical | −0.1 | −15.8 | −49.5 | 57.5 | 60.6 | 69.3 | 75.8 | 71.3 | 65.1 |
| Improved measures of the implicit services of savings institutions and credit unions | −0.1 | −15.8 | −31.3 | −31.3 | −38.6 | −45.9 | −48.6 | −61.0 | −64.6 |
| Other statistical | 0.0 | 0.0 | −18.2 | 88.8 | 99.2 | 115.2 | 124.4 | 132.3 | 129.7 |
Until 1993, the revisions to PCE exclusively reflect the revised measures of the implicit output of savings banks and credit unions. Starting with 1993, revisions reflect both these downward effects and the effects of incorporating revised and newly available source data, including newly available product line data from the 2012 benchmark I-O accounts and updated adjustments to foreign travel data from the International Transactions Accounts (ITAs). For 2007–2017, the revisions also reflect small upward effects from the reclassification of selected state and local taxes from personal taxes to taxes on production and imports; these effects are less than $3 billion. Revised and newly available source data for personal spending include BEA’s 2012 benchmark I-O accounts; tabulations of Census Bureau data from the Service Annual Survey (SAS), the Annual Retail Trade Survey (ARTS), the Monthly Retail Trade Survey (for 2017), the Current Population Survey, the Housing Vacancy Survey, and the American Housing Survey; retail scanner and other trade source data; Census E-Commerce report data; the Bureau of Labor Statistics (BLS) Consumer Expenditure Survey data; and data from the Energy Information Administration.
Private fixed investment. Revisions to total private fixed investment are upward and less than $5 billion until 2001; the largest upward revision, more than $145 billion, is for 2017. For 1998 forward, the revisions are primarily due to revisions to nonresidential investment in structures, equipment, and intellectual property products. For 2009–2016, the upward revisions to nonresidential investment are slightly offset by small downward revisions to residential investment in structures (table 5).
| 1946 | 1987 | 2007 | 2012 | 2013 | 2014 | 2015 | 2016 | 2017 | |
|---|---|---|---|---|---|---|---|---|---|
| Total revision | 0.0 | 0.0 | 29.3 | 110.1 | 119.7 | 122.5 | 118.4 | 112.7 | 155.1 |
| Definitional | 0.0 | 0.0 | 0.0 | 11.2 | 11.9 | 12.4 | 13.2 | 13.8 | 14.4 |
| Introduction of capital services into own-account investment | 0.0 | 0.0 | 0.0 | 11.2 | 11.9 | 12.4 | 13.2 | 13.8 | 14.4 |
| Reclassification of software research and development (R&D) | 0.0 | 0.0 | 0.0 | 0.0 | 0.0 | 0.0 | 0.0 | 0.0 | 0.0 |
| Statistical | 0.0 | 0.0 | 29.3 | 98.9 | 107.8 | 110.1 | 105.2 | 98.9 | 140.7 |
| Private fixed investment | 0.0 | 0.0 | 29.8 | 100.6 | 107.6 | 116.0 | 101.6 | 118.8 | 145.3 |
| Nonresidential | 0.0 | 0.0 | 27.9 | 110.9 | 117.1 | 126.0 | 113.4 | 125.8 | 138.3 |
| Structures | 0.0 | 0.0 | 13.4 | 31.4 | 28.9 | 39.6 | 34.7 | 29.5 | 25.3 |
| Definitional | 0.0 | 0.0 | 0.0 | 0.0 | 0.0 | 0.0 | 0.0 | 0.0 | 0.0 |
| Statistical | 0.0 | 0.0 | 13.4 | 31.4 | 28.9 | 39.6 | 34.7 | 29.5 | 25.3 |
| Equipment | 0.0 | 0.0 | 7.7 | 45.5 | 44.2 | 44.3 | 36.4 | 47.0 | 52.0 |
| Definitional | 0.0 | 0.0 | 0.0 | 0.0 | 0.0 | 0.0 | 0.0 | 0.0 | 0.0 |
| Statistical | 0.0 | 0.0 | 7.7 | 45.5 | 44.2 | 44.3 | 36.4 | 47.0 | 52.0 |
| Intellectual property products | 0.0 | 0.0 | 6.9 | 34.0 | 44.0 | 42.1 | 42.3 | 49.4 | 61.0 |
| Definitional | 0.0 | 0.0 | 0.0 | 11.2 | 11.9 | 12.4 | 13.2 | 13.8 | 14.4 |
| Introduction of capital services into own-account investment | 0.0 | 0.0 | 0.0 | 11.2 | 11.9 | 12.4 | 13.2 | 13.8 | 14.4 |
| Reclassification of software R&D | 0.0 | 0.0 | 0.0 | 0.0 | 0.0 | 0.0 | 0.0 | 0.0 | 0.0 |
| Statistical | 0.0 | 0.0 | 6.9 | 22.8 | 32.1 | 29.7 | 29.1 | 35.6 | 46.6 |
| R&D | 0.0 | 0.0 | 44.7 | 50.5 | 59.5 | 65.3 | 70.3 | 78.0 | 83.3 |
| Definitional | 0.0 | 0.0 | 48.6 | 64.0 | 67.3 | 69.9 | 73.8 | 78.2 | 81.8 |
| Introduction of capital services into own-account investment | 0.0 | 0.0 | 0.0 | 8.0 | 8.6 | 8.9 | 9.4 | 9.8 | 10.2 |
| Reclassification of software R&D | 0.0 | 0.0 | 48.6 | 56.0 | 58.7 | 61.1 | 64.4 | 68.4 | 71.6 |
| Statistical | 0.0 | 0.0 | −3.9 | −13.5 | −7.8 | −4.6 | −3.5 | −0.2 | 1.5 |
| Entertainment originals | 0.0 | 0.0 | 0.0 | −4.3 | −4.6 | −3.6 | −2.7 | −3.3 | −4.5 |
| Definitional | 0.0 | 0.0 | 0.0 | 0.0 | 0.0 | 0.0 | 0.0 | 0.0 | 0.0 |
| Statistical | 0.0 | 0.0 | 0.0 | −4.3 | −4.6 | −3.6 | −2.7 | −3.3 | −4.5 |
| Software | 0.0 | 0.0 | −37.8 | −12.2 | −10.9 | −19.6 | −25.2 | −25.3 | −17.8 |
| Definitional | 0.0 | 0.0 | −48.6 | −52.8 | −55.4 | −57.5 | −60.6 | −64.4 | −67.4 |
| Introduction of capital services into own-account investment | 0.0 | 0.0 | 0.0 | 3.2 | 3.4 | 3.6 | 3.8 | 4.0 | 4.2 |
| Reclassification of software R&D | 0.0 | 0.0 | −48.6 | −56.0 | −58.7 | −61.1 | −64.4 | −68.4 | −71.6 |
| Statistical | 0.0 | 0.0 | 10.8 | 40.6 | 44.5 | 37.9 | 35.4 | 39.1 | 49.6 |
| Residential | 0.0 | 0.0 | 1.8 | −10.2 | −9.5 | −10.0 | −11.8 | −7.0 | 7.0 |
| Definitional | 0.0 | 0.0 | 0.0 | 0.0 | 0.0 | 0.0 | 0.0 | 0.0 | 0.0 |
| Statistical | 0.0 | 0.0 | 1.8 | −10.2 | −9.5 | −10.0 | −11.8 | −7.0 | 7.0 |
| Change in private inventories | 0.0 | 0.0 | −0.5 | 9.4 | 12.1 | 6.5 | 16.8 | −6.1 | 9.8 |
| Definitional | 0.0 | 0.0 | 0.0 | 0.0 | 0.0 | 0.0 | 0.0 | 0.0 | 0.0 |
| Statistical | 0.0 | 0.0 | −0.5 | 9.4 | 12.1 | 6.5 | 16.8 | −6.1 | 9.8 |
Nonresidential structures. Revisions exceed $5 billion starting with 2004 and are upward; the largest upward revision is for 2014, almost $40 billion. The revisions are entirely due to statistical changes—primarily the incorporation of data from the 2012 benchmark I-O accounts, revised data on petroleum footage drilled, and revised Census Bureau construction spending data.
Equipment. Revisions to private equipment exceed $5 billion starting with 2006; by 2008, revisions exceed $20 billion. The largest revision, $52 billion, is for 2017. The revisions entirely reflect statistical changes, including the incorporation of BEA’s 2012 benchmark I-O accounts and new and revised data from the Census Bureau, with notable effects on information processing equipment.
Intellectual property products. Revisions do not exceed $10 billion until 2008, although perfectly offsetting revisions to software and to R&D, resulting from the reclassification of R&D for software from private fixed investment in software to private fixed investment in R&D, start with 1988. Most years are revised up; the largest revision, $61 billion, is for 2017. For 2008–2017, the upward revisions reflect the introduction of capital services as well as the incorporation of newly available and revised source data, including BEA’s 2012 benchmark I-O accounts, Census SAS data, and new data from the National Science Foundation’s Business Research and Development Innovation Survey.
Residential fixed investment. Revisions are of mixed sign and less than $10 billion in absolute value until 2012. For 2012–2016, revisions are downward and larger, peaking at almost $12 billion in 2015. The largest upward revision, $7 billion, is for 2017. The revisions are entirely due to statistical changes, primarily reflecting the incorporation of data from the 2012 benchmark I-O accounts and new and revised Census Bureau construction spending data.
Change in private inventories. Revisions to the change in private inventories are of mixed sign; they exceed $5 billion in absolute value for most years in 2010–2017 and exceed $10 billion in only 2 years (2013 and 2016). The revisions for all years are entirely due to statistical changes and largely reflect the effect on nonfarm inventory investment of the incorporation of new and revised Census Bureau data on inventory valuation. Revisions to farm inventory investment are also of mixed sign; they are about $5 billion or less in absolute value for all years except 2017 (over −$7 billion). These revisions largely reflect revised U.S. Department of Agriculture (USDA) farm statistics for 2008–2017.
Net exports of goods and services. Revisions to net exports are entirely statistical and are of mixed sign; they are less than $3 billion in absolute value in each year except 2017 (almost −$7 billion) (table 6).
| 1946 | 1987 | 2007 | 2012 | 2013 | 2014 | 2015 | 2016 | 2017 | |
|---|---|---|---|---|---|---|---|---|---|
| Total revision | 0.0 | 0.0 | 0.1 | −2.9 | 1.2 | 1.3 | 2.6 | 0.7 | −6.9 |
| Definitional | 0.0 | 0.0 | 0.0 | 0.0 | 0.0 | 0.0 | 0.0 | 0.0 | 0.0 |
| Statistical | 0.0 | 0.0 | 0.1 | −2.9 | 1.2 | 1.3 | 2.6 | 0.7 | −6.9 |
| Improved measures of the implicit services of savings institutions and credit unions | 0.0 | 0.0 | 1.0 | 0.5 | 0.4 | 0.4 | 0.4 | 0.4 | 0.5 |
| Other statistical | 0.0 | 0.0 | −0.9 | −3.4 | 0.8 | 0.9 | 2.2 | 0.3 | −7.4 |
| Exports | 0.0 | 0.0 | −3.8 | −6.9 | −3.2 | −2.6 | 0.1 | 3.0 | 6.2 |
| Goods | 0.0 | 0.0 | −5.1 | −4.4 | −3.5 | −3.0 | −2.9 | −3.4 | −11.0 |
| Definitional | 0.0 | 0.0 | 0.0 | 0.0 | 0.0 | 0.0 | 0.0 | 0.0 | 0.0 |
| Statistical | 0.0 | 0.0 | −5.1 | −4.4 | −3.5 | −3.0 | −2.9 | −3.4 | −11.0 |
| Services | 0.0 | 0.0 | 1.4 | −2.5 | 0.3 | 0.4 | 3.0 | 6.4 | 17.1 |
| Definitional | 0.0 | 0.0 | 0.0 | 0.0 | 0.0 | 0.0 | 0.0 | 0.0 | 0.0 |
| Statistical | 0.0 | 0.0 | 1.4 | −2.5 | 0.3 | 0.4 | 3.0 | 6.4 | 17.1 |
| Improved measures of the implicit services of savings institutions and credit unions | 0.0 | 0.0 | 1.0 | 0.5 | 0.4 | 0.4 | 0.4 | 0.4 | 0.5 |
| Other statistical | 0.0 | 0.0 | 0.4 | −3.0 | −0.1 | 0.0 | 2.6 | 6.0 | 16.6 |
| Imports | 0.0 | 0.0 | −3.9 | −4.0 | −4.4 | −3.9 | −2.5 | 2.3 | 13.0 |
| Goods | 0.0 | 0.0 | −4.1 | −4.4 | −5.1 | −4.6 | −3.2 | −3.3 | −3.2 |
| Definitional | 0.0 | 0.0 | 0.0 | 0.0 | 0.0 | 0.0 | 0.0 | 0.0 | 0.0 |
| Statistical | 0.0 | 0.0 | −4.1 | −4.4 | −5.1 | 4.6 | −3.2 | −3.3 | −3.2 |
| Services | 0.0 | 0.0 | 0.2 | 0.4 | 0.7 | 0.7 | 0.7 | 5.6 | 16.3 |
| Definitional | 0.0 | 0.0 | 0.0 | 0.0 | 0.0 | 0.0 | 0.0 | 0.0 | 0.0 |
| Statistical | 0.0 | 0.0 | 0.2 | 0.4 | 0.7 | 0.7 | 0.7 | 5.6 | 16.3 |
For exports of goods and services, the revisions are downward and less than $10 billion; the largest downward revision, about $7 billion, is for 2012, and the largest upward revision, more than $6 billion, is for 2017. For imports of goods and services, the revisions are downward and less than $5 billion for all years except 2016–2017. For 2016–2017, revisions are upward. The largest downward revision is just under $5 billion for 2008; the largest upward revision, $13 billion, is for 2017.
Within both exports and imports, downward revisions to goods are less than $10 billion (with the exception of an $11 billion downward revision to goods exports in 2017) and outweigh upward revisions to services for most years until 2015 (for exports) and until 2016 (for imports). These downward revisions to exports and imports of goods are primarily due to revisions stemming from improvements to the territorial adjustment and to the incorporation of revised data from BEA’s ITAs.6 The upward revisions to exports of services are due to the introduction of the reference rate approach for measuring the implicit output of credit unions and savings banks; the upward revisions to imports of services are due to the incorporation of revised data from the ITAs.
For more information on the incorporation of revised ITA data, see the box “Discontinuities in the Estimates of Foreign Transactions in the National Income and Product Accounts” in the section on the Foreign Transactions Current Account.
Government consumption expenditures and gross investment. Revisions to aggregate government consumption and investment are less than $5 billion until 1997. With the exception of several upward revisions of less than $3 billion in the 1980s and early 1990s, the revisions are downward and small (less than $10 billion) through 2003. For 2004–2012, the revisions are downward and larger; the largest downward revision, more than $21 billion, is for 2012. From 2013–2017, revisions are upward; the largest, more than $23.2 billion, is for 2016 (table 7).
With the exception of very small downward revisions to federal spending for 1945–1948 (less than $1 billion), revisions are entirely within state and local spending until 1969. For 1970–1981, 1989, and 1992–2003, downward revisions to state and local spending more than offset upward revisions to federal spending. For 2004–2012, the revisions to state and local spending are downward, and revisions to federal spending are of mixed sign; the net effects on aggregate government spending are downward. For 2013–2017, upward revisions to state and local spending and mixed revisions to federal spending result in net upward revisions to aggregate spending; the largest upward revision to aggregate spending, over $23 billion, is for 2016 (table 7).
| 1946 | 1987 | 2007 | 2012 | 2013 | 2014 | 2015 | 2016 | 2017 | |
|---|---|---|---|---|---|---|---|---|---|
| Total revision | −0.2 | 0.8 | −11.1 | −21.6 | 16.4 | 10.0 | 15.3 | 23.2 | 20.6 |
| Definitional | 0.0 | 0.0 | 0.0 | 0.0 | 0.0 | 0.0 | 0.0 | 0.0 | 0.0 |
| Statistical | −0.2 | 0.8 | −11.1 | −21.6 | 16.4 | 10.0 | 15.3 | 23.2 | 20.6 |
| Federal | −0.1 | 2.6 | 0.7 | −6.0 | −2.9 | −4.0 | −3.1 | 0.7 | 4.5 |
| National defense | −0.1 | 2.4 | 0.5 | −3.6 | −2.8 | −3.1 | −2.0 | −1.6 | −0.6 |
| Consumption expenditures | −0.1 | 2.4 | 2.0 | −3.6 | −2.5 | −2.2 | −1.2 | 2.0 | 5.3 |
| Definitional | 0.0 | 0.0 | 0.0 | 0.0 | 0.0 | 0.0 | 0.0 | 0.0 | 0.0 |
| Statistical | −0.1 | 2.4 | 2.0 | −3.6 | −2.5 | −2.2 | −1.2 | 2.0 | 5.3 |
| Gross investment | 0.0 | 0.0 | −1.5 | −0.1 | −0.2 | −0.9 | −0.8 | −3.6 | −5.8 |
| Definitional | 0.0 | 0.0 | 0.0 | 0.0 | 0.0 | 0.0 | 0.0 | 0.0 | 0.0 |
| Statistical | 0.0 | 0.0 | −1.5 | −0.1 | −0.2 | −0.9 | −0.8 | −3.6 | −5.8 |
| Nondefense | 0.0 | 0.1 | 0.2 | −2.3 | −0.1 | −0.9 | −1.1 | 2.3 | 5.1 |
| Consumption expenditures | 0.0 | 0.1 | 0.1 | −5.0 | −1.6 | −1.9 | −3.0 | 1.0 | 3.7 |
| Definitional | 0.0 | 0.0 | 0.0 | 0.0 | 0.0 | 0.0 | 0.0 | 0.0 | 0.0 |
| Statistical | 0.0 | 0.1 | 0.1 | −5.0 | −1.6 | −1.9 | −3.0 | 1.0 | 3.7 |
| Improved measures of the implicit services of savings institutions and credit unions | … | … | 0.1 | 0.0 | 0.0 | 0.0 | 0.1 | 0.1 | 0.0 |
| Other statistical | 0.0 | 0.1 | 0.0 | −5.0 | −1.6 | −1.9 | −3.1 | 0.9 | 3.7 |
| Gross investment | 0.0 | 0.0 | 0.1 | 2.7 | 1.4 | 1.0 | 1.8 | 1.3 | 1.4 |
| Definitional | 0.0 | 0.0 | 0.0 | 0.0 | 0.0 | 0.0 | 0.0 | 0.0 | 0.0 |
| Statistical | 0.0 | 0.0 | 0.1 | 2.7 | 1.4 | 1.0 | 1.8 | 1.3 | 1.4 |
| State and local | −0.1 | −1.8 | −11.8 | −15.6 | 19.2 | 14.0 | 18.4 | 22.5 | 16.1 |
| Consumption expenditures | −0.1 | −1.8 | −13.0 | −19.6 | 12.4 | 6.6 | 6.1 | −1.6 | −10.0 |
| Definitional | 0.0 | 0.0 | 0.0 | 0.0 | 0.0 | 0.0 | 0.0 | 0.0 | 0.0 |
| Statistical | −0.1 | −1.8 | −13.0 | −19.6 | 12.4 | 6.6 | 6.1 | −1.6 | −10.0 |
| Improved measures of the implicit services of savings institutions and credit unions | 0.0 | 0.0 | 0.4 | 2.0 | 1.1 | 0.9 | 0.5 | 0.1 | 0.6 |
| Measures of state and local defined benefit pension plans | −0.1 | −1.8 | −19.8 | −34.7 | −37.0 | −37.8 | −38.1 | −40.7 | −41.0 |
| Other statistical | 0.0 | 0.0 | 6.4 | 13.1 | 48.3 | 43.5 | 43.7 | 39.0 | 30.4 |
| Gross investment | 0.0 | 0.0 | 1.2 | 4.0 | 6.9 | 7.3 | 12.3 | 24.1 | 26.0 |
| Definitional | 0.0 | 0.0 | 0.0 | 0.0 | 0.0 | 0.0 | 0.0 | 0.0 | 0.0 |
| Statistical | 0.0 | 0.0 | 1.2 | 4.0 | 6.9 | 7.3 | 12.3 | 24.1 | 26.0 |
Revisions to federal spending are distributed among defense and nondefense spending and they are entirely within consumption expenditures until 2002. For 2002–2017, revisions are distributed among consumption expenditures and gross investment. The revisions are mostly statistical, resulting from the incorporation of the 2012 benchmark I-O accounts and revised and newly available federal budget data from the Office of Management and Budget (OMB). The improved measures of the implicit output of savings banks and credit unions have small upward effects (of less than $1 billion) on nondefense spending for 1993–2017.
For state and local spending, revisions are mostly to consumption for much of the period; revisions to investment spending do not exceed $10 billion until 2015. The introduction of the PBO method for state and local defined benefit pension plans is the largest factor in downward revisions to aggregate consumption spending until 2013. For 2013–2017, upward effects from the incorporation of revised and newly available Census Bureau government finances data more than offset the downward effects of the switch to the PBO method. Revisions to state and local investment spending are entirely due to the incorporation of revised and newly available source data, including revised Census Bureau data on government finances and on construction spending.
Income-side components
Compensation of employees, paid. This aggregate shows the income accruing to employees for their labor contribution for domestic production; it includes compensation paid to the rest of the world and excludes compensation received from the rest of the world.7
The revisions to compensation reflect revisions to wages and salaries and to supplements to wages and salaries. Revisions to wages and salaries are less than $5 billion until 2010; they are downward for most years and less than $10 billion for 2010–2016 (table 8). These revisions to wages and salaries reflect statistical changes, including updated measures of misreporting based on data from the IRS and revised data on wages and salaries paid to and received from the rest of the world from the ITAs. The estimate was revised up over $100 billion for 2017, primarily reflecting the incorporation of updated Quarterly Census of Employment and Wages (QCEW) data; the estimate was previously derived from quarterly extrapolations of preliminary QCEW data.
| 1946 | 1987 | 2007 | 2012 | 2013 | 2014 | 2015 | 2016 | 2017 | |
|---|---|---|---|---|---|---|---|---|---|
| Total revision | −0.1 | −1.9 | −19.4 | −43.2 | −8.2 | −8.4 | −12.1 | −23.3 | 97.4 |
| Definitional | 0.0 | 0.0 | 0.0 | 0.0 | 0.0 | 0.0 | 0.0 | 0.0 | 0.0 |
| Statistical | −0.1 | −1.9 | −19.4 | −43.2 | −8.2 | −8.4 | −12.1 | −23.3 | 97.4 |
| Wages and salaries | 0.0 | 0.0 | 1.6 | −2.8 | −3.5 | −3.6 | −5.1 | −5.5 | 100.2 |
| Definitional | 0.0 | 0.0 | 0.0 | 0.0 | 0.0 | 0.0 | 0.0 | 0.0 | 0.0 |
| Statistical | 0.0 | 0.0 | 1.6 | −2.8 | −3.5 | −3.6 | −5.1 | −5.5 | 100.2 |
| Misreporting adjustment1 | 0.0 | 0.0 | 1.8 | −2.8 | −3.6 | −4.5 | −3.7 | … | … |
| Other statistical | 0.0 | 0.0 | −0.2 | 0.0 | 0.1 | 0.9 | −1.4 | −5.5 | 100.2 |
| Supplements to wages and salaries | −0.1 | −1.9 | −21.0 | −40.4 | −4.7 | −4.8 | −6.9 | −17.8 | −2.7 |
| Employer contributions for employee pension and insurance funds | −0.1 | −1.9 | −21.0 | −39.4 | −4.3 | −3.5 | −5.2 | −15.6 | 2.3 |
| Definitional | 0.0 | 0.0 | 0.0 | 0.0 | 0.0 | 0.0 | 0.0 | 0.0 | 0.0 |
| Statistical | −0.1 | −1.9 | −21.0 | −39.4 | −4.3 | −3.5 | −5.2 | −15.6 | 2.3 |
| Measures of state and local defined benefit pension plans | −0.1 | −2.3 | −22.9 | −37.4 | −37.7 | −38.7 | −39.0 | −41.8 | −42.1 |
| Other statistical | 0.0 | 0.4 | 1.9 | −2.0 | 33.4 | 35.2 | 33.8 | 26.2 | 44.4 |
| Employer contributions for government social insurance | 0.0 | 0.0 | 0.0 | −1.0 | −0.5 | −1.3 | −1.7 | −2.3 | −5.0 |
| Definitional | 0.0 | 0.0 | 0.0 | 0.0 | 0.0 | 0.0 | 0.0 | 0.0 | 0.0 |
| Statistical | 0.0 | 0.0 | 0.0 | −1.0 | −0.5 | −1.3 | −1.7 | −2.3 | −5.0 |
- Impacts of revised estimates of misreporting adjustment for 2016–2017 cannot be distinguished.
Revisions to supplements are downward for all years, primarily as the result of the switch to the PBO method for state and local government defined benefit pension plans; the effects of this change are downward and less than $5 billion until 1995. The largest downward effect of the switch to the PBO method is in 2017 (about $42 billion). The revisions to supplements, particularly beginning in 2013, also reflect the incorporation of newly available and revised source data, including pension data from the Department of Labor and the Pension Benefit Guaranty Corporation.
Taxes on production and imports. Revisions begin with 2002; revisions are upward and small for most years, but by 2013 they exceed $10 billion. The largest upward revision, more than $19 billion, is for 2014. The revisions are primarily to state and local tax receipts, due mostly to the incorporation of newly available and revised source data, including new and revised Census Bureau government finances data. The reclassification of selected state and local taxes from personal current taxes to taxes on production and imports contributes to the revisions beginning in 2007, but these revisions are less than $3 billion (table 9).
Subsidies. This component is unrevised for most years until 2001; thereafter, revisions are less than $1 billion and are largely due to the incorporation of new and revised federal budget data (table 9).
| 1946 | 1987 | 2007 | 2012 | 2013 | 2014 | 2015 | 2016 | 2017 | |
|---|---|---|---|---|---|---|---|---|---|
| Total revision | 0.0 | 0.0 | 2.3 | 4.1 | 13.3 | 19.3 | 14.1 | 15.7 | 17.1 |
| Definitional | 0.0 | 0.0 | 0.3 | 1.6 | 2.0 | 1.4 | 1.7 | 2.1 | 2.2 |
| Reclassification of selected state taxes from personal taxes to taxes on production and imports | 0.0 | 0.0 | 0.3 | 1.6 | 2.0 | 1.4 | 1.7 | 2.1 | 2.2 |
| Statistical | 0.0 | 0.0 | 2.0 | 2.5 | 12.3 | 17.9 | 12.4 | 13.6 | 14.9 |
| Taxes on production and imports | 0.0 | 0.0 | 2.3 | 4.1 | 13.8 | 19.3 | 14.1 | 15.7 | 17.1 |
| Federal | 0.0 | 0.0 | 0.0 | 0.0 | 0.6 | 0.9 | 0.2 | 0.6 | −0.8 |
| Definitional | 0.0 | 0.0 | 0.0 | 0.0 | 0.0 | 0.0 | 0.0 | 0.0 | 0.0 |
| Statistical | 0.0 | 0.0 | 0.0 | 0.0 | 0.6 | 0.9 | 0.2 | 0.6 | −0.8 |
| State and local | 0.0 | 0.0 | 2.2 | 4.0 | 13.1 | 18.3 | 14.0 | 15.1 | 17.9 |
| Definitional | 0.0 | 0.0 | 0.3 | 1.6 | 2.0 | 1.4 | 1.7 | 2.1 | 2.2 |
| Reclassification of selected state taxes from personal taxes to taxes on production and imports | 0.0 | 0.0 | 0.3 | 1.6 | 2.0 | 1.4 | 1.7 | 2.1 | 2.2 |
| Statistical | 0.0 | 0.0 | 1.9 | 2.4 | 11.1 | 16.9 | 12.3 | 13.0 | 15.7 |
| Less: Subsidies | 0.0 | 0.0 | 0.0 | 0.0 | 0.5 | 0.0 | 0.0 | 0.0 | 0.0 |
| Definitional | 0.0 | 0.0 | 0.0 | 0.0 | 0.0 | 0.0 | 0.0 | 0.0 | 0.0 |
| Statistical | 0.0 | 0.0 | 0.0 | 0.0 | 0.5 | 0.0 | 0.0 | 0.0 | 0.0 |
Net operating surplus. This component is a profits-like measure that shows business income after subtracting the costs of compensation of employees, taxes on production and imports less subsidies, and CFC from gross value added but before subtracting financing costs (such as net interest) and business transfer payments. Net operating surplus consists of net interest and miscellaneous payments (of domestic industries), business current transfer payments, proprietors’ income with inventory valuation adjustment (IVA) and capital consumption adjustment (CCAdj), rental income of persons with CCAdj, corporate profits with IVA and CCAdj, and the current surplus of government enterprises. Except for the current surplus of government enterprises discussed below, the revisions to these components are discussed in the following section on the private enterprise account.8
Revisions to net operating surplus are generally downward until 2010, although there is a small upward revision, less than $3 billion, for 2007. The downward revisions are less than $10 billion until 1985; the largest downward revision, more than $71 billion, is for 2008. For 2010–2017, revisions are upward for most years; the largest revision, more than $83 billion, is for 2014. For 1946–2008, the revisions are largely within net interest and miscellaneous payments (domestic industries); there are small revisions of mixed sign to other components. For 2010–2017, upward revisions to proprietors’ income exceed downward revisions to net interest.
Current surplus of government enterprises. Revisions are upward and less than $10 billion throughout the period. The largest revision, more than $8 billion, is for 2015. For most of the period, revisions are largely due to the use of the PBO method for revised measures of state and local government defined benefit pension plans; for 2013–2017, the incorporation of revised and newly available source data outweighs the effects of this change. Source data include revised and newly available Census Bureau government finances data (table 10).
| 1946 | 1987 | 2007 | 2012 | 2013 | 2014 | 2015 | 2016 | 2017 | |
|---|---|---|---|---|---|---|---|---|---|
| Total revision | 0.0 | 0.6 | 2.3 | 3.9 | 5.0 | 6.9 | 8.5 | 7.8 | 6.1 |
| Definitional | 0.0 | 0.0 | 0.0 | 0.0 | 0.0 | 0.0 | 0.0 | 0.0 | 0.0 |
| Statistical | 0.0 | 0.6 | 2.3 | 3.9 | 5.0 | 6.9 | 8.5 | 7.8 | 6.1 |
| Federal | 0.0 | 0.0 | 0.1 | 1.2 | 1.1 | 0.9 | 1.2 | 1.8 | 2.2 |
| Definitional | 0.0 | 0.0 | 0.0 | 0.0 | 0.0 | 0.0 | 0.0 | 0.0 | 0.0 |
| Statistical | 0.0 | 0.0 | 0.1 | 1.2 | 1.1 | 0.9 | 1.2 | 1.8 | 2.2 |
| State and local | 0.0 | 0.6 | 2.2 | 2.7 | 4.0 | 6.0 | 7.3 | 6.0 | 3.9 |
| Definitional | 0.0 | 0.0 | 0.0 | 0.0 | 0.0 | 0.0 | 0.0 | 0.0 | 0.0 |
| Statistical | 0.0 | 0.6 | 2.2 | 2.7 | 4.0 | 6.0 | 7.3 | 6.0 | 3.9 |
| Measures of state and local defined benefit pension plans | 0.0 | 0.5 | 3.1 | 2.7 | 0.7 | 0.9 | 0.9 | 1.1 | 1.1 |
| Other statistical | 0.0 | 0.1 | −0.9 | 0.0 | 3.3 | 5.1 | 6.4 | 4.9 | 2.8 |
Consumption of fixed capital (CFC). CFC has small revisions of mixed sign for 1929–1998 (less than $5 billion). For 1998–2008, revisions are downward and exceed $10 billion in three years; in 2005–2007, the downward revisions are between $10 and $12 billion. For 2009–2017, revisions are upward; the largest upward revision, more than $81 billion, is for 2017 (table 11).
| 1946 | 1987 | 2007 | 2012 | 2013 | 2014 | 2015 | 2016 | 2017 | |
|---|---|---|---|---|---|---|---|---|---|
| Total revision | −0.1 | 2.4 | −11.5 | 41.8 | 52.3 | 68.9 | 75.9 | 73.8 | 81.5 |
| Definitional | 0.0 | 0.0 | −8.5 | −5.0 | −3.9 | −3.0 | −2.4 | −2.1 | −1.7 |
| Statistical | −0.1 | 2.4 | −3.0 | 46.8 | 56.2 | 71.9 | 78.3 | 75.9 | 83.2 |
| Private | 0.0 | 0.0 | −12.5 | 44.4 | 54.2 | 69.5 | 75.7 | 73.0 | 78.2 |
| Business | 0.0 | 0.0 | −4.6 | 37.0 | 44.1 | 57.1 | 61.7 | 58.4 | 62.2 |
| Consumption of fixed capital | 0.0 | 0.0 | −4.6 | 37.0 | 44.1 | 57.1 | 61.7 | 58.4 | 62.2 |
| Definitional | 0.0 | 0.0 | −8.5 | −5.0 | −3.9 | −3.0 | −2.4 | −2.1 | −1.7 |
| Introduction of capital services into own-account investment | 0.0 | 0.0 | 0.0 | 4.9 | 6.4 | 7.7 | 8.9 | 9.9 | 10.9 |
| Reclassification of software research and development (R&D) | 0.0 | 0.0 | −8.5 | −9.8 | −10.3 | −10.7 | −11.3 | −12.0 | −12.6 |
| Statistical | 0.0 | 0.0 | 3.9 | 42.0 | 48.0 | 60.1 | 64.1 | 60.5 | 63.9 |
| Equals: Capital consumption allowances | 0.0 | 0.0 | −3.2 | 13.7 | 21.9 | 29.0 | 34.2 | 79.3 | 93.0 |
| Definitional | 0.0 | 0.0 | −1.7 | 2.6 | 3.9 | 5.1 | 6.0 | 6.7 | 7.5 |
| Introduction of capital services into own-account investment | 0.0 | 0.0 | 0.0 | 4.6 | 6.1 | 7.3 | 8.4 | 9.4 | 10.3 |
| Reclassification of software R&D | 0.0 | 0.0 | −1.7 | −2.0 | −2.2 | −2.3 | −2.4 | −2.7 | −2.8 |
| Statistical | 0.0 | 0.0 | −1.5 | 11.1 | 18.0 | 23.9 | 28.2 | 72.6 | 85.5 |
| Less: Capital consumption adjustment | 0.0 | 0.0 | 1.4 | −23.3 | −22.2 | −28.1 | −27.5 | 20.9 | 30.8 |
| Definitional | 0.0 | 0.0 | 6.8 | 7.7 | 7.9 | 8.1 | 8.5 | 8.8 | 9.3 |
| Introduction of capital services into own-account investment | 0.0 | 0.0 | 0.0 | −0.2 | −0.3 | −0.3 | −0.4 | −0.5 | −0.5 |
| Reclassification of software R&D | 0.0 | 0.0 | 6.8 | 7.9 | 8.1 | 8.4 | 8.9 | 9.3 | 9.8 |
| Statistical | 0.0 | 0.0 | −5.4 | −31.0 | −30.1 | −36.2 | −36.0 | 12.1 | 21.5 |
| Households and institutions | 0.0 | 0.0 | −7.9 | 7.4 | 10.1 | 12.4 | 13.9 | 14.6 | 16.0 |
| Definitional | 0.0 | 0.0 | 0.0 | 0.0 | 0.0 | 0.0 | 0.0 | 0.0 | 0.0 |
| Statistical | 0.0 | 0.0 | −7.9 | 7.4 | 10.1 | 12.4 | 13.9 | 14.6 | 16.0 |
| Government | −0.1 | 2.4 | 0.9 | −2.6 | −1.9 | −0.6 | 0.3 | 0.8 | 3.2 |
| General government | −0.1 | 2.5 | 0.7 | −3.2 | −2.8 | −1.9 | −1.6 | −1.8 | 1.4 |
| Federal | −0.1 | 2.6 | −0.1 | −2.6 | −2.1 | −1.2 | −0.8 | −1.0 | 1.7 |
| Definitional | 0.0 | 0.0 | 0.0 | 0.0 | 0.0 | 0.0 | 0.0 | 0.0 | 0.0 |
| Statistical | −0.1 | 2.6 | −0.1 | −2.6 | −2.1 | −1.2 | −0.8 | −1.0 | 1.7 |
| State and local | 0.0 | 0.0 | 0.7 | −0.5 | −0.6 | −0.7 | −0.9 | −0.8 | −0.2 |
| Definitional | 0.0 | 0.0 | 0.0 | 0.0 | 0.0 | 0.0 | 0.0 | 0.0 | 0.0 |
| Statistical | 0.0 | 0.0 | 0.7 | −0.5 | −0.6 | −0.7 | −0.9 | −0.8 | −0.2 |
| Government enterprises | 0.0 | −0.1 | 0.2 | 0.5 | 0.9 | 1.3 | 1.9 | 2.6 | 1.8 |
| Federal | 0.0 | 0.0 | 0.1 | −0.1 | 0.0 | 0.2 | 0.3 | 0.4 | 0.5 |
| Definitional | 0.0 | 0.0 | 0.0 | 0.0 | 0.0 | 0.0 | 0.0 | 0.0 | 0.0 |
| Statistical | 0.0 | 0.0 | 0.1 | −0.1 | 0.0 | 0.2 | 0.3 | 0.4 | 0.5 |
| State and local | 0.0 | −0.1 | 0.2 | 0.6 | 0.9 | 1.1 | 1.6 | 2.3 | 1.3 |
| Definitional | 0.0 | 0.0 | 0.0 | 0.0 | 0.0 | 0.0 | 0.0 | 0.0 | 0.0 |
| Statistical | 0.0 | −0.1 | 0.2 | 0.6 | 0.9 | 1.1 | 1.6 | 2.3 | 1.3 |
For 1998–2008, the downward revisions to private CFC more than offset the upward revisions to government CFC. For 2009–2017, revisions to private CFC are upward and over $10 billion in most years; they exceed the mixed-sign revisions to government CFC by a large margin.
Until 1988, the revisions are entirely statistical; at that point, the reclassification of R&D for software from private fixed investment in software to private fixed investment in R&D led to downward revisions in CFC, as the rate of depreciation for R&D is lower than the rate for software. For 1995–2008, these downward revisions more than offset the upward revisions from statistical changes, including the incorporation of source data. The largest downward revision, almost $12 billion, is for 2006. For 2008 forward, the introduction of capital services into own-account investment in software has upward effects on CFC that partly offset the downward effects of the reclassification of R&D for software; combined with increasing upward statistical effects, the aggregate revisions to CFC are upward and larger for the rest of the period. The largest upward revision, more than $81 billion, is for 2017.
Private enterprise income (account 2)
Private enterprises consist of private businesses, owner-occupied housing, and nonprofit institutions serving households (for purposes of estimating monetary and imputed interest payments and imputed interest receipts).
Net interest and miscellaneous payments. Revisions for this component are downward and less than $10 billion until 1986. For 1986–2017, revisions are downward (except for an upward revision of less than $5 billion for 2015). The largest downward revision, more than $38 billion, is for 2013 (table 12).
| 1946 | 1987 | 2007 | 2012 | 2013 | 2014 | 2015 | 2016 | 2017 | |
|---|---|---|---|---|---|---|---|---|---|
| Total revision | −0.1 | −15.8 | −28.9 | −23.7 | −38.2 | −16.9 | 4.9 | −30.1 | −20.4 |
| Definitional | 0.0 | 0.0 | 0.0 | 0.0 | 0.0 | 0.0 | 0.0 | 0.0 | 0.0 |
| Statistical | −0.1 | −15.8 | −28.9 | −23.7 | −38.2 | −16.9 | 4.9 | −30.1 | −20.4 |
| Net interest, domestic industries1 | −0.1 | −15.8 | −29.0 | −23.9 | −37.9 | −16.3 | 5.7 | −28.3 | … |
| Definitional | 0.0 | 0.0 | 0.0 | 0.0 | 0.0 | 0.0 | 0.0 | 0.0 | … |
| Statistical | −0.1 | −15.8 | −29.0 | −23.9 | −37.9 | −16.3 | 5.7 | −28.3 | … |
| Improved measures of the implicit services of savings institutions and credit unions | −0.1 | −15.8 | −30.8 | −27.8 | −32.1 | −34.9 | −34.4 | −39.3 | … |
| Other statistical | 0.0 | 0.0 | 1.8 | 3.9 | −5.8 | 18.6 | 40.1 | 11.0 | … |
| Miscellaneous payments | 0.0 | 0.0 | 0.1 | 0.2 | −0.3 | −0.5 | −0.8 | −1.8 | −2.3 |
| Definitional | 0.0 | 0.0 | 0.0 | 0.0 | 0.0 | 0.0 | 0.0 | 0.0 | 0.0 |
| Statistical | 0.0 | 0.0 | 0.1 | 0.2 | −0.3 | −0.5 | −0.8 | −1.8 | −2.3 |
- Revisions for 2017 are not shown because these data were not previously published.
The revisions are due to statistical changes, and until 1993, they are due entirely to the introduction of the reference rate approach for measures of the implicit output of savings banks and credit unions. The largest downward effect of this change, more than $39 billion, is for 2016. For 1993–2001 and 2007–2012, the incorporation of revised and newly available source data led to upward revisions of less than $10 billion that partly offset the downward effects of the improved measures of implicit output. For 2002–2006 and 2013, small downward revisions (about $5 billion or less) from the incorporation of revised and newly available source data supplement the effects of the improved measures. For 2014–2017, the effects of the incorporation of source data are larger, and for 2015 and 2017 they more than offset the downward revisions from the improved measures of implicit output. The source data incorporated include newly available and revised IRS data and new Federal Reserve Board data.
Revisions to miscellaneous payments, for 2006–2017, are of mixed sign and are less than $2 billion in absolute value in all years except 2017; they are due entirely to the incorporation of revised and newly available source data.
Business current transfer payments (net). This component consists of payments to persons, to government, and to the rest of the world (table 13).
| 1946 | 1987 | 2007 | 2012 | 2013 | 2014 | 2015 | 2016 | 2017 | |
|---|---|---|---|---|---|---|---|---|---|
| Total revision | 0.0 | 0.0 | −0.3 | −5.8 | −8.1 | −6.0 | −8.3 | 4.1 | −0.6 |
| Definitional | 0.0 | 0.0 | 0.0 | 0.0 | 0.0 | 0.0 | 0.0 | 0.0 | 0.0 |
| Statistical | 0.0 | 0.0 | −0.3 | −5.8 | −8.1 | −6.0 | −8.3 | 4.1 | −0.6 |
| Payments to persons (net) | 0.0 | 0.0 | 0.2 | −2.3 | −2.7 | −2.5 | −2.5 | 3.3 | −3.8 |
| Definitional | 0.0 | 0.0 | 0.0 | 0.0 | 0.0 | 0.0 | 0.0 | 0.0 | 0.0 |
| Statistical | 0.0 | 0.0 | 0.2 | −2.3 | −2.7 | −2.5 | −2.5 | 3.3 | −3.8 |
| Payments to government (net) | 0.0 | 0.0 | −1.1 | −3.6 | −6.1 | −4.4 | −3.3 | −2.9 | −2.3 |
| Federal | 0.0 | 0.0 | 0.0 | 0.0 | −1.5 | −0.3 | 0.0 | 0.6 | 1.7 |
| Definitional | 0.0 | 0.0 | 0.0 | 0.0 | 0.0 | 0.0 | 0.0 | 0.0 | 0.0 |
| Statistical | 0.0 | 0.0 | 0.0 | 0.0 | −1.5 | −0.3 | 0.0 | 0.6 | 1.7 |
| State and local | 0.0 | 0.0 | −1.1 | −3.6 | −4.7 | −4.1 | −3.4 | −3.4 | −4.0 |
| Definitional | 0.0 | 0.0 | 0.0 | 0.0 | 0.0 | 0.0 | 0.0 | 0.0 | 0.0 |
| Statistical | 0.0 | 0.0 | −1.1 | −3.6 | −4.7 | −4.1 | −3.4 | −3.4 | −4.0 |
| Payments to the rest of the world (net) | 0.0 | 0.0 | 0.6 | 0.1 | 0.7 | 0.9 | −2.4 | 3.7 | 5.5 |
| Definitional | 0.0 | 0.0 | 0.0 | 0.0 | 0.0 | 0.0 | 0.0 | 0.0 | 0.0 |
| Statistical | 0.0 | 0.0 | 0.6 | 0.1 | 0.7 | 0.9 | −2.4 | 3.7 | 5.5 |
Revisions to total business current transfer payments are less than $10 billion in absolute value for the entire period. The revisions, which are of mixed sign, are statistical and result largely from the incorporation of revised trade source data on insurance benefits and newly available and revised IRS tabulations of corporate gifts.
Proprietors’ income with IVA and CCAdj. For proprietors’ income, revisions do not exceed $5 billion until 2001. Until 2006, revisions are downward and less than $5 billion for all but one year (the largest downward revision, more than $5 billion, is for 2001). For 2007–2017, revisions are upward for most years and larger; the largest upward revision, more than $131 billion, is for 2014. (table 14).
| 1946 | 1987 | 2007 | 2012 | 2013 | 2014 | 2015 | 2016 | 2017 | |
|---|---|---|---|---|---|---|---|---|---|
| Total revision | 0.0 | 0.0 | 14.9 | 105.9 | 118.8 | 131.8 | 103.0 | 77.4 | 114.9 |
| Definitional | 0.0 | 0.0 | 0.8 | 1.6 | 1.6 | 1.6 | 1.5 | 1.6 | 1.7 |
| Statistical | 0.0 | 0.0 | 14.1 | 104.3 | 117.2 | 130.2 | 101.5 | 75.8 | 113.2 |
| Source of revision by component | |||||||||
| Farm | 0.0 | 0.0 | 2.2 | −0.7 | 0.6 | 1.9 | 2.7 | −5.7 | 3.8 |
| Definitional | 0.0 | 0.0 | 0.0 | 0.0 | 0.0 | 0.0 | 0.0 | 0.0 | 0.0 |
| Statistical | 0.0 | 0.0 | 2.2 | −0.7 | 0.6 | 1.9 | 2.7 | −5.7 | 3.8 |
| Improved measures of the implicit services of savings institutions and credit unions | 0.0 | 0.0 | 2.3 | 0.9 | 0.9 | 0.7 | 0.8 | 0.5 | 0.5 |
| Other statistical | 0.0 | 0.0 | −0.1 | −1.6 | −0.3 | 1.2 | 1.9 | −6.2 | 3.3 |
| Nonfarm | 0.0 | 0.0 | 12.7 | 106.6 | 118.3 | 129.9 | 100.4 | 83.1 | 111.2 |
| Definitional | 0.0 | 0.0 | 0.8 | 1.6 | 1.6 | 1.6 | 1.5 | 1.6 | 1.7 |
| Introduction of capital services into own-account investment | 0.0 | 0.0 | 0.0 | 0.6 | 0.6 | 0.5 | 0.4 | 0.4 | 0.4 |
| Reclassification of software R&D | 0.0 | 0.0 | 0.8 | 1.0 | 1.0 | 1.1 | 1.1 | 1.2 | 1.3 |
| Statistical | 0.0 | 0.0 | 11.9 | 105.0 | 116.7 | 128.3 | 98.9 | 81.5 | 109.5 |
| Misreporting adjustment1 | 0.0 | 0.0 | 14.6 | 101.1 | 102.2 | 112.3 | 94.0 | … | … |
| Other statistical | 0.0 | 0.0 | −2.7 | 3.9 | 14.5 | 16.0 | 4.9 | 81.5 | 109.5 |
- Impacts of revised estimates of misreporting adjustment for 2016–2017 cannot be distinguished.
For 2007–2017, the revisions are almost entirely attributable to revised estimates of the misreporting of nonfarm proprietors’ income, based on IRS data, which exceed $100 billion for 2012–2014. For 2016–2017, the previously published annual estimates of nonfarm proprietors’ income were derived by extrapolating from preliminary 2015 IRS Statistics of Income data; as a result, the effects of the revised misreporting adjustments cannot be distinguished, but they are reflected in the total statistical revisions for those years. The revisions for 1988–2017 also reflect the incorporation of revised and newly available source data, including tabulations of IRS tax return data and Census Bureau income data.
For farm proprietors’ income, revisions are less than $10 billion in absolute value for all but one year (the measure for 2011 was revised down by almost $11 billion). The revisions for 2003–2007 are largely due to the improved measures of the implicit output of savings banks and credit unions; after 2007, the revisions are also due to the incorporation of revised U.S. Department of Agriculture data.
Rental income of persons with CCAdj. Revisions are downward and small for the entire period; they are less than $5 billion until 1997, and they exceed $10 billion in only four years. The largest downward revision, under $14 billion, is for 2017 (table 15). The revisions are due entirely to the incorporation of revised or newly available source data, including Census Bureau data from the Current Population Survey and the Housing Vacancy Survey, IRS tabulations of individual income tax return data, and revised Federal Reserve Board data on residential mortgage loans.
| 1946 | 1987 | 2007 | 2012 | 2013 | 2014 | 2015 | 2016 | 2017 | |
|---|---|---|---|---|---|---|---|---|---|
| Total revision | 0.0 | −3.6 | −5.1 | −7.3 | −10.1 | −3.3 | −10.7 | −12.5 | −13.7 |
| Definitional | 0.0 | 0.0 | 0.0 | 0.0 | 0.0 | 0.0 | 0.0 | 0.0 | 0.0 |
| Statistical | 0.0 | −3.6 | −5.1 | −7.3 | −10.1 | −3.3 | −10.7 | −12.5 | −13.7 |
Corporate profits with IVA and CCAdj. Revisions to corporate profits are mostly upward and less than $10 billion until 2005; for 2005–2017, they are mostly downward and larger. For domestic industries, revisions for 2000–2008 are upward and exceed $5 billion; for 2009–2012 they are of mixed sign and less than $10 billion in absolute value; and for 2013–2017 they are downward and larger. The largest downward revision, more than $65 billion, is for 2017 (table 16). Revisions to net profits from the rest of the world are downward until 2013 and upward for 2013–2017; the largest downward revision is $13 billion for 2013, and the largest upward revision, more than $17 billion, is for 2015.
| 1946 | 1987 | 2007 | 2012 | 2013 | 2014 | 2015 | 2016 | 2017 | |
|---|---|---|---|---|---|---|---|---|---|
| Total revision | 0.0 | 0.0 | 4.2 | −0.8 | −22.2 | −21.7 | −60.2 | −38.5 | −65.4 |
| Definitional | 0.0 | 0.0 | 7.7 | 14.5 | 14.2 | 13.8 | 14.1 | 14.3 | 14.4 |
| Statistical | 0.0 | 0.0 | −3.5 | −15.3 | −36.4 | −35.5 | −74.3 | −52.8 | −79.8 |
| Revision by industry | |||||||||
| Domestic industries | 0.0 | 0.0 | 19.8 | 4.2 | −9.2 | −29.1 | −77.8 | −50.3 | −81.4 |
| Financial | 0.0 | 0.0 | 6.0 | 1.8 | 0.2 | −0.8 | −59.5 | −16.2 | −24.7 |
| Nonfinancial | 0.0 | 0.0 | 13.8 | 2.4 | −9.4 | −28.3 | −18.2 | −34.1 | −56.7 |
| Rest of the world | 0.0 | 0.0 | −15.6 | −5.0 | −13.0 | 7.3 | 17.6 | 11.8 | 16.1 |
| Receipts from the rest of the world | 0.0 | 0.0 | −9.1 | −1.4 | −1.8 | 7.0 | 22.0 | 11.9 | 21.1 |
| Less: Payments to the rest of the world | 0.0 | 0.0 | 6.6 | 3.5 | 11.2 | −0.3 | 4.5 | 0.1 | 5.1 |
| Source of revision by component | |||||||||
| Profits before tax | 0.0 | 0.0 | 4.2 | −0.8 | −22.2 | −21.7 | −60.2 | −38.5 | −65.4 |
| Definitional | 0.0 | 0.0 | 7.7 | 14.5 | 14.2 | 13.8 | 14.1 | 14.3 | 14.4 |
| Introduction of capital services into own-account investment | 0.0 | 0.0 | 0.0 | 5.7 | 4.9 | 4.2 | 3.9 | 3.5 | 3.1 |
| Reclassification of software R&D | 0.0 | 0.0 | 7.7 | 8.8 | 9.3 | 9.6 | 10.2 | 10.8 | 11.3 |
| Statistical | 0.0 | 0.0 | −3.5 | −15.3 | −36.4 | −35.5 | −74.3 | −52.8 | −79.8 |
| Taxes on corporate income | 0.0 | −17.7 | −53.4 | −112.8 | −104.9 | −97.9 | −110.2 | −78.2 | −116.0 |
| Definitional | 0.0 | −17.7 | −34.6 | −88.4 | −79.6 | −96.9 | −110.4 | −91.5 | −83.5 |
| Reclassification of payments made by Federal Reserve banks to the U.S. government | 0.0 | −17.7 | −34.6 | −88.4 | −79.6 | −96.9 | −110.4 | −91.5 | −83.5 |
| Statistical | 0.0 | 0.0 | −18.8 | −24.4 | −25.3 | −1.0 | 0.2 | 13.3 | −32.5 |
| Profits after tax | 0.0 | 17.7 | 57.6 | 112.0 | 82.7 | 76.2 | 50.0 | 39.7 | 50.7 |
| Net dividends | 0.0 | 17.7 | 34.6 | 89.3 | 79.6 | 109.7 | 124.9 | 205.6 | 225.1 |
| Definitional | 0.0 | 17.7 | 34.6 | 88.4 | 79.6 | 96.9 | 110.4 | 91.5 | 83.5 |
| Reclassification of payments made by Federal Reserve banks to the U.S. government | 0.0 | 17.7 | 34.6 | 88.4 | 79.6 | 96.9 | 110.4 | 91.5 | 83.5 |
| Statistical | 0.0 | 0.0 | 0.0 | 0.9 | 0.0 | 12.8 | 14.5 | 114.1 | 141.6 |
| Undistributed profits | 0.0 | 0.0 | 23.0 | 22.7 | 3.1 | −33.5 | −74.9 | −165.9 | −174.5 |
| Definitional | 0.0 | 0.0 | 7.7 | 14.5 | 14.2 | 13.8 | 14.1 | 14.3 | 14.4 |
| Introduction of capital services into own-account investment | 0.0 | 0.0 | 0.0 | 5.7 | 4.9 | 4.2 | 3.9 | 3.5 | 3.1 |
| Reclassification of software R&D | 0.0 | 0.0 | 7.7 | 8.8 | 9.3 | 9.6 | 10.2 | 10.8 | 11.3 |
| Reclassification of payments made by Federal Reserve banks to the U.S. government | 0.0 | 0.0 | 0.0 | 0.0 | 0.0 | 0.0 | 0.0 | 0.0 | 0.0 |
| Statistical | 0.0 | 0.0 | 15.3 | 8.2 | −11.1 | −47.3 | −89.0 | −180.2 | −188.9 |
The revisions are due to both definitional and statistical changes. The recognition of capital services in measures of investment in own-account software had small upward effects from 2008–2017, less than $6 billion, and the reclassification of R&D for software had upward effects from 1988–2017, ranging from less than $1 billion to over $11 billion. The reclassification of Federal Reserve Board payments to the U.S. Treasury Department from taxes to dividends increased dividends by the same amount that it decreased taxes on corporate income, with no net effect on undistributed profits (or on profits before tax).
The incorporation of revised and newly available source data also had mostly upward effects that are less than $3 billion until 2001. They are then downward through 2017 (with the exception of the largest upward revision, about $4 billion, in 2005). The largest downward revision, about $80 billion, is for 2007.
Personal income and outlays (account 3)
Personal income. Revisions are upward and less than $10 billion until 1981. For 1982–2002, upward revisions range from about $2 billion to about $15 billion. For 2003–2009, revisions are downward for all but one year (2007); for 2010–2017, revisions are upward. The largest upward revision, almost $402 billion, is for 2017; the largest downward revision, $60 billion, is for 2008 (table 17).
| 1946 | 1987 | 2007 | 2012 | 2013 | 2014 | 2015 | 2016 | 2017 | |
|---|---|---|---|---|---|---|---|---|---|
| Total revision | −0.1 | 5.7 | 7.6 | 95.0 | 107.4 | 173.6 | 166.6 | 196.4 | 401.9 |
| Definitional | 0.0 | 0.0 | 0.8 | 1.6 | 1.6 | 1.6 | 1.5 | 1.6 | 1.7 |
| Introduction of capital services into own-account investment | 0.0 | 0.0 | 0.0 | 0.6 | 0.6 | 0.5 | 0.4 | 0.4 | 0.4 |
| Reclassification of software R&D | 0.0 | 0.0 | 0.8 | 1.0 | 1.0 | 1.1 | 1.1 | 1.2 | 1.3 |
| Statistical | −0.1 | 5.7 | 6.8 | 93.4 | 105.8 | 172.0 | 165.1 | 194.8 | 400.2 |
| Misreporting adjustment1 | 0.0 | 0.0 | 16.4 | 98.3 | 98.6 | 107.8 | 90.3 | … | … |
| Improved measures of the implicit services of savings institutions and credit unions | −0.1 | −17.6 | −33.3 | −42.2 | −36.5 | −40.0 | −41.1 | −46.9 | −52.2 |
| Measures of state and local defined benefit pension plans | 0.0 | 26.5 | 47.4 | 37.5 | 37.8 | 38.9 | 39.4 | 36.8 | 39.0 |
| Other statistical | 0.0 | −3.3 | −23.7 | −0.2 | 5.9 | 65.3 | 76.4 | 209.0 | 413.3 |
| Source of revision by component | |||||||||
| Compensation of employees, received | −0.1 | −1.9 | −19.4 | −43.2 | −8.2 | −8.4 | −11.4 | −22.4 | 97.9 |
| Definitional | 0.0 | 0.0 | 0.0 | 0.0 | 0.0 | 0.0 | 0.0 | 0.0 | 0.0 |
| Statistical | −0.1 | −1.9 | −19.4 | −43.2 | −8.2 | −8.4 | −11.4 | −22.4 | 97.9 |
| Misreporting adjustment2 | 0.0 | 0.0 | 1.8 | −2.8 | −3.6 | −4.5 | −3.7 | −4.1 | … |
| Measures of state and local defined benefit pension plans | −0.1 | −2.3 | −22.9 | −37.4 | −37.7 | −38.7 | −39.0 | −41.8 | −42.1 |
| Other statistical | 0.0 | 0.4 | 1.7 | −3.0 | 33.1 | 34.8 | 31.3 | 23.5 | 140.0 |
| Proprietors' income with inventory valuation and capital consumption adjustments | 0.0 | 0.0 | 14.9 | 105.9 | 118.8 | 131.8 | 103.0 | 77.4 | 114.9 |
| Definitional | 0.0 | 0.0 | 0.8 | 1.6 | 1.6 | 1.6 | 1.5 | 1.6 | 1.7 |
| Introduction of capital services into own-account investment | 0.0 | 0.0 | 0.0 | 0.6 | 0.6 | 0.5 | 0.4 | 0.4 | 0.4 |
| Reclassification of software R&D | 0.0 | 0.0 | 0.8 | 1.0 | 1.0 | 1.1 | 1.1 | 1.2 | 1.3 |
| Statistical | 0.0 | 0.0 | 14.1 | 104.3 | 117.2 | 130.2 | 101.5 | 75.8 | 113.2 |
| Misreporting adjustment1 | 0.0 | 0.0 | 14.6 | 101.1 | 102.2 | 112.3 | 94.0 | … | … |
| Improved measures of the implicit services of savings institutions and credit unions | 0.0 | 0.0 | 2.3 | 0.9 | 0.9 | 0.7 | 0.8 | 0.5 | 0.5 |
| Other statistical | 0.0 | 0.0 | −2.9 | 2.2 | 14.1 | 17.2 | 6.7 | 75.3 | 112.7 |
| Rental income of persons with capital consumption adjustment | 0.0 | −3.6 | −5.1 | −7.3 | −10.1 | −3.3 | −10.7 | −12.5 | −13.7 |
| Definitional | 0.0 | 0.0 | 0.0 | 0.0 | 0.0 | 0.0 | 0.0 | 0.0 | 0.0 |
| Statistical | 0.0 | −3.6 | −5.1 | −7.3 | −10.1 | −3.3 | −10.7 | −12.5 | −13.7 |
| Personal income receipts on assets | 0.0 | 11.3 | 17.2 | 41.9 | 10.2 | 56.1 | 84.2 | 138.8 | 189.2 |
| Personal interest income | 0.0 | 11.3 | 18.4 | 41.7 | 11.4 | 44.5 | 70.8 | 25.6 | 45.9 |
| Definitional | 0.0 | 0.0 | 0.0 | 0.0 | 0.0 | 0.0 | 0.0 | 0.0 | 0.0 |
| Statistical | 0.0 | 11.3 | 18.4 | 41.7 | 11.4 | 44.5 | 70.8 | 25.6 | 45.9 |
| Improved measures of the implicit services of savings institutions and credit unions | −0.1 | −17.6 | −35.7 | −43.1 | −37.4 | −40.7 | −41.9 | −47.4 | −52.7 |
| Measures of state and local defined benefit pension plans | 0.1 | 28.8 | 70.3 | 74.9 | 75.5 | 77.6 | 78.4 | 78.6 | 81.1 |
| Other statistical | 0.0 | 0.0 | −16.2 | 9.9 | −26.7 | 7.6 | 34.3 | −5.6 | 17.5 |
| Personal dividend income | 0.0 | 0.0 | −1.2 | 0.2 | −1.1 | 11.5 | 13.4 | 113.2 | 143.3 |
| Definitional | 0.0 | 0.0 | 0.0 | 0.0 | 0.0 | 0.0 | 0.0 | 0.0 | 0.0 |
| Statistical | 0.0 | 0.0 | −1.2 | 0.2 | −1.1 | 11.5 | 13.4 | 113.2 | 143.3 |
| Personal current transfer receipts | 0.0 | 0.0 | 0.0 | −3.3 | −3.7 | −4.1 | −1.3 | 9.7 | 9.6 |
| Definitional | 0.0 | 0.0 | 0.0 | 0.0 | 0.0 | 0.0 | 0.0 | 0.0 | 0.0 |
| Statistical | 0.0 | 0.0 | 0.0 | −3.3 | −3.7 | −4.1 | −1.3 | 9.7 | 9.6 |
| Less: Contributions for government social insurance, domestic | 0.0 | 0.0 | 0.0 | −1.0 | −0.3 | −1.5 | −2.7 | −5.5 | −4.0 |
| Definitional | 0.0 | 0.0 | 0.0 | 0.0 | 0.0 | 0.0 | 0.0 | 0.0 | 0.0 |
| Statistical | 0.0 | 0.0 | 0.0 | −1.0 | −0.3 | −1.5 | −2.7 | −5.5 | −4.0 |
| Less: Personal current taxes | 0.0 | 0.0 | −1.0 | −2.5 | −2.0 | −0.2 | −2.7 | −5.9 | −14.0 |
| Definitional | 0.0 | 0.0 | −0.3 | −1.6 | −2.0 | −1.4 | −1.7 | −2.1 | −2.2 |
| Reclassification of selected state taxes from personal taxes to taxes on production and imports | 0.0 | 0.0 | −0.3 | −1.6 | −2.0 | −1.4 | −1.7 | −2.1 | −2.2 |
| Statistical | 0.0 | 0.0 | −0.7 | −0.9 | 0.0 | 1.2 | −1.0 | −3.8 | −11.8 |
| Equals: Disposable personal income | −0.1 | 5.7 | 8.6 | 97.5 | 109.4 | 173.8 | 169.3 | 202.3 | 415.9 |
| Definitional | 0.0 | 0.0 | 1.1 | 3.2 | 3.6 | 3.0 | 3.2 | 3.7 | 3.9 |
| Introduction of capital services into own-account investment | 0.0 | 0.0 | 0.0 | 0.6 | 0.6 | 0.5 | 0.4 | 0.4 | 0.4 |
| Reclassification of software R&D | 0.0 | 0.0 | 0.8 | 1.0 | 1.0 | 1.1 | 1.1 | 1.2 | 1.3 |
| Reclassification of selected state taxes from personal taxes to taxes on production and imports | 0.0 | 0.0 | 0.3 | 1.6 | 2.0 | 1.4 | 1.7 | 2.1 | 2.2 |
| Statistical | −0.1 | 5.7 | 7.5 | 94.3 | 105.8 | 170.8 | 166.1 | 198.6 | 412.0 |
| Misreporting adjustment1 | 0.0 | 0.0 | 16.4 | 98.3 | 98.6 | 107.8 | 90.3 | … | … |
| Improved measures of the implicit services of savings institutions and credit unions | −0.1 | −17.6 | −33.3 | −42.2 | −36.5 | −40.0 | −41.1 | −46.9 | −52.2 |
| Measures of state and local defined benefit pension plans | 0.0 | 26.5 | 47.4 | 37.5 | 37.8 | 38.9 | 39.4 | 36.8 | 39.0 |
| Other statistical | 0.0 | −3.3 | −23.1 | 0.7 | 5.9 | 64.0 | 77.4 | 212.8 | 425.1 |
| Less: Personal outlays | −0.1 | −17.6 | −73.3 | −63.4 | −71.8 | −57.7 | −46.5 | −65.4 | −83.6 |
| Personal consumption expenditures | −0.1 | −15.8 | −44.1 | −43.8 | −44.0 | −39.6 | −37.7 | −53.8 | −74.1 |
| Definitional | 0.0 | 0.0 | 0.3 | 1.6 | 2.0 | 1.4 | 1.7 | 2.1 | 2.2 |
| Reclassification of selected state taxes from personal taxes to taxes on production and imports | 0.0 | 0.0 | 0.3 | 1.6 | 2.0 | 1.4 | 1.7 | 2.1 | 2.2 |
| Statistical | −0.1 | −15.8 | −44.4 | −45.4 | −46.0 | −41.0 | −39.4 | −55.9 | −76.3 |
| Improved measures of the implicit services of savings institutions and credit unions | −0.1 | −15.8 | −31.3 | −31.3 | −38.6 | −45.9 | −48.6 | −61.0 | −64.6 |
| Other statistical | 0.0 | 0.0 | −13.1 | −14.1 | −7.5 | 4.9 | 9.2 | 5.2 | −11.7 |
| Personal interest payments | 0.0 | −1.8 | −21.3 | −8.2 | −14.4 | −12.1 | −7.8 | −9.1 | −6.7 |
| Definitional | 0.0 | 0.0 | 0.0 | 0.0 | 0.0 | 0.0 | 0.0 | 0.0 | 0.0 |
| Statistical | 0.0 | −1.8 | −21.3 | −8.2 | −14.4 | −12.1 | −7.8 | −9.1 | −6.7 |
| Improved measures of the implicit services of savings institutions and credit unions | 0.0 | −1.8 | −4.3 | −9.7 | −9.6 | −10.5 | −11.7 | −12.3 | −13.2 |
| Other statistical | 0.0 | 0.0 | −17.0 | 1.5 | −4.8 | −1.6 | 3.9 | 3.2 | 6.5 |
| Personal current transfer payments | 0.0 | 0.0 | −7.9 | −11.4 | −13.5 | −6.0 | −1.0 | −2.4 | −2.8 |
| Definitional | 0.0 | 0.0 | 0.0 | 0.0 | 0.0 | 0.0 | 0.0 | 0.0 | 0.0 |
| Statistical | 0.0 | 0.0 | −7.9 | −11.4 | −13.5 | −6.0 | −1.0 | −2.4 | −2.8 |
| Equals: Personal saving | 0.0 | 23.3 | 81.8 | 160.9 | 181.3 | 231.5 | 215.8 | 267.6 | 499.4 |
| Definitional | 0.0 | 0.0 | 0.8 | 1.6 | 1.6 | 1.6 | 1.5 | 1.6 | 1.7 |
| Introduction of capital services into own-account investment | 0.0 | 0.0 | 0.0 | 0.6 | 0.6 | 0.5 | 0.4 | 0.4 | 0.4 |
| Reclassification of software R&D | 0.0 | 0.0 | 0.8 | 1.0 | 1.0 | 1.1 | 1.1 | 1.2 | 1.3 |
| Reclassification of selected state taxes from personal taxes to taxes on production and imports | 0.0 | 0.0 | 0.0 | 0.0 | 0.0 | 0.0 | 0.0 | 0.0 | 0.0 |
| Statistical | 0.0 | 23.3 | 81.1 | 159.3 | 179.7 | 229.9 | 214.3 | 266.0 | 497.8 |
| Misreporting adjustment1 | 0.0 | 0.0 | 16.4 | 98.3 | 98.6 | 107.8 | 90.3 | … | … |
| Improved measures of the implicit services of savings institutions and credit unions | 0.0 | −1.8 | −2.0 | −10.9 | 2.1 | 5.9 | 7.5 | 14.1 | 12.5 |
| Measures of state and local defined benefit pension plans | 0.0 | 26.5 | 47.4 | 37.5 | 37.8 | 38.9 | 39.4 | 36.8 | 39.0 |
| Other statistical | 0.0 | −1.4 | 19.3 | 34.4 | 41.3 | 77.3 | 77.0 | 219.2 | 446.3 |
- Impacts of revised estimates of misreporting adjustment for 2016–2017 cannot be distinguished.
- Impact of revised estimate of misreporting adjustment for 2017 cannot be distinguished.
For 1982–2002, the upward revisions to personal income are largely due to large upward revisions to personal income receipts on assets that were partly offset by downward revisions to compensation of employees, to rental income of persons, and to proprietors’ income. For 2003–2009, the downward revisions to these components more than offset the upward revisions to personal income receipts. For 2010–2017, the net effects on aggregate personal income are once again upward, as revisions to proprietors’ income are upward and large.
Compensation of employees. This component consists of wages and salaries and of supplements to wages and salaries received by U.S. residents, including wages and salaries received from the rest of the world. The sources of revision to compensation, to wages and salaries, and to supplements are the same as those already discussed in the section “Compensation of employees, paid”; the slight difference in the revisions is because this aggregate includes wages and salaries received from the rest of the world and excludes wages and salaries paid to the rest of the world; the measure of compensation of employees, paid, includes wages and salaries paid to the rest of the world and excludes wages and salaries received from the rest of the world.
Proprietors’ income with IVA and CCAdj. The sources of revision to proprietors’ income are discussed above.
Personal income receipts on assets. Revisions to personal income receipts on assets are less than $5 billion and mostly upward until 1974. For 1974–2017, the revisions are upward and larger, reaching almost $190 billion for 2017. For most years until 2014, the revisions are mostly within personal interest income; the largest revision to personal interest income is nearly $71 billion for 2015 and revisions to personal dividend income are of mixed sign and less than $2 billion in absolute value. For 2014–2017, the revisions to personal dividend income are upward, and for 2016–2017, they exceed the upward revisions to personal interest income. The largest revision to personal dividend income, more than $143 billion, is for 2017.
The revisions are entirely statistical, and they are distributed between (1) the effects of introducing the reference rate approach for measures of implicit output, which result in downward revisions to personal interest income for 1946–2017, and (2) the use of the PBO method for state and local defined benefit pension plans, which results in upward revisions to personal interest income that more than offset the effects of the reference rate approach for most years. Beginning in 1997, the measures are also affected by the incorporation of newly available and revised source data, including Federal Reserve Board financial accounts data and IRS tabulations of income tax data for corporations and for sole proprietorships and partnerships.
Personal current transfer receipts. This aggregate consists of government social benefits to persons and of other current transfer payments to persons (net). Revisions are small and of mixed sign until 2003; for 2003–2015, revisions are mostly downward and less than $5 billion. For 2016–2017, revisions are upward and larger, almost $10 billion for both years. The revisions reflect the incorporation of new and revised source data for government social benefits and for business current transfer payments to persons.
Contributions for government social insurance, domestic. This component is deducted in the calculation of personal income and consists of both personal and employer contributions. The revisions are of mixed sign, and with the exception of 2016, the revisions are less than $5 billion in absolute value. The revisions are statistical and reflect new and revised source data, including revised Social Security Administration (SSA) data on wages that are subject to the Federal Insurance Contributions Act (FICA) and on self-employment contributions taxes and Treasury Department data on federal government receipts.
Personal current taxes. The revisions to personal current taxes are downward, with the exception of an upward revision of less than $1 billion for 2011. These downward revisions are less than $5 billion for all but 2016–2017 (over $5 billion and $14 billion, respectively). Revisions are distributed among federal and state and local government receipts.
For federal tax receipts, the revisions are statistical and result from the incorporation of revised and newly available source data, particularly revised SSA data and revised Treasury Department data. For state and local tax receipts, revisions are both definitional and statistical. The incorporation of revised and newly available source data, particularly revised Census Bureau government finances data and revised Census Bureau state government data, led to downward revisions for all but two years; for 2011 and 2014, upward revisions due to source data were less than $2 billion. The reclassification of selected state and local taxes from personal current taxes to taxes on production and imports resulted in downward revisions of less than $3 billion for 2007–2017.
Disposable personal income (DPI). The pattern of revisions to DPI (personal income less personal current taxes) largely reflects the revisions to personal income; revisions do not exceed $5 billion in absolute value until 1980. The largest upward revision, more than $415 billion, is for 2017; the largest downward revision, more than $59 billion, is for 2008.
Personal outlays. This component consists of personal consumption expenditures (PCE), personal interest payments, and personal current transfer payments. Revisions are downward and less than $5 billion until 1983. For 1983–2017, they are downward and generally increasing; they reach over $83 billion for 2017.
Until 1965, the revisions are within PCE (see the section on account 1 for details). Beginning with 1965, they also reflect downward revisions to personal interest payments. Beginning in 1999, downward revisions to personal current transfer payments to the rest of the world also contribute. For all years except 2009, the downward revisions to PCE far exceed the revisions to these other components. However, the downward revisions to personal interest payments increase and range between $17 billion and $22 billion for 2002–2017. (During this same period, with the exception of 2009, downward revisions to PCE range between $35 billion and $75 billion; for 2009, the downward revision is only about $5 billion). Revisions to personal current transfer payments are less than $10 billion for most years; for 2010–2013, downward revisions range between $10 and $14 billion.
The revisions are largely statistical, although the reclassification of selected state and local payroll taxes from personal current taxes to taxes on production and imports did lead to small revisions to PCE for 2009–2017. The effects on personal outlays of the introduction of the reference rate approach for the implicit output of savings banks and credit unions are more notable, with downward effects on PCE ranging from less than $1 billion (1946–1969) to nearly $65 billion (2017). This change in method also led to downward revisions for personal interest payments; the largest effect of this change, more than $13 billion, is for 2017. The downward revisions are also due to the incorporation of revised Federal Reserve Board data on consumer credit.
Personal saving. This component is the difference between DPI and personal outlays. The revisions are generally upward, and they do not exceed $5 billion until 1976; thereafter, personal saving is revised up for all years by generally increasing amounts (except for 2009, which was revised down less than $1 billion); the largest upward revision, more than $499 billion, is for 2017.
The revisions to personal saving result in corresponding revisions to the personal saving rate—personal saving as a percentage of DPI. The revisions to the saving rate exceed 1.0 percentage point by 2011 and peak at 3.3 percentage points for 2017.
Government current receipts and expenditures (account 4)
Government current receipts is the sum of current tax receipts, contributions for government social insurance, income receipts on assets, current transfer receipts, and current surplus of government enterprises. The measure of current expenditures is the sum of consumption expenditures, current transfer payments, interest payments, and subsidies. Net government saving is the difference between current receipts and current expenditures.
Federal government. Revisions to aggregate federal government current receipts are mostly upward and are less than $5 billion until 2016; for 2016, there is an upward revision of over $23 billion, and for 2017, there is a downward revision of about $29 billion (table 18).
| 1946 | 1987 | 2007 | 2012 | 2013 | 2014 | 2015 | 2016 | 2017 | |
|---|---|---|---|---|---|---|---|---|---|
| Federal | |||||||||
| Current receipts | 0.0 | 0.0 | 0.6 | 1.3 | 0.6 | 1.0 | 4.9 | 23.4 | −29.3 |
| Definitional | 0.0 | 0.0 | 0.0 | 0.0 | 0.0 | 0.0 | 0.0 | 0.0 | 0.0 |
| Reclassification of payments made by Federal Reserve banks to the U.S. government | 0.0 | 0.0 | 0.0 | 0.0 | 0.0 | 0.0 | 0.0 | 0.0 | 0.0 |
| Statistical | 0.0 | 0.0 | 0.6 | 1.3 | 0.6 | 1.0 | 4.9 | 23.4 | −29.3 |
| Improved measures of the implicit services of savings institutions and credit unions | 0.0 | 0.0 | 0.1 | 0.0 | 0.0 | 0.0 | 0.1 | 0.1 | 0.0 |
| Other statistical | 0.0 | 0.0 | 0.5 | 1.3 | 0.6 | 1.0 | 4.8 | 23.3 | −29.3 |
| Current expenditures | −0.1 | 2.6 | 1.1 | −10.2 | −5.3 | −7.4 | −12.9 | −8.8 | 1.7 |
| Definitional | 0.0 | 0.0 | 0.0 | 0.0 | 0.0 | 0.0 | 0.0 | 0.0 | 0.0 |
| Statistical | −0.1 | 2.6 | 1.1 | −10.2 | −5.3 | −7.4 | −12.9 | −8.8 | 1.7 |
| Improved measures of the implicit services of savings institutions and credit unions | 0.0 | 0.0 | 0.1 | 0.0 | 0.0 | 0.0 | 0.1 | 0.1 | 0.0 |
| Other statistical | −0.1 | 2.6 | 1.0 | −10.2 | −5.3 | −7.4 | −13.0 | −8.9 | 1.7 |
| Net federal government saving | 0.1 | −2.6 | −0.5 | 11.4 | 5.9 | 8.4 | 17.8 | 32.2 | −31.0 |
| Definitional | 0.0 | 0.0 | 0.0 | 0.0 | 0.0 | 0.0 | 0.0 | 0.0 | 0.0 |
| Reclassification of payments made by Federal Reserve banks to the U.S. government | 0.0 | 0.0 | 0.0 | 0.0 | 0.0 | 0.0 | 0.0 | 0.0 | 0.0 |
| Statistical | 0.1 | −2.6 | −0.5 | 11.4 | 5.9 | 8.4 | 17.8 | 32.2 | −31.0 |
| Improved measures of the implicit services of savings institutions and credit unions | 0.0 | 0.0 | 0.0 | 0.0 | 0.0 | 0.0 | 0.0 | 0.0 | 0.0 |
| Other statistical | 0.1 | −2.6 | −0.5 | 11.4 | 5.9 | 8.4 | 17.8 | 32.2 | −31.0 |
| State and local | |||||||||
| Current receipts | 0.0 | 0.6 | 1.5 | −0.9 | 8.8 | 22.7 | 18.0 | 5.7 | −6.1 |
| Definitional | 0.0 | 0.0 | 0.0 | 0.0 | 0.0 | 0.0 | 0.0 | 0.0 | 0.0 |
| Reclassification of selected state taxes from personal taxes to taxes on production and imports | 0.0 | 0.0 | 0.0 | 0.0 | 0.0 | 0.0 | 0.0 | 0.0 | 0.0 |
| Statistical | 0.0 | 0.6 | 1.5 | −0.9 | 8.8 | 22.7 | 18.0 | 5.7 | −6.1 |
| Improved measures of the implicit services of savings institutions and credit unions | 0.0 | 0.0 | 0.4 | 1.9 | 1.8 | 1.7 | 1.5 | 1.3 | 1.7 |
| Measures of state and local defined benefit pension plans | 0.0 | 0.5 | 3.1 | 2.7 | 0.7 | 0.9 | 0.9 | 1.1 | 1.1 |
| Other statistical | 0.0 | 0.1 | −2.0 | −5.5 | 6.3 | 20.1 | 15.6 | 3.4 | −8.9 |
| Current expenditures | 0.0 | 27.0 | 58.1 | 61.1 | 83.7 | 90.5 | 95.2 | 84.1 | 74.1 |
| Definitional | 0.0 | 0.0 | 0.0 | 0.0 | 0.0 | 0.0 | 0.0 | 0.0 | 0.0 |
| Statistical | 0.0 | 27.0 | 58.1 | 61.1 | 83.7 | 90.5 | 95.2 | 84.1 | 74.1 |
| Improved measures of the implicit services of savings institutions and credit unions | 0.0 | 0.0 | 0.4 | 1.9 | 1.8 | 1.8 | 1.5 | 1.3 | 1.6 |
| Measures of state and local defined benefit pension plans | 0.0 | 27.0 | 50.5 | 40.2 | 38.5 | 39.8 | 40.3 | 37.9 | 40.1 |
| Other statistical | 0.0 | 0.0 | 7.2 | 19.1 | 43.4 | 48.9 | 53.4 | 44.9 | 32.4 |
| Net state and local government saving | 0.0 | −26.4 | −56.6 | −62.0 | −74.9 | −67.8 | −77.2 | −78.4 | −80.2 |
| Definitional | 0.0 | 0.0 | 0.0 | 0.0 | 0.0 | 0.0 | 0.0 | 0.0 | 0.0 |
| Reclassification of selected state taxes from personal taxes to taxes on production and imports | 0.0 | 0.0 | 0.0 | 0.0 | 0.0 | 0.0 | 0.0 | 0.0 | 0.0 |
| Statistical | 0.0 | −26.4 | −56.6 | −62.0 | −74.9 | −67.8 | −77.2 | −78.4 | −80.2 |
| Measures of state and local defined benefit pension plans | 0.0 | −26.5 | −47.5 | −37.4 | −37.8 | −38.9 | −39.4 | −36.8 | −39.0 |
| Improved measures of the implicit services of savings institutions and credit unions | 0.0 | 0.0 | 0.0 | 0.0 | 0.0 | 0.0 | 0.0 | 0.0 | 0.0 |
| Other statistical | 0.0 | 0.1 | −9.1 | −24.6 | −37.1 | −28.8 | −37.8 | −41.6 | −41.2 |
Until 1998, the upward revisions are within interest receipts and are due entirely to the statistical improvement of the measures of the implicit output of savings banks and credit unions. For 1999–2017, the incorporation of newly available and revised source data is an additional source of revision across spending components; for 2016–2017, the effects of source data are over $20 billion in absolute value. (The reclassification of payments by the Federal Reserve from corporate taxes to dividends led to perfectly offsetting revisions to current tax receipts and to income receipts on assets starting with 1947.).
Federal government current expenditures are revised by less than $5 billion until 2008. For 2008–2017, revisions are of mixed sign and less than $10 billion in absolute value for most years; there are larger revisions for 2012 and 2015 (about –$10 billion and almost –$13 billion, respectively).
Until 2002, the revisions are almost entirely attributable to federal consumption expenditures. From 2002–2017, revisions of more than $1 billion in absolute value also affect federal current transfer payments and payments of interest.
The revisions are in large part due to the incorporation of newly available and revised source data; the improved measures of the implicit output of savings banks and credit unions have upward effects on federal consumption expenditures of less than $1 billion for 1993–2017. Source data include newly available and revised OMB data on the federal budget and BEA’s 2012 benchmark I-O accounts.
The pattern of revisions to federal government net saving follows that of expenditures until 1993; at that point, revisions to current receipts are also reflected. Revisions to saving are mostly downward and less than $5 billion until 2010, with the exception of a small upward revision in 1999. For 2010–2016, revisions are upward and range between about $2 billion and about $32 billion (2016). The largest downward revision, about $31 billion, is for 2017.
State and local government. Revisions to state and local current receipts are of mixed sign and less than $10 billion in absolute value until 2014; they are upward and larger (between $5 billion and $23 billion) for 2013–2016. For 2017, the revision is downward and just over $6 billion.
The revisions are generally distributed among the components of state and local receipts and are entirely statistical (the reclassification of selected state and local taxes from personal current taxes to taxes on production and imports have perfectly offsetting effects on these two components). The switch to the PBO method for measures of state and local defined benefit pension plans had upward effects of less than $5 billion on the current surplus of government enterprises, and starting with 1993, upward revisions to interest receipts, due to the new estimating method for the implicit output of savings banks and credit unions, also contributed, with effects of less than $3 billion. The incorporation of newly available and revised source data, primarily from the Census Bureau, also led to small revisions of mixed sign; these effects are larger in more recent years.
State and local government current expenditures is revised upward less than $10 billion until 1980; thereafter, revisions steadily increase to a peak of about $95 billion for 2015.
The revisions to current expenditures, which are entirely statistical, are in large part due to the effects on expenditures of the PBO method, which decreased state and local government compensation costs (and thus consumption expenditures) and increased state and local government interest payments. The effects of the switch to the PBO method are largely offsetting until 1959; thereafter, the upward effects on interest payments outweigh the downward effects on compensation. The net effects steadily increase, reaching a peak of almost $61 billion for 2002 before falling; they are about $40 billion for 2017. The improved measures of the implicit output of credit unions and savings banks also had upward effects beginning in 1993; these effects are small (less than $3 billion). Newly available and revised source data resulted in revisions of mixed sign that are less than $5 billion in absolute value until 2007. For 2007–2017, these revisions are upward and increasing in most years; the largest upward revision due to source data, more than $54 billion, is for 2015.
State and local government net saving is revised down less than $5 billion until 1975; thereafter, the downward revisions are generally increasing. The largest downward revision, about $80 billion, is for 2017.
Foreign transactions (accounts 5 and 7)
Current receipts from the rest of the world. This aggregate consists of exports of goods and services and income receipts from the rest of the world. The revisions to exports of goods and services were discussed above. The revisions to income receipts, which begin with 1999, are due to the incorporation of revised source data from the ITAs. Revisions are downward for 1999–2013; the largest downward revision, more than $12 billion, is for 2006. For 2014–2017, revisions are upward; the largest upward revision, more than $26 billion, is for 2015 (table 19). See the box “Discontinuities in the Estimates of Foreign Transactions in the National Income and Product Accounts.”
| 1946 | 1987 | 2007 | 2012 | 2013 | 2014 | 2015 | 2016 | 2017 | |
|---|---|---|---|---|---|---|---|---|---|
| Current receipts from the rest of the world | 0.0 | 0.0 | −13.3 | −9.6 | −6.0 | 4.9 | 31.1 | 20.5 | 33.0 |
| Definitional | 0.0 | 0.0 | 0.0 | 0.0 | 0.0 | 0.0 | 0.0 | 0.0 | 0.0 |
| Statistical | 0.0 | 0.0 | −13.3 | −9.6 | −6.0 | 4.9 | 31.1 | 20.5 | 33.0 |
| Source of revision by component | 0.0 | 0.0 | 0.0 | 0.0 | 0.0 | 0.0 | 0.0 | 0.0 | 0.0 |
| Exports of goods and services | 0.0 | 0.0 | −3.8 | −6.9 | −3.2 | −2.6 | 0.1 | 3.0 | 6.2 |
| Exports of goods | 0.0 | 0.0 | −5.1 | −4.4 | −3.5 | −3.0 | −2.9 | −3.4 | −11.0 |
| Definitional | 0.0 | 0.0 | 0.0 | 0.0 | 0.0 | 0.0 | 0.0 | 0.0 | 0.0 |
| Statistical | 0.0 | 0.0 | −5.1 | −4.4 | −3.5 | −3.0 | −2.9 | −3.4 | −11.0 |
| Exports of services | 0.0 | 0.0 | 1.4 | −2.5 | 0.3 | 0.4 | 3.0 | 6.4 | 17.1 |
| Definitional | 0.0 | 0.0 | 0.0 | 0.0 | 0.0 | 0.0 | 0.0 | 0.0 | 0.0 |
| Statistical | 0.0 | 0.0 | 1.4 | −2.5 | 0.3 | 0.4 | 3.0 | 6.4 | 17.1 |
| Improved measures of the implicit services of savings institutions and credit unions | 0.0 | 0.0 | 1.0 | 0.5 | 0.4 | 0.4 | 0.4 | 0.4 | 0.5 |
| Other statistical | 0.0 | 0.0 | 0.4 | −3.0 | −0.1 | 0.0 | 2.6 | 6.0 | 16.6 |
| Income receipts | 0.0 | 0.0 | −9.1 | −1.8 | −2.1 | 7.0 | 26.4 | 14.9 | 22.4 |
| Definitional | 0.0 | 0.0 | 0.0 | 0.0 | 0.0 | 0.0 | 0.0 | 0.0 | 0.0 |
| Statistical | 0.0 | 0.0 | −9.1 | −1.8 | −2.1 | 7.0 | 26.4 | 14.9 | 22.4 |
| Current taxes, contributions for government social insurance, and transfer receipts from the rest of the world | 0.0 | 0.0 | −0.5 | −0.9 | −0.7 | 0.5 | 4.5 | 2.6 | 4.4 |
| Definitional | 0.0 | 0.0 | 0.0 | 0.0 | 0.0 | 0.0 | 0.0 | 0.0 | 0.0 |
| Statistical | 0.0 | 0.0 | −0.5 | −0.9 | −0.7 | 0.5 | 4.5 | 2.6 | 4.4 |
| Current payments to the rest of the world | 0.0 | 0.0 | −20.7 | −29.6 | −23.6 | −3.6 | 4.5 | 5.4 | 20.5 |
| Definitional | 0.0 | 0.0 | 0.0 | 0.0 | 0.0 | 0.0 | 0.0 | 0.0 | 0.0 |
| Statistical | 0.0 | 0.0 | −20.7 | −29.6 | −23.6 | −3.6 | 4.5 | 5.4 | 20.5 |
| Source of revision by component | 0.0 | 0.0 | 0.0 | 0.0 | 0.0 | 0.0 | 0.0 | 0.0 | 0.0 |
| Imports of goods and services | 0.0 | 0.0 | −3.9 | −4.0 | −4.4 | −3.9 | −2.5 | 2.3 | 13.0 |
| Definitional | 0.0 | 0.0 | 0.0 | 0.0 | 0.0 | 0.0 | 0.0 | 0.0 | 0.0 |
| Statistical | 0.0 | 0.0 | −3.9 | −4.0 | −4.4 | −3.9 | −2.5 | 2.3 | 13.0 |
| Income payments | 0.0 | 0.0 | 7.5 | 3.4 | 11.4 | −0.1 | 4.7 | −3.4 | −4.5 |
| Definitional | 0.0 | 0.0 | 0.0 | 0.0 | 0.0 | 0.0 | 0.0 | 0.0 | 0.0 |
| Statistical | 0.0 | 0.0 | 7.5 | 3.4 | 11.4 | −0.1 | 4.7 | −3.4 | −4.5 |
| Improved measures of the implicit services of savings institutions and credit unions | 0.0 | 0.0 | 1.0 | 0.5 | 0.4 | 0.4 | 0.4 | 0.4 | 0.5 |
| Other statistical | 0.0 | 0.0 | 6.5 | 2.9 | 11.0 | −0.5 | 4.3 | −3.8 | −5.0 |
| Current taxes and transfer payments to the rest of the world (net) | 0.0 | 0.0 | −24.3 | −29.1 | −30.6 | 0.5 | 2.4 | 6.4 | 11.9 |
| Definitional | 0.0 | 0.0 | 0.0 | 0.0 | 0.0 | 0.0 | 0.0 | 0.0 | 0.0 |
| Statistical | 0.0 | 0.0 | −24.3 | −29.1 | −30.6 | 0.5 | 2.4 | 6.4 | 11.9 |
| Balance on current account, NIPAs | 0.0 | 0.0 | 7.4 | 20.0 | 17.5 | 8.4 | 26.5 | 15.1 | 12.5 |
| Definitional | 0.0 | 0.0 | 0.0 | 0.0 | 0.0 | 0.0 | 0.0 | 0.0 | 0.0 |
| Statistical | 0.0 | 0.0 | 7.4 | 20.0 | 17.6 | 8.5 | 26.6 | 15.1 | 12.5 |
| Improved measures of the implicit services of savings institutions and credit unions | 0.0 | 0.0 | 0.0 | 0.0 | 0.0 | 0.0 | 0.0 | 0.0 | 0.0 |
| Other statistical | 0.0 | 0.0 | 6.4 | 19.5 | 17.2 | 8.1 | 26.2 | 14.7 | 12.0 |
| Addenda: | |||||||||
| Net lending or borrowing, NIPAs | 0.0 | 0.0 | 7.4 | 20.1 | 17.6 | 8.4 | 26.5 | 15.1 | 12.4 |
| Balance on current account, NIPAs | 0.0 | 0.0 | 7.4 | 20.0 | 17.5 | 8.4 | 26.5 | 15.1 | 12.5 |
| Definitional | 0.0 | 0.0 | 0.0 | 0.0 | 0.0 | 0.0 | 0.0 | 0.0 | 0.0 |
| Statistical | 0.0 | 0.0 | 7.4 | 20.0 | 17.5 | 8.4 | 26.5 | 15.1 | 12.5 |
| Less: Capital account transactions, (net) | 0.0 | 0.0 | 0.0 | 0.0 | 0.0 | 0.0 | 0.0 | 0.0 | 0.1 |
| Definitional | 0.0 | 0.0 | 0.0 | 0.0 | 0.0 | 0.0 | 0.0 | 0.0 | 0.0 |
| Statistical | 0.0 | 0.0 | 0.0 | 0.0 | 0.0 | 0.0 | 0.0 | 0.0 | 0.1 |
Current payments to the rest of the world (net). This aggregate consists of imports of goods and services, income payments, and current taxes and transfer payments to the rest of the world (net). The revisions to imports of goods and services were discussed above. The revisions to income payments begin with 1993 and are entirely statistical for the entire period; they are upward in most years through 2015. Revisions are downward for 2016–2017. The largest upward revision, more than $11 billion, is for 2013; the largest downward revision, more than $4 billion, is for 2017.
For 1993–1998, revisions are due entirely to the improved measurement of the implicit output of savings banks and credit unions; these revisions are upward and small. Upward effects of the incorporation of revised source data from the ITAs, starting with 1999, far surpass them by 2002.
Revisions to current taxes and transfer payments to the rest of the world (net) are very small until 1999, when revised data from the ITAs are incorporated. For 1999–2013, revisions are downward and generally increasing, reaching over –$30 billion for 2013. For 2014–2017, the revisions are upward and smaller; the largest upward revision, almost $12 billion, is for 2017.
Saving and investment (account 6)
Gross saving consists of net saving and consumption of fixed capital. Net saving consists of net private saving and net government saving (table 20). The revisions to gross saving are of mixed sign and are $5 billion or less until 1999. From 1999–2007, revisions are upward and reach a peak of over $36 billion for 2007. For 2008–2009, revisions are downward and large (almost $60 billion for 2009), and for 2010–2017, they are upward and large, reaching a peak of about $295 billion for 2017 (table 20).
| 1946 | 1987 | 2007 | 2012 | 2013 | 2014 | 2015 | 2016 | 2017 | |
|---|---|---|---|---|---|---|---|---|---|
| Gross saving | 0.0 | −3.3 | 36.3 | 174.8 | 167.7 | 207.5 | 157.3 | 129.3 | 295.2 |
| Definitional | 0.0 | 0.0 | 0.0 | 11.1 | 11.9 | 12.4 | 13.2 | 13.8 | 14.4 |
| Introduction of capital services into own-account investment | 0.0 | 0.0 | 0.0 | 11.2 | 11.9 | 12.4 | 13.2 | 13.8 | 14.4 |
| Reclassification of software R&D | 0.0 | 0.0 | 0.0 | 0.0 | 0.0 | 0.0 | 0.0 | 0.0 | 0.0 |
| Reclassification of selected state taxes from personal taxes to taxes on production and imports | 0.0 | 0.0 | 0.0 | 0.0 | 0.0 | 0.0 | 0.0 | 0.0 | 0.0 |
| Reclassification of payments made by Federal Reserve banks to the U.S. government | 0.0 | 0.0 | 0.0 | 0.0 | 0.0 | 0.0 | 0.0 | 0.0 | 0.0 |
| Statistical | 0.0 | −3.3 | 36.3 | 163.7 | 155.8 | 195.1 | 144.1 | 115.5 | 280.8 |
| Misreporting adjustment1 | 0.0 | 0.0 | 16.4 | 98.3 | 98.6 | 107.8 | 90.3 | … | … |
| Improved measures of the implicit services of savings institutions and credit unions | 0.0 | −1.8 | −2.0 | −10.9 | 2.1 | 5.9 | 7.5 | 14.1 | 12.5 |
| Measures of state and local defined benefit pension plans | 0.0 | 0.0 | 0.0 | 0.0 | 0.0 | 0.0 | 0.0 | 0.0 | 0.0 |
| Other statistical | 0.0 | −1.5 | 21.9 | 76.2 | 55.1 | 81.5 | 46.2 | 101.4 | 268.3 |
| Source of revision by component | |||||||||
| Net saving | 0.1 | −5.7 | 47.8 | 133.0 | 115.4 | 138.6 | 81.4 | 55.5 | 213.8 |
| Net private saving | 0.0 | 23.3 | 104.9 | 183.6 | 184.4 | 198.0 | 140.9 | 101.7 | 325.0 |
| Undistributed corporate profits with IVA and CCAdj | 0.0 | 0.0 | 23.0 | 22.7 | 3.1 | −33.5 | −74.9 | −165.9 | −174.5 |
| Definitional | 0.0 | 0.0 | 7.7 | 14.5 | 14.2 | 13.8 | 14.1 | 14.3 | 14.4 |
| Introduction of capital services into own-account investment | 0.0 | 0.0 | 0.0 | 5.7 | 4.9 | 4.2 | 3.9 | 3.5 | 3.1 |
| Reclassification of software R&D | 0.0 | 0.0 | 7.7 | 8.8 | 9.3 | 9.6 | 10.2 | 10.8 | 11.3 |
| Reclassification of selected state taxes from personal taxes to taxes on production and imports | 0.0 | 0.0 | 0.0 | 0.0 | 0.0 | 0.0 | 0.0 | 0.0 | 0.0 |
| Statistical | 0.0 | 0.0 | 15.3 | 8.2 | −11.1 | −47.3 | −89.0 | −180.2 | −188.9 |
| Personal saving | 0.0 | 23.3 | 81.8 | 160.9 | 181.3 | 231.5 | 215.8 | 267.6 | 499.4 |
| Definitional | 0.0 | 0.0 | 0.8 | 1.6 | 1.6 | 1.6 | 1.5 | 1.6 | 1.7 |
| Introduction of capital services into own-account investment | 0.0 | 0.0 | 0.0 | 0.6 | 0.6 | 0.5 | 0.4 | 0.4 | 0.4 |
| Reclassification of software R&D | 0.0 | 0.0 | 0.8 | 1.0 | 1.0 | 1.1 | 1.1 | 1.2 | 1.3 |
| Reclassification of selected state taxes from personal taxes to taxes on production and imports | 0.0 | 0.0 | 0.0 | 0.0 | 0.0 | 0.0 | 0.0 | 0.0 | 0.0 |
| Statistical | 0.0 | 23.3 | 81.0 | 159.3 | 179.7 | 229.9 | 214.3 | 266.0 | 497.8 |
| Misreporting adjustment1 | 0.0 | 0.0 | 16.4 | 98.3 | 98.6 | 107.8 | 90.3 | … | … |
| Improved measures of the implicit services of savings institutions and credit unions | 0.0 | −1.8 | −2.0 | −10.9 | 2.1 | 5.9 | 7.5 | 14.1 | 12.5 |
| Measures of state and local defined benefit pension plans | 0.0 | 26.5 | 47.4 | 37.5 | 37.8 | 38.9 | 39.4 | 36.8 | 39.0 |
| Other statistical | 0.0 | −1.4 | 19.2 | 34.4 | 41.3 | 77.3 | 77.0 | 215.1 | 446.3 |
| Net government saving | 0.1 | −29.0 | −57.0 | −50.6 | −69.0 | −59.4 | −59.5 | −46.2 | −111.2 |
| Definitional | 0.0 | 0.0 | 0.0 | 0.0 | 0.0 | 0.0 | 0.0 | 0.0 | 0.0 |
| Reclassification of selected state taxes from personal taxes to taxes on production and imports | 0.0 | 0.0 | 0.0 | 0.0 | 0.0 | 0.0 | 0.0 | 0.0 | 0.0 |
| Reclassification of payments made by Federal Reserve banks to the U.S. government | 0.0 | 0.0 | 0.0 | 0.0 | 0.0 | 0.0 | 0.0 | 0.0 | 0.0 |
| Statistical | 0.1 | −29.0 | −57.0 | −50.6 | −69.0 | −59.4 | −59.5 | −46.2 | −111.2 |
| Improved measures of the implicit services of savings institutions and credit unions | 0.0 | 0.0 | 0.0 | 0.0 | 0.0 | 0.0 | 0.0 | 0.0 | 0.0 |
| Measures of state and local defined benefit pension plans | 0.0 | −26.5 | −47.5 | −37.4 | −37.8 | −38.9 | −39.4 | −36.8 | −39.0 |
| Other statistical | 0.1 | −2.5 | −9.5 | −13.2 | −31.2 | −20.4 | −20.1 | −9.4 | −72.2 |
| Consumption of fixed capital | −0.1 | 2.4 | −11.5 | 41.8 | 52.3 | 68.9 | 75.9 | 73.8 | 81.5 |
| Definitional | 0.0 | 0.0 | −8.5 | −5.0 | −3.9 | −3.0 | −2.4 | −2.1 | −1.7 |
| Introduction of capital services into own-account investment | 0.0 | 0.0 | 0.0 | 4.9 | 6.4 | 7.7 | 8.9 | 9.9 | 10.9 |
| Reclassification of software R&D | 0.0 | 0.0 | −8.5 | −9.8 | −10.3 | −10.7 | −11.3 | −12.0 | −12.6 |
| Statistical | −0.1 | 2.4 | −3.0 | 46.8 | 56.2 | 71.9 | 78.3 | 75.9 | 83.2 |
| Gross domestic investment, capital account transactions, and net lending, NIPAs | 0.0 | 0.0 | 36.5 | 136.7 | 145.3 | 138.4 | 158.3 | 149.5 | 189.2 |
| Gross domestic investment | −0.1 | 0.0 | 29.1 | 116.6 | 127.8 | 130.0 | 131.8 | 134.4 | 176.7 |
| Gross private domestic investment | −0.1 | 0.0 | 29.3 | 110.1 | 119.7 | 122.5 | 118.4 | 112.7 | 155.1 |
| Definitional | 0.0 | 0.0 | 0.0 | 11.2 | 11.9 | 12.4 | 13.2 | 13.8 | 14.4 |
| Introduction of capital services into own-account investment | 0.0 | 0.0 | 0.0 | 11.2 | 11.9 | 12.4 | 13.2 | 13.8 | 14.4 |
| Reclassification of software R&D | 0.0 | 0.0 | 0.0 | 0.0 | 0.0 | 0.0 | 0.0 | 0.0 | 0.0 |
| Statistical | −0.1 | 0.0 | 29.3 | 98.9 | 107.8 | 110.1 | 105.2 | 98.9 | 140.7 |
| Gross government investment | 0.0 | 0.0 | −0.2 | 6.6 | 8.1 | 7.5 | 13.4 | 21.8 | 21.6 |
| Definitional | 0.0 | 0.0 | 0.0 | 0.0 | 0.0 | 0.0 | 0.0 | 0.0 | 0.0 |
| Statistical | 0.0 | 0.0 | −0.2 | 6.6 | 8.1 | 7.5 | 13.4 | 21.8 | 21.6 |
| Capital account transactions, (net) | 0.0 | 0.0 | 0.0 | 0.0 | 0.0 | 0.0 | 0.0 | 0.0 | 0.1 |
| Definitional | 0.0 | 0.0 | 0.0 | 0.0 | 0.0 | 0.0 | 0.0 | 0.0 | 0.0 |
| Statistical | 0.0 | 0.0 | 0.0 | 0.0 | 0.0 | 0.0 | 0.0 | 0.0 | 0.1 |
| Net lending or borrowing (−), NIPAs | 0.0 | 0.0 | 7.4 | 20.1 | 17.6 | 8.4 | 26.5 | 15.1 | 12.4 |
| Definitional | 0.0 | 0.0 | 0.0 | 0.0 | 0.0 | 0.0 | 0.0 | 0.0 | 0.0 |
| Statistical | 0.0 | 0.0 | 7.4 | 20.1 | 17.6 | 8.4 | 26.5 | 15.1 | 12.4 |
| Statistical discrepancy | 0.0 | 3.3 | 0.2 | −38.1 | −22.4 | −69.1 | 1.0 | 20.2 | −106.0 |
- Impacts of revised estimates of misreporting adjustment for 2016–2017 cannot be distinguished.
Within net saving, revisions to net private saving and to net government saving are both downward until 1999, with the revisions to net government saving much larger. For 1999–2007 and 2010–2017, revisions to net private saving are upward and more than offset the downward revisions to net government saving; for 2008–2009, the downward revisions to net government saving more than offset the upward revisions to net private saving.
Revisions to CFC are discussed in the section on account 1.
“Net lending or net borrowing, NIPAs” (or “net lending”) is the difference between the sum of gross saving and the statistical discrepancy and the sum of gross domestic investment and capital account transactions (net).
The revisions to net lending are downward but less than $1 billion until 1999. For 1999–2017, revisions are upward and of varying size; the largest upward revision, more than $26 billion, is for 2015.
Real GDP
Revisions to year-to-year growth rates of real GDP are generally small; in 84 of the 89 years revisions ranged from –0.1 to 0.1 percentage point. The largest revision, for 2009, was 0.3 percentage point. (table 21).
| Size of revision (percentage point) | Number of revisions |
|---|---|
| −0.1 | 11 |
| 0.0 | 63 |
| 0.1 | 10 |
| 0.2 | 3 |
| 0.3 | 1 |
Revisions to real GDP result from the following:
- Revisions to the current-dollar components of GDP, such as those discussed above, for which chained-dollar estimates are prepared by deflation
- Revisions to the prices used to estimate components of real GDP by deflation
- Revisions to the quantities used to estimate the components of real GDP by extrapolation or direct valuation
In contrast, changing the reference year (to 2012 from 2009) does not affect the percent changes in real GDP. (It also does not affect the percent changes in the price indexes.)
For 14 years, the rates of growth of real GDP are revised up (table 22). For 4 of these years, the revisions are greater than 0.1 percentage point. Upward revisions to the percent change in current-dollar GDP play a role in three of these revisions, and downward revisions to the percent change in prices played a role in the fourth.
| 1929–2017 | 1929–1959 | 1959–2007 | 2007–2017 | |
|---|---|---|---|---|
| In percentage points: | ||||
| Average revision | 0.0 | 0.0 | 0.0 | 0.1 |
| Average absolute revision | 0.0 | 0.0 | 0.0 | 0.1 |
| Largest negative revision | −0.1 | −0.1 | −0.1 | −0.1 |
| Largest positive revision | 0.3 | 0.1 | 0.2 | 0.3 |
| Number of: | ||||
| Upward revisions | 14 | 1 | 8 | 5 |
| Downward revisions | 11 | 2 | 7 | 2 |
| Zero revisions | 63 | 27 | 33 | 3 |
For 11 years, the rates of growth of real GDP are revised down; none of the revisions are larger than 0.1 percentage point.
For 63 years, the rates of growth of real GDP are unrevised.
For 1929–2017, the average annual growth rate of real GDP is unrevised at 3.2 percent (table 23). Table 23 provides information on three subperiods. For 1929–1959 and 1959–2007, the average growth rate of real GDP is the same as in the previously published estimates. For 2007–2017, the average rate of growth of real GDP is revised up 0.1 percentage point (from 1.4 percent to 1.5 percent).
| Current dollars | Chained dollars | Current dollars | Chained dollars | Current dollars | Chained dollars | Current dollars | Chained dollars | |||||||||||||||||
|---|---|---|---|---|---|---|---|---|---|---|---|---|---|---|---|---|---|---|---|---|---|---|---|---|
| Revised | Previously published | Revision | Revised | Previously published | Revision | Revised | Previously published | Revision | Revised | Previously published | Revision | Revised | Previously published | Revision | Revised | Previously published | Revision | Revised | Previously published | Revision | Revised | Previously published | Revision | |
| 1929–2017 | 1929–1959 | 1959–2007 | 2007–2017 | |||||||||||||||||||||
| Gross domestic product | 6.1 | 6.1 | 0.0 | 3.2 | 3.2 | 0.0 | 5.5 | 5.5 | 0.0 | 3.6 | 3.6 | 0.0 | 7.2 | 7.2 | 0.0 | 3.4 | 3.4 | 0.0 | 3.0 | 3.0 | 0.0 | 1.5 | 1.4 | 0.1 |
| Personal consumption expenditures | 6.0 | 6.0 | 0.0 | 3.1 | 3.1 | 0.0 | 4.8 | 4.8 | 0.0 | 2.9 | 2.9 | 0.0 | 7.4 | 7.4 | 0.0 | 3.6 | 3.6 | 0.0 | 3.2 | 3.2 | 0.0 | 1.7 | 1.7 | 0.0 |
| Goods | 5.3 | 5.3 | 0.0 | 3.1 | 3.1 | 0.0 | 4.7 | 4.7 | 0.0 | 2.7 | 2.7 | 0.0 | 6.4 | 6.4 | 0.0 | 3.6 | 3.6 | 0.0 | 2.1 | 2.5 | −0.4 | 2.0 | 2.3 | −0.3 |
| Durable goods | 5.8 | 5.9 | −0.1 | 4.6 | 4.6 | 0.0 | 5.2 | 5.2 | 0.0 | 3.2 | 3.2 | 0.0 | 7.1 | 7.1 | 0.0 | 5.7 | 5.6 | 0.1 | 1.7 | 2.2 | −0.5 | 3.7 | 4.1 | −0.4 |
| Nondurable goods | 5.1 | 5.2 | −0.1 | 2.4 | 2.5 | −0.1 | 4.5 | 4.5 | 0.0 | 2.5 | 2.5 | 0.0 | 6.1 | 6.1 | 0.0 | 2.6 | 2.6 | 0.0 | 2.4 | 2.6 | −0.2 | 1.2 | 1.4 | −0.2 |
| Services | 6.6 | 6.6 | 0.0 | 3.2 | 3.2 | 0.0 | 5.0 | 5.0 | 0.0 | 3.1 | 3.2 | −0.1 | 8.2 | 8.2 | 0.0 | 3.6 | 3.7 | −0.1 | 3.8 | 3.6 | 0.2 | 1.6 | 1.4 | 0.2 |
| Gross private domestic investment | 6.2 | 6.1 | 0.1 | 3.8 | 3.7 | 0.1 | 5.5 | 5.5 | 0.0 | 3.6 | 3.6 | 0.0 | 7.4 | 7.4 | 0.0 | 4.3 | 4.3 | 0.0 | 2.3 | 2.0 | 0.3 | 1.8 | 1.1 | 0.7 |
| Fixed investment | 6.3 | 6.2 | 0.1 | 3.5 | 3.4 | 0.1 | 5.7 | 5.7 | 0.0 | 2.9 | 2.8 | 0.1 | 7.5 | 7.5 | 0.0 | 4.3 | 4.2 | 0.1 | 2.4 | 2.1 | 0.3 | 1.7 | 1.1 | 0.6 |
| Nonresidential | 6.3 | 6.3 | 0.0 | 3.9 | 3.8 | 0.1 | 5.2 | 5.2 | 0.0 | 2.4 | 2.4 | 0.0 | 7.8 | 7.8 | 0.0 | 5.2 | 5.1 | 0.1 | 2.9 | 2.5 | 0.4 | 2.5 | 1.7 | 0.8 |
| Structures | 5.4 | 5.4 | 0.0 | 1.4 | 1.4 | 0.0 | 4.1 | 4.1 | 0.0 | 1.0 | 1.0 | 0.0 | 7.2 | 7.1 | 0.1 | 2.1 | 2.1 | 0.0 | 1.4 | 1.2 | 0.2 | −0.9 | −0.8 | −0.1 |
| Equipment | 6.3 | 6.2 | 0.1 | 4.6 | 4.4 | 0.2 | 5.6 | 5.6 | 0.0 | 2.9 | 2.9 | 0.0 | 7.5 | 7.4 | 0.1 | 6.1 | 5.9 | 0.2 | 2.6 | 2.2 | 0.4 | 3.2 | 2.0 | 1.2 |
| Intellectual property products | 8.6 | 8.6 | 0.0 | 6.4 | 6.2 | 0.2 | 8.5 | 8.5 | 0.0 | 6.1 | 5.9 | 0.2 | 9.6 | 9.6 | 0.0 | 7.0 | 6.9 | 0.1 | 4.6 | 3.9 | 0.7 | 4.3 | 3.3 | 1.0 |
| Residential | 6.1 | 6.1 | 0.0 | 2.3 | 2.3 | 0.0 | 6.7 | 6.7 | 0.0 | 3.6 | 3.6 | 0.0 | 6.9 | 6.9 | 0.0 | 2.2 | 2.2 | 0.0 | 0.9 | 0.8 | 0.1 | −0.9 | −0.9 | 0.0 |
| Change in private inventories | ||||||||||||||||||||||||
| Net exports of goods and services | ||||||||||||||||||||||||
| Exports | 7.0 | 7.0 | 0.0 | 4.7 | 4.6 | 0.1 | 4.6 | 4.6 | 0.0 | 2.7 | 2.7 | 0.0 | 9.4 | 9.4 | 0.0 | 6.3 | 6.3 | 0.0 | 3.5 | 3.5 | 0.0 | 3.0 | 2.9 | 0.1 |
| Goods | 6.6 | 6.7 | −0.1 | 4.6 | 4.6 | 0.0 | 3.8 | 3.8 | 0.0 | 2.1 | 2.1 | 0.0 | 9.3 | 9.3 | 0.0 | 6.6 | 6.5 | 0.1 | 2.8 | 2.9 | −0.1 | 2.9 | 2.9 | 0.0 |
| Services | 8.6 | 8.5 | 0.1 | 5.2 | 5.1 | 0.1 | 8.2 | 8.2 | 0.0 | 5.1 | 5.1 | 0.0 | 9.6 | 9.5 | 0.1 | 5.7 | 5.5 | 0.2 | 5.0 | 4.8 | 0.2 | 3.3 | 3.1 | 0.2 |
| Imports | 7.4 | 7.4 | 0.0 | 4.7 | 4.6 | 0.1 | 4.7 | 4.7 | 0.0 | 2.8 | 2.8 | 0.0 | 10.2 | 10.2 | 0.0 | 6.4 | 6.4 | 0.0 | 2.1 | 2.0 | 0.1 | 2.3 | 1.8 | 0.5 |
| Goods | 7.4 | 7.4 | 0.0 | 4.8 | 4.7 | 0.1 | 4.2 | 4.2 | 0.0 | 2.2 | 2.2 | 0.0 | 10.7 | 10.7 | 0.0 | 7.0 | 6.9 | 0.1 | 1.8 | 1.7 | 0.1 | 2.2 | 1.7 | 0.5 |
| Services | 7.3 | 7.3 | 0.0 | 4.4 | 4.3 | 0.1 | 6.4 | 6.4 | 0.0 | 4.6 | 4.6 | 0.0 | 8.7 | 8.7 | 0.0 | 4.6 | 4.5 | 0.1 | 3.8 | 3.5 | 0.3 | 2.7 | 2.3 | 0.4 |
| Government consumption expenditures and gross investment | 6.9 | 6.9 | 0.0 | 3.3 | 3.3 | 0.0 | 8.7 | 8.7 | 0.0 | 6.1 | 6.2 | −0.1 | 6.8 | 6.8 | 0.0 | 2.2 | 2.3 | −0.1 | 1.9 | 1.8 | 0.1 | 0.0 | 0.0 | 0.0 |
| Federal | 7.7 | 7.7 | 0.0 | 4.3 | 4.4 | −0.1 | 12.9 | 13.0 | −0.1 | 10.2 | 10.4 | −0.2 | 5.7 | 5.7 | 0.0 | 1.6 | 1.6 | 0.0 | 1.9 | 1.8 | 0.1 | 0.4 | 0.3 | 0.1 |
| National defense | 7.7 | 7.8 | −0.1 | 4.4 | 4.5 | −0.1 | 14.5 | 14.6 | −0.1 | 11.8 | 11.9 | −0.1 | 5.2 | 5.1 | 0.1 | 1.0 | 1.0 | 0.0 | 0.9 | 0.9 | 0.0 | −0.4 | −0.4 | 0.0 |
| Nondefense | 7.6 | 7.6 | 0.0 | 4.2 | 4.2 | 0.0 | 9.4 | 9.4 | 0.0 | 6.5 | 6.6 | −0.1 | 7.3 | 7.3 | 0.0 | 3.2 | 3.2 | 0.0 | 3.5 | 3.4 | 0.1 | 1.7 | 1.6 | 0.1 |
| State and local | 6.6 | 6.6 | 0.0 | 2.6 | 2.5 | 0.1 | 6.0 | 6.1 | −0.1 | 2.9 | 2.9 | 0.0 | 7.9 | 7.9 | 0.0 | 2.9 | 2.9 | 0.0 | 1.9 | 1.8 | 0.1 | −0.2 | −0.3 | 0.1 |
| Addenda: | ||||||||||||||||||||||||
| Gross domestic income | 6.1 | 6.1 | 0.0 | 3.2 | 3.2 | 0.0 | 5.5 | 5.5 | 0.0 | 3.6 | 3.6 | 0.0 | 7.2 | 7.2 | 0.0 | 3.4 | 3.4 | 0.0 | 3.1 | 3.0 | 0.1 | 1.5 | 1.4 | 0.1 |
| Disposable personal income | 6.1 | 6.0 | 0.1 | 3.2 | 3.1 | 0.1 | 5.0 | 5.0 | 0.0 | 3.1 | 3.1 | 0.0 | 7.3 | 7.3 | 0.0 | 3.5 | 3.5 | 0.0 | 3.5 | 3.2 | 0.3 | 1.9 | 1.7 | 0.2 |
For the full span and each subperiod, the contributions of consumer spending, gross private domestic investment, government spending, and net exports to GDP are revised slightly or unrevised (table 24). The revised component estimates do not change the relative order of importance in terms of their contribution to overall GDP growth.
| 1929–2017 | 1929–1959 | 1959–2007 | 2007–2017 | |||||||||
|---|---|---|---|---|---|---|---|---|---|---|---|---|
| Revised | Previously published | Revision | Revised | Previously published | Revision | Revised | Previously published | Revision | Revised | Previously published | Revision | |
| Percent change at annual rate: | ||||||||||||
| Gross domestic product | 3.20 | 3.20 | 0.00 | 3.60 | 3.60 | 0.00 | 3.40 | 3.40 | 0.00 | 1.50 | 1.40 | 0.10 |
| Percentage points at annual rates: | ||||||||||||
| Personal consumption expenditures | 1.99 | 1.99 | 0.00 | 1.85 | 1.85 | 0.00 | 2.25 | 2.26 | −0.01 | 1.16 | 1.17 | −0.01 |
| Goods | 0.93 | 0.94 | −0.01 | 1.03 | 1.03 | 0.00 | 0.98 | 0.97 | 0.01 | 0.43 | 0.51 | −0.08 |
| Durable goods | 0.38 | 0.39 | −0.01 | 0.27 | 0.27 | 0.00 | 0.49 | 0.48 | 0.01 | 0.26 | 0.30 | −0.04 |
| Nondurable goods | 0.55 | 0.55 | 0.00 | 0.77 | 0.77 | 0.00 | 0.49 | 0.49 | 0.00 | 0.18 | 0.22 | −0.04 |
| Services | 1.05 | 1.05 | 0.00 | 0.81 | 0.82 | −0.01 | 1.27 | 1.28 | −0.01 | 0.72 | 0.66 | 0.06 |
| Gross private domestic investment | 0.60 | 0.58 | 0.02 | 0.43 | 0.42 | 0.01 | 0.77 | 0.76 | 0.01 | 0.28 | 0.17 | 0.11 |
| Fixed investment | 0.55 | 0.52 | 0.03 | 0.32 | 0.32 | 0.00 | 0.74 | 0.73 | 0.01 | 0.27 | 0.16 | 0.11 |
| Nonresidential | 0.44 | 0.42 | 0.02 | 0.17 | 0.17 | 0.00 | 0.64 | 0.62 | 0.02 | 0.32 | 0.21 | 0.11 |
| Structures | 0.03 | 0.03 | 0.00 | −0.02 | −0.02 | 0.00 | 0.08 | 0.08 | 0.00 | −0.04 | −0.03 | −0.01 |
| Equipment | 0.28 | 0.27 | 0.01 | 0.13 | 0.13 | 0.00 | 0.39 | 0.38 | 0.01 | 0.19 | 0.12 | 0.07 |
| Intellectual property products | 0.13 | 0.12 | 0.01 | 0.05 | 0.05 | 0.00 | 0.16 | 0.16 | 0.00 | 0.17 | 0.13 | 0.04 |
| Residential | 0.10 | 0.10 | 0.00 | 0.15 | 0.15 | 0.00 | 0.11 | 0.11 | 0.00 | −0.05 | −0.05 | 0.00 |
| Change in private inventories | 0.05 | 0.05 | 0.00 | 0.10 | 0.10 | 0.00 | 0.03 | 0.03 | 0.00 | 0.01 | 0.00 | 0.01 |
| Net exports of goods and services | −0.06 | −0.05 | −0.01 | −0.01 | −0.01 | 0.00 | −0.10 | −0.10 | 0.00 | 0.03 | 0.09 | −0.06 |
| Exports | 0.34 | 0.34 | 0.00 | 0.10 | 0.10 | 0.00 | 0.49 | 0.48 | 0.01 | 0.39 | 0.37 | 0.02 |
| Goods | 0.25 | 0.25 | 0.00 | 0.06 | 0.06 | 0.00 | 0.37 | 0.37 | 0.00 | 0.26 | 0.25 | 0.01 |
| Services | 0.09 | 0.09 | 0.00 | 0.04 | 0.04 | 0.00 | 0.12 | 0.11 | 0.01 | 0.13 | 0.12 | 0.01 |
| Imports | −0.40 | −0.39 | −0.01 | −0.11 | −0.11 | 0.00 | −0.59 | −0.58 | −0.01 | −0.36 | −0.28 | −0.08 |
| Goods | −0.33 | −0.32 | −0.01 | −0.06 | −0.06 | 0.00 | −0.51 | −0.50 | −0.01 | −0.28 | −0.22 | −0.06 |
| Services | −0.07 | −0.07 | 0.00 | −0.06 | −0.06 | 0.00 | −0.08 | −0.08 | 0.00 | −0.07 | −0.07 | 0.00 |
| Government consumption expenditures and gross investment | 0.81 | 0.81 | 0.00 | 1.61 | 1.62 | −0.01 | 0.47 | 0.48 | −0.01 | 0.00 | −0.01 | 0.01 |
| Federal | 0.57 | 0.57 | 0.00 | 1.41 | 1.42 | −0.01 | 0.16 | 0.16 | 0.00 | 0.03 | 0.03 | 0.00 |
| National defense | 0.46 | 0.47 | −0.01 | 1.25 | 1.26 | −0.01 | 0.07 | 0.07 | 0.00 | −0.01 | −0.01 | 0.00 |
| Nondefense | 0.11 | 0.11 | 0.00 | 0.16 | 0.16 | 0.00 | 0.09 | 0.09 | 0.00 | 0.05 | 0.04 | 0.01 |
| State and local | 0.24 | 0.24 | 0.00 | 0.20 | 0.20 | 0.00 | 0.31 | 0.31 | 0.00 | −0.03 | −0.04 | 0.01 |
Real DPI
The average annual rate of growth of real DPI for 1929–2017 is revised up 0.1 percentage point (to 3.2 percent). For 1929–1959 and for 1959–2007, the average annual rate of growth are unrevised (3.1 percent and 3.5 percent, respectively). For 2007–2017, the rate is revised up 0.2 percentage point, to 1.9 percent (table 23).
Revisions to real DPI result from the following:
- Revisions to current-dollar DPI
- Revisions to the implicit price deflator for PCE, which is used to deflate DPI
For 56 years, the percent change in real DPI is unrevised. For 16 years, the percent change in real DPI is revised up. The revisions exceed 0.1 percentage point in four years and primarily reflect revisions to the current dollar estimate. The most notable revision was for 2017, at 1.4 percentage points, reflecting the upward effect of the incorporation of revised and newly available source data and the switch to the PBO method for estimates of state and local defined pension plans; these upward effects were partly offset by the downward effect of the introduction of the reference rate approach for measures of the implicit output for credit unions and savings banks.
For 16 years, the percent change in real DPI is revised down; the downward revisions exceed 0.1 percentage point in just 3 years. For all three years, the revisions primarily reflect revisions to the current-dollar estimate. The largest downward revision was 0.5 percentage point for 2008, driven by the downward effects of revised estimates of misreporting, the incorporation of revised and newly available source data, and the introduction of the reference rate approach for the implicit output of credit unions and savings banks; these were partly offset by upward effects from the switch to the PBO method for measures of state and local defined pension plans.
The revisions to the percent changes in the chain-type price indexes result from the incorporation of revised and newly available source data and of revised weights into the chain formula.
The average annual rates of change in the price index for GDP for 1929–2017 and for the subperiods 1929–1959 and 1959–2007 are the same as in the previously published estimates (table 25). For 2007–2017, the average rate of change is revised up 0.1 percentage point, from 1.5 percent to 1.6 percent.
| Revised | Previously published | Revision | Revised | Previously published | Revision | Revised | Previously published | Revision | Revised | Previously published | Revision | |
|---|---|---|---|---|---|---|---|---|---|---|---|---|
| 1929–2017 | 1929–1959 | 1959–2007 | 2007–2017 | |||||||||
| Gross domestic product (GDP) | 2.8 | 2.8 | 0.0 | 1.9 | 1.9 | 0.0 | 3.7 | 3.7 | 0.0 | 1.6 | 1.5 | 0.1 |
| Personal consumption expenditures (PCE) | 2.8 | 2.8 | 0.0 | 1.9 | 1.9 | 0.0 | 3.7 | 3.7 | 0.0 | 1.5 | 1.5 | 0.0 |
| Goods | 2.1 | 2.1 | 0.0 | 1.9 | 1.9 | 0.0 | 2.7 | 2.7 | 0.0 | 0.1 | 0.2 | −0.1 |
| Durable goods | 1.2 | 1.2 | 0.0 | 1.9 | 1.9 | 0.0 | 1.3 | 1.3 | 0.0 | −1.9 | −1.8 | −0.1 |
| Nondurable goods | 2.6 | 2.6 | 0.0 | 1.9 | 1.9 | 0.0 | 3.4 | 3.4 | 0.0 | 1.1 | 1.2 | −0.1 |
| Services | 3.2 | 3.2 | 0.0 | 1.8 | 1.8 | 0.0 | 4.4 | 4.4 | 0.0 | 2.2 | 2.1 | 0.1 |
| Gross private domestic investment | 2.3 | 2.4 | −0.1 | 1.9 | 1.9 | 0.0 | 3.0 | 3.0 | 0.0 | 0.5 | 0.9 | −0.4 |
| Fixed investment | 2.7 | 2.7 | 0.0 | 2.7 | 2.7 | 0.0 | 3.1 | 3.1 | 0.0 | 0.6 | 0.9 | −0.3 |
| Nonresidential | 2.3 | 2.4 | −0.1 | 2.7 | 2.7 | 0.0 | 2.5 | 2.5 | 0.0 | 0.4 | 0.7 | −0.3 |
| Structures | 4.0 | 4.0 | 0.0 | 3.1 | 3.1 | 0.0 | 5.0 | 5.0 | 0.0 | 2.3 | 2.0 | 0.3 |
| Equipment | 1.6 | 1.7 | −0.1 | 2.7 | 2.7 | 0.0 | 1.3 | 1.4 | −0.1 | −0.6 | 0.1 | −0.7 |
| Intellectual property products | 2.1 | 2.2 | −0.1 | 2.2 | 2.2 | 0.0 | 2.4 | 2.5 | −0.1 | 0.3 | 0.6 | −0.3 |
| Residential | 3.7 | 3.7 | 0.0 | 3.0 | 3.0 | 0.0 | 4.5 | 4.5 | 0.0 | 1.8 | 1.7 | 0.1 |
| Change in private inventories | ||||||||||||
| Net exports of goods and services | ||||||||||||
| Exports | 2.2 | 2.3 | −0.1 | 1.8 | 1.8 | 0.0 | 2.9 | 2.9 | 0.0 | 0.5 | 0.6 | −0.1 |
| Goods | 2.0 | 2.0 | 0.0 | 1.7 | 1.7 | 0.0 | 2.6 | 2.6 | 0.0 | −0.1 | 0.0 | −0.1 |
| Services | 3.2 | 3.2 | 0.0 | 2.9 | 2.9 | 0.0 | 3.7 | 3.7 | 0.0 | 1.7 | 1.7 | 0.0 |
| Imports | 2.6 | 2.6 | 0.0 | 1.9 | 1.9 | 0.0 | 3.6 | 3.6 | 0.0 | −0.2 | 0.3 | −0.5 |
| Goods | 2.5 | 2.6 | −0.1 | 2.0 | 2.0 | 0.0 | 3.5 | 3.5 | 0.0 | −0.4 | 0.1 | −0.5 |
| Services | 2.8 | 2.8 | 0.0 | 1.7 | 1.7 | 0.0 | 3.9 | 3.9 | 0.0 | 1.0 | 1.1 | −0.1 |
| Government consumption expenditures and gross investment | 3.5 | 3.5 | 0.0 | 2.4 | 2.4 | 0.0 | 4.5 | 4.5 | 0.0 | 1.9 | 1.9 | 0.0 |
| Federal | 3.2 | 3.2 | 0.0 | 2.4 | 2.4 | 0.0 | 4.1 | 4.0 | 0.1 | 1.4 | 1.5 | −0.1 |
| National defense | 3.2 | 3.2 | 0.0 | 2.4 | 2.4 | 0.0 | 4.1 | 4.1 | 0.0 | 1.3 | 1.3 | 0.0 |
| Nondefense | 3.3 | 3.2 | 0.1 | 2.7 | 2.6 | 0.1 | 3.9 | 3.9 | 0.0 | 1.7 | 1.8 | −0.1 |
| State and local | 3.9 | 3.9 | 0.0 | 3.1 | 3.1 | 0.0 | 4.8 | 4.8 | 0.0 | 2.2 | 2.1 | 0.1 |
| Addenda: | ||||||||||||
| Gross domestic purchases | 2.8 | 2.8 | 0.0 | 1.9 | 1.9 | 0.0 | 3.7 | 3.7 | 0.0 | 1.4 | 1.5 | −0.1 |
| Gross domestic purchases excluding food and energy1 | 1.5 | 1.5 | 0.0 | |||||||||
| GDP excluding food and energy2 | 1.6 | 1.6 | 0.0 | |||||||||
| PCE excluding food and energy | 2.8 | 2.8 | 0.0 | 1.9 | 1.9 | 0.0 | 3.6 | 3.6 | 0.0 | 1.6 | 1.6 | 0.0 |
- Price index begins with 1982.
- Price index begins with 1985.
Similarly, for the gross domestic purchases price index, the average annual rates of change for 1929–2017 and for the subperiods 1929–1959 and 1959–2007, the revised estimates are the same as in the previously published estimates. For 2007–2017, the average annual rate of change in the price index is 1.4 percent, a downward revision of 0.1 percentage point.
Notable revisions to the prices of major components of the gross domestic purchases price index for 2007–2017 include the following:
- Prices of PCE for goods are revised down 0.1 percentage point, and prices for services are revised up 0.1 percentage point
- Prices of gross private domestic investment are revised down by 0.4 percentage point; prices of equipment are revised down 0.7 percentage point
- Prices of federal consumption expenditures and gross investment are revised down 0.1 percentage point and prices for state and local consumption and investment expenditures are revised up 0.1 percent
As with all regular updates, the revisions to the quarterly (and monthly) NIPA estimates reflect the revisions to the annual estimates, the incorporation of new and revised monthly and quarterly source data (including the updating of seasonal factors), and the introduction of changes in methodology.
In addition, the results of this year’s comprehensive update reflect the culmination of a multiyear initiative to enhance and modernize BEA’s seasonal adjustment practices. The improvements introduced to the seasonally adjusted NIPA estimates result from numerous actions, including the introduction of seasonal adjustments to series where seasonal patterns emerged recently; collaboration with our data providers to enhance and improve seasonal adjustment of the monthly and quarterly source data; and evaluations of GDP, GDI, and their major components for residual seasonality. As a result of these actions, BEA found that the revised estimates of GDP, GDI, and their major components show no signs of residual seasonality over the full quarterly time span (1947 forward), the most recent 30 years (1988 forward), or the most recent 15 years (2003 forward).9
The remainder of this section focuses on the effect of the revisions on business cycles with an emphasis on the most recent period of contraction and the current period of expansion.10
In general, the revisions have very little effect on business cycles (table 26). The average rates of change in real GDP were revised for only 4 of the 11 recessions since 1947. For the 1960 recession, the economy contracted by 0.2 percent—one-half the size of the contraction shown in previously estimates. For both the 1990 and 2001 recessions, the average rate of change in real GDP was revised down 0.1 percentage point.
| Revised | Previously published |
Revision | |
|---|---|---|---|
| Contractions | |||
| 1948:IV–1949:IV | −1.5 | −1.5 | 0.0 |
| 1953:II–1954:II | −2.4 | −2.4 | 0.0 |
| 1957:III–1958:II | −3.9 | −3.9 | 0.0 |
| 1960:II–1961:I | −0.2 | −0.4 | 0.2 |
| 1969:IV–1970:IV | −0.2 | −0.2 | 0.0 |
| 1973:IV–1975:I | −2.5 | −2.5 | 0.0 |
| 1980:I–1980:III | −4.3 | −4.3 | 0.0 |
| 1981:III–1982:IV | −2.0 | −2 | 0.0 |
| 1990:III–1991:I | −2.7 | −2.6 | −0.1 |
| 2001:I–2001:IV | 0.6 | 0.7 | −0.1 |
| 2007:IV–2009:II | −2.7 | −2.8 | 0.1 |
| Expansions | |||
| 1949:IV–1953:II | 7.6 | 7.6 | 0.0 |
| 1954:II–1957:III | 4.0 | 4.0 | 0.0 |
| 1958:II–1960:II | 5.5 | 5.6 | −0.1 |
| 1961:I–1969:IV | 4.9 | 4.9 | 0.0 |
| 1970:IV–1973:IV | 5.1 | 5.1 | 0.0 |
| 1975:I–1980:I | 4.3 | 4.3 | 0.0 |
| 1980:III–1981:III | 4.3 | 4.4 | −0.1 |
| 1982:IV–1990:III | 4.3 | 4.3 | 0.0 |
| 1991:I–2001:I | 3.6 | 3.6 | 0.0 |
| 2001:IV–2007:IV | 2.9 | 2.8 | 0.1 |
| 2009:II–2018:I | 2.2 | 2.2 | 0.0 |
For the most recent recession (from the fourth quarter of 2007 to the second quarter of 2009), the economy contracted on average 2.7 percent, 0.1 percentage point less of a decline than previously estimated.11 For that period, the percent change in real GDP is revised down for 3 quarters and is revised up for 3 quarters (table 27). The average revision, without regard to sign, is 0.3 percentage point.
| Revised | Previously published |
Revision | |
|---|---|---|---|
| 2008:I | −2.3 | −2.7 | 0.4 |
| 2008:II | 2.1 | 2.0 | 0.1 |
| 2008:III | −2.1 | −1.9 | −0.2 |
| 2008:IV | −8.4 | −8.2 | −0.2 |
| 2009:I | −4.4 | −5.4 | 1.0 |
| 2009:II | −0.6 | −0.5 | −0.1 |
| 2009:III | 1.5 | 1.3 | 0.2 |
| 2009:IV | 4.5 | 3.9 | 0.6 |
| 2010:I | 1.5 | 1.7 | −0.2 |
| 2010:II | 3.7 | 3.9 | −0.2 |
| 2010:III | 3.0 | 2.7 | 0.3 |
| 2010:IV | 2.0 | 2.5 | −0.5 |
| 2011:I | −1.0 | −1.5 | 0.5 |
| 2011:II | 2.9 | 2.9 | 0.0 |
| 2011:III | −0.1 | 0.8 | −0.9 |
| 2011:IV | 4.7 | 4.6 | 0.1 |
| 2012:I | 3.2 | 2.7 | 0.5 |
| 2012:II | 1.7 | 1.9 | −0.2 |
| 2012:III | 0.5 | 0.5 | 0.0 |
| 2012:IV | 0.5 | 0.1 | 0.4 |
| 2013:I | 3.6 | 2.8 | 0.8 |
| 2013:II | 0.5 | 0.8 | −0.3 |
| 2013:III | 3.2 | 3.1 | 0.1 |
| 2013:IV | 3.2 | 4.0 | −0.8 |
| 2014:I | −1.0 | −0.9 | −0.1 |
| 2014:II | 5.1 | 4.6 | 0.5 |
| 2014:III | 4.9 | 5.2 | −0.3 |
| 2014:IV | 1.9 | 2.0 | −0.1 |
| 2015:I | 3.3 | 3.2 | 0.1 |
| 2015:II | 3.3 | 2.7 | 0.6 |
| 2015:III | 1.0 | 1.6 | −0.6 |
| 2015:IV | 0.4 | 0.5 | −0.1 |
| 2016:I | 1.5 | 0.6 | 0.9 |
| 2016:II | 2.3 | 2.2 | 0.1 |
| 2016:III | 1.9 | 2.8 | −0.9 |
| 2016:IV | 1.8 | 1.8 | 0.0 |
| 2017:I | 1.8 | 1.2 | 0.6 |
| 2017:II | 3.0 | 3.1 | −0.1 |
| 2017:III | 2.8 | 3.2 | −0.4 |
| 2017:IV | 2.3 | 2.9 | −0.6 |
| 2018:I | 2.2 | 2.0 | 0.2 |
The average rate of growth in real GDP was revised for just 3 of the 10 complete expansions since 1947. For the expansions beginning in the second quarter of 1958 and in the third quarter of 1980, the average rate of growth was revised down 0.1 percentage point. For the expansion beginning in the fourth quarter of 2001, growth was 2.9 percent, an upward revision of 0.1 percentage point.
For the current expansion through the first quarter of 2018, real GDP increased at an average annual rate of 2.2 percent; the same as in the previously published estimates. The percent change in real GDP is revised up for 17 quarters and is revised down for 16 quarters. The average revision, without regard to sign, is 0.4 percentage point.
Appendix tables A and B accompany this article.
- See European Commission, International Monetary Fund, Organisation for Economic Co–operation and Development, United Nations, and World Bank, System of National Accounts 2008 (New York: United Nations, 2009) and International Monetary Fund, Balance of Payments and International Investment Position Manual, 6th ed. (Washington, DC: 2009).
- See Benjamin Cowan, Shelly Smith, and Sarahelen Thompson, “Seasonal Adjustment in the National Income and Product Accounts: Results from the 2018 Comprehensive Update,” Survey of Current Business 98 (August 2018).
- See Jason W. Chute, Stephanie H. McCulla, and Shelly Smith, “Preview of the 2018 Comprehensive Revision of the National Income and Product Accounts,” Survey 98 (April 2018).
- The 2012 benchmark input-output accounts and time series of Industry Economic Accounts will be published on November 1, 2018.
- In theory, GDP should equal GDI; in practice, GDP and GDI differ because their components are estimated using largely independent and less-than-perfect source data. See the box “The Statistical Discrepancy” in Robert P. Parker and Eugene P. Seskin, Survey 77 (August 1997): 19.
- The territorial adjustment is made to make the geographical coverage of the data from the international transactions accounts consistent with the concepts and definitions of the NIPAs. The adjustments are made to transactions between the United States and its territories, Puerto Rico, and the Northern Mariana Islands, which are treated as part of the United States in the ITAs but are included in the rest of the world in the NIPAs.
- This measure of compensation differs from the compensation measure that is a component of national income. The national income measure excludes compensation paid to the rest of the world and includes compensation received from the rest of the world.
- As components of net operating surplus within gross domestic income (account 1), corporate profits and net interest and miscellaneous payments include only those measures for domestic industries. As components of enterprise income (account 2), they include transactions with the rest of the world.
- For more details on the improvements incorporated and the methods used to assess residual seasonality, see Benjamin Cowan, Shelly Smith, and Sarahelen Thompson, “Seasonal Adjustment in the National Income and Product Accounts: Results from the 2018 Comprehensive Update,” Survey 98 (August 2018).
- These turning points are consistent with the business-cycle turning points determined by the National Bureau of Economic Research (NBER).
- The NBER considers a number of monthly indicators—such as employment, personal income, and industrial production—as well as the change in GDP growth for dating business cycles. Therefore, declines in quarterly real GDP often track closely with recessions, but the movements of monthly indicators (especially employment) that the NBER also considers may affect the relationship between the pattern of change in real GDP and the identification of recessions. More information about the NBER business-cycle dating procedure is available at www.nber.org/.