
U.S. International Transactions
Second Quarter 2018
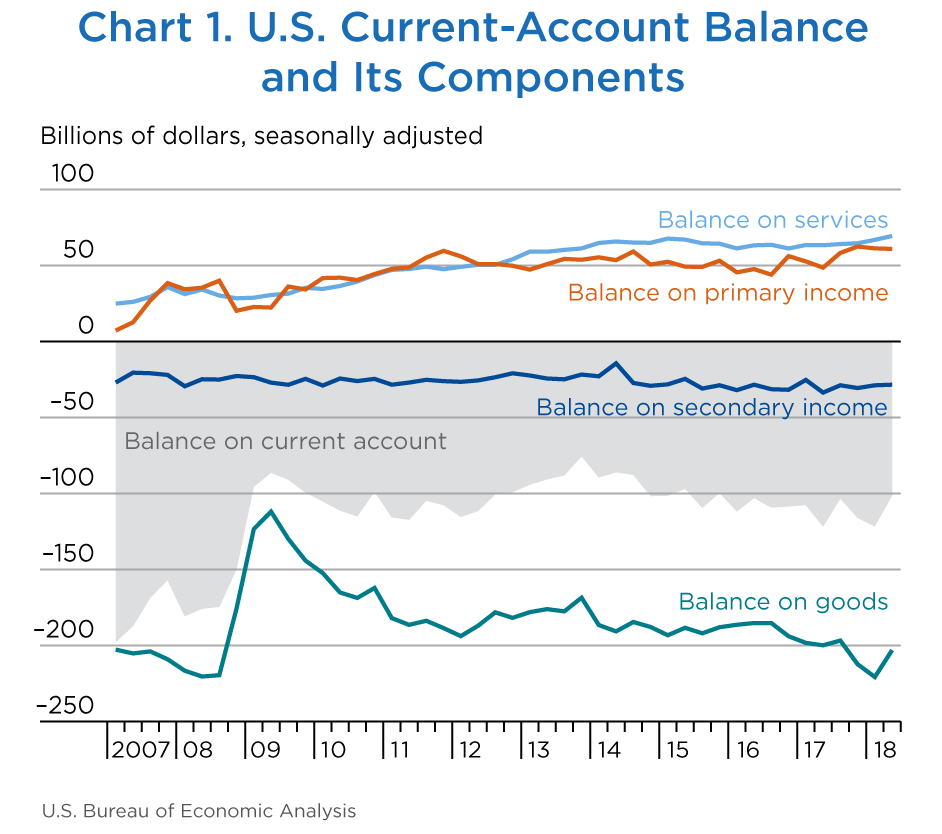
The U.S. current-account deficit—a net measure of transactions between the United States and the rest of the world in goods, services, primary income, and secondary income—decreased to $101.5 billion (preliminary) in the second quarter of 2018 from $121.7 billion (revised) in the first quarter of 2018 (chart 1 and table A). The deficit was 2.0 percent of current-dollar gross domestic product (GDP) in the second quarter, down from 2.4 percent in the first quarter.
The $20.3 billion decrease in the current-account deficit reflected a $17.6 billion decrease in the deficit on goods, a $2.5 billion increase in the surplus on services, and relatively small and offsetting changes in the balances on primary income and secondary income.
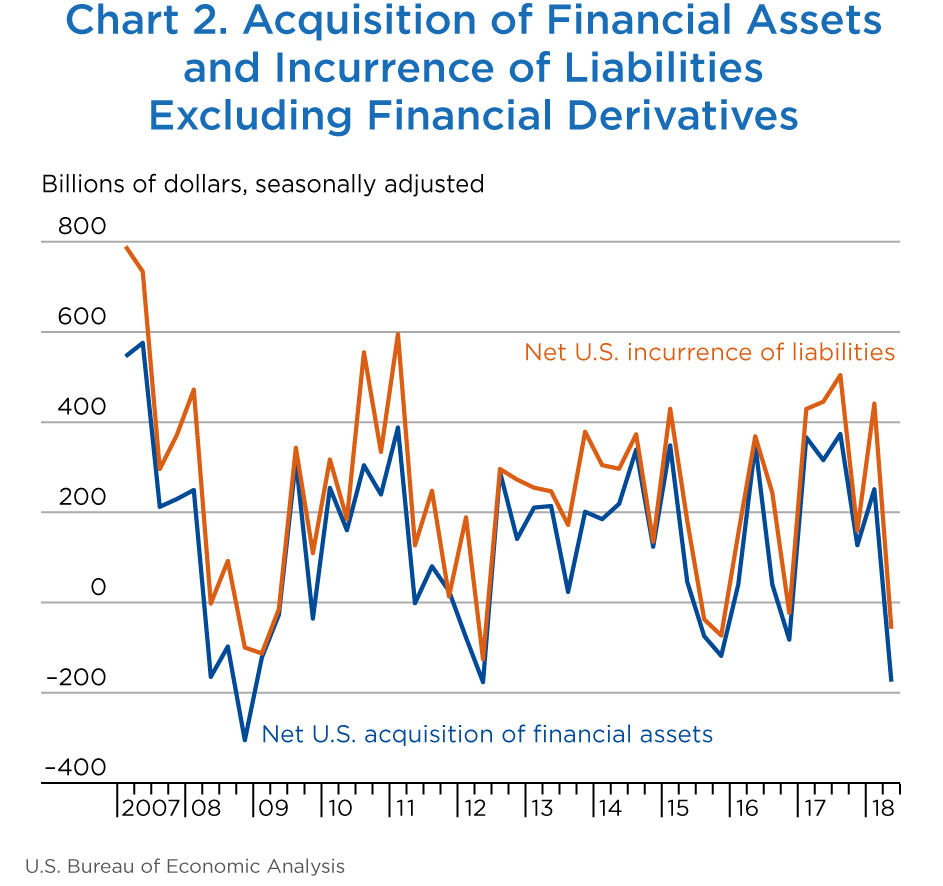
Net U.S. borrowing measured by financial-account transactions was $134.3 billion in the second quarter, a decrease from net borrowing of $160.9 billion in the first quarter.
[Click chart to expand]
| 2017 | 2018 | Change 2018:I to 2018:II |
|||
|---|---|---|---|---|---|
| III | IV | Ir | IIp | ||
| Current account | |||||
| Exports of goods and services and income receipts (credits) | 868,997 | 890,393 | 905,298 | 933,274 | 27,976 |
| Exports of goods and services | 589,107 | 605,916 | 617,437 | 638,390 | 20,953 |
| Goods | 387,814 | 401,939 | 411,442 | 429,238 | 17,796 |
| Services | 201,293 | 203,977 | 205,994 | 209,152 | 3,158 |
| Primary income receipts | 237,632 | 248,940 | 256,029 | 259,930 | 3,901 |
| Secondary income (current transfer) receipts | 42,258 | 35,537 | 31,833 | 34,954 | 3,121 |
| Imports of goods and services and income payments (debits) | 972,445 | 1,006,541 | 1,027,008 | 1,034,734 | 7,726 |
| Imports of goods and services | 721,899 | 753,742 | 771,426 | 772,202 | 776 |
| Goods | 584,637 | 614,317 | 632,244 | 632,396 | 152 |
| Services | 137,261 | 139,426 | 139,182 | 139,806 | 624 |
| Primary income payments | 179,410 | 186,569 | 194,854 | 199,085 | 4,231 |
| Secondary income (current transfer) payments | 71,136 | 66,229 | 60,728 | 63,447 | 2,719 |
| Capital account | |||||
| Capital transfer receipts and other credits | 24,788 | 0 | 0 | 0 | 0 |
| Capital transfer payments and other debits | 1 | 40 | 2 | n.a. | n.a. |
| Financial account | |||||
| Net U.S. acquisition of financial assets excluding financial derivatives (net increase in assets / financial outflow (+)) | 373,591 | 127,135 | 251,126 | −175,112 | −426,238 |
| Direct investment assets | 102,936 | 91,256 | −139,326 | −28,972 | 110,354 |
| Portfolio investment assets | 175,910 | 88,301 | 304,094 | −23,737 | −327,831 |
| Other investment assets | 94,804 | −50,883 | 86,365 | −125,471 | −211,836 |
| Reserve assets | −61 | −1,539 | −7 | 3,068 | 3,075 |
| Net U.S. incurrence of liabilities excluding financial derivatives (net increase in liabilities / financial inflow (+)) | 504,082 | 159,164 | 441,080 | −57,743 | −498,823 |
| Direct investment liabilities | 107,107 | 38,250 | 57,949 | 24,565 | −33,384 |
| Portfolio investment liabilities | 294,275 | 81,626 | 301,503 | 10,071 | −291,432 |
| Other investment liabilities | 102,701 | 39,288 | 81,628 | −92,379 | −174,007 |
| Financial derivatives other than reserves, net transactions | 18,600 | 777 | 29,024 | −16,969 | −45,993 |
| Statistical discrepancy | |||||
| Statistical discrepancy1 | −33,231 | 84,936 | −39,218 | −32,877 | 6,341 |
| Balances | |||||
| Balance on current account | −103,447 | −116,148 | −121,710 | −101,460 | 20,250 |
| Balance on goods and services | −132,791 | −147,826 | −153,989 | −133,812 | 20,177 |
| Balance on goods | −196,823 | −212,378 | −220,802 | −203,158 | 17,644 |
| Balance on services | 64,032 | 64,551 | 66,812 | 69,346 | 2,534 |
| Balance on primary income | 58,222 | 62,371 | 61,175 | 60,845 | −330 |
| Balance on secondary income | −28,878 | −30,692 | −28,896 | −28,493 | 403 |
| Balance on capital account | 24,787 | −40 | −2 | 0 | 2 |
| Net lending (+) or net borrowing (−) from current- and capital-account transactions2 | −78,660 | −116,188 | −121,712 | −101,460 | 20,252 |
| Net lending (+) or net borrowing (−) from financial-account transactions3 | −111,891 | −31,252 | −160,930 | −134,337 | 26,593 |
- p
- Preliminary
- r
- Revised
- n.a.
- Not available
- The statistical discrepancy is the difference between net acquisition of financial assets and net incurrence of liabilities in the financial account (including financial derivatives) less the difference between total credits and total debits recorded in the current and capital accounts.
- Sum of current- and capital-account balances.
- Sum of net U.S. acquisition of financial assets and net transactions in financial derivatives less net U.S. incurrence of liabilities.
Note. The statistics are presented in table 1.2 on BEA’s website.
Current-account highlights
- The deficit on goods decreased $17.6 billion in the second quarter to $203.2 billion.
- The surplus on services increased $2.5 billion to $69.3 billion.
- The deficit on secondary income decreased $0.4 billion to $28.5 billion.
- The surplus on primary income decreased $0.3 billion to $60.8 billion.
Financial-account highlights
- Net U.S. liquidation of financial assets excluding financial derivatives was $175.1 billion in the second quarter, following net U.S. acquisition of $251.1 billion in the first quarter (chart 2).
- Net U.S. repayment of liabilities excluding financial derivatives was $57.7 billion in the second quarter, following net U.S. incurrence of $441.1 billion in the first quarter.
- Transactions in financial derivatives other than reserves reflected second-quarter net borrowing of $17.0 billion, following net lending of $29.0 billion in the first quarter.
[Click chart to expand]
Statistical discrepancy
The statistical discrepancy was −$32.9 billion in the second quarter, following a statistical discrepancy of −$39.2 billion in the first quarter.
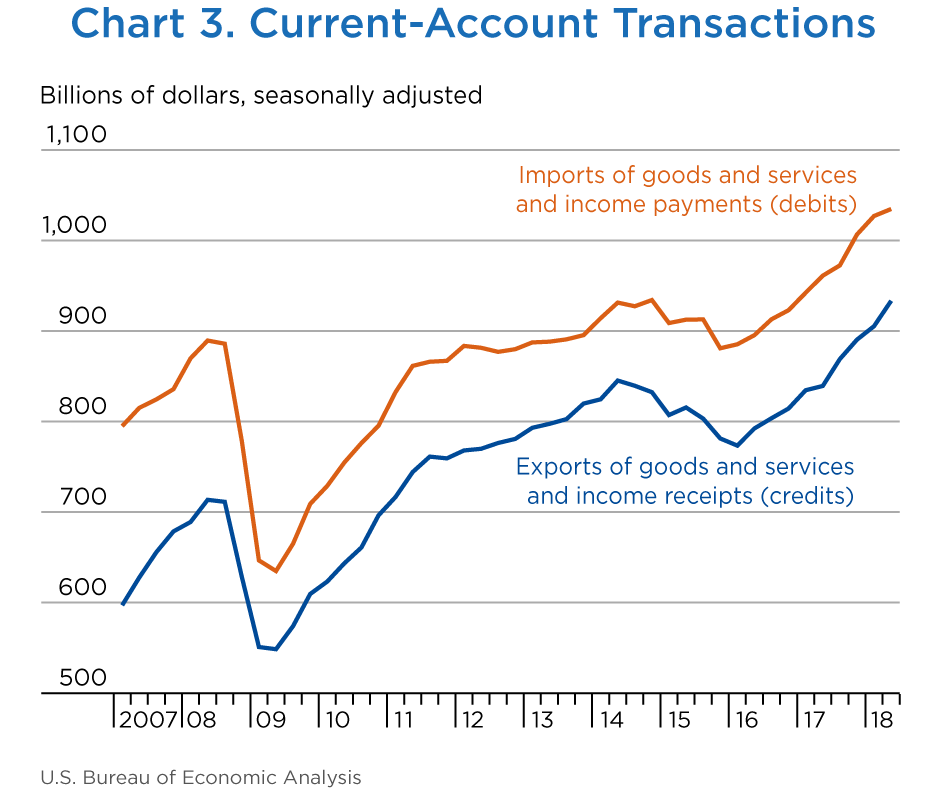
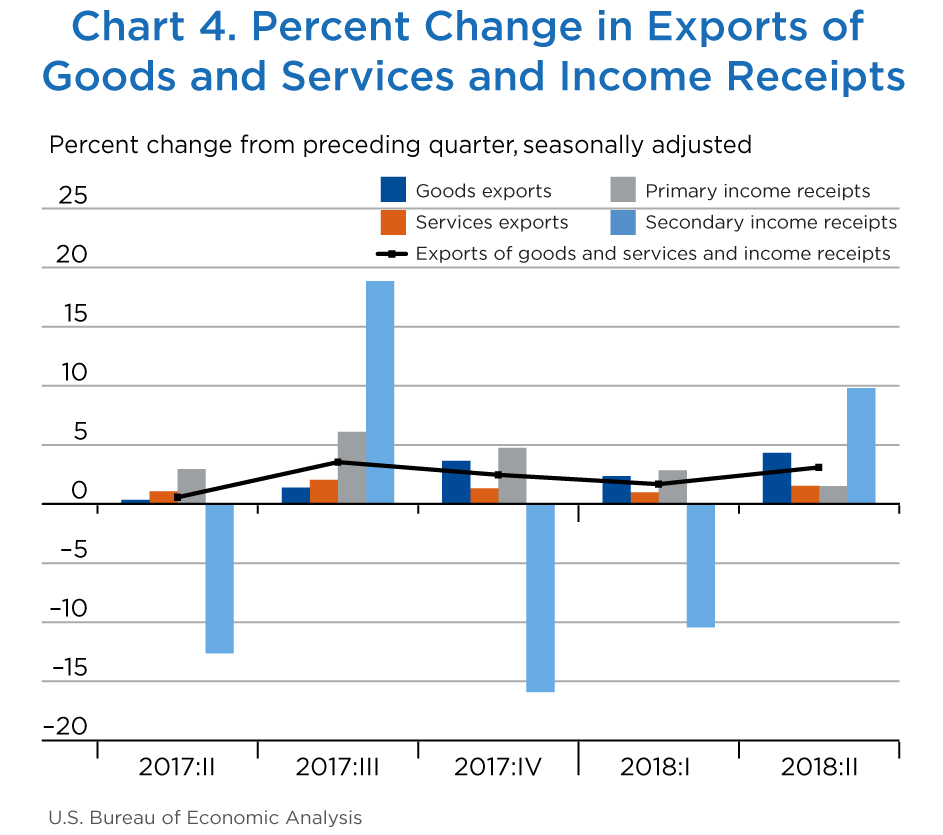
Exports of goods and services and income receipts increased $28.0 billion, or 3.1 percent, in the second quarter to $933.3 billion (charts 3 and 4 and table B).
- Goods exports increased $17.8 billion, or 4.3 percent, to $429.2 billion, mostly reflecting increases in industrial supplies and materials, primarily petroleum and products, and in foods, feeds, and beverages, primarily soybeans.
- Primary income receipts increased $3.9 billion, or 1.5 percent, to $259.9 billion, primarily reflecting increases in portfolio investment income and in other investment income. A decrease in direct investment income partly offset the increases. For more information on direct investment income, see “Effects of the 2017 Tax Cuts and Jobs Act on Components of the International Transactions Accounts.”
- Services exports increased $3.2 billion, or 1.5 percent, to $209.2 billion, mainly reflecting increases in other business services, led by professional and management consulting services, in financial services, and in charges for the use of intellectual property.
[Click chart to expand]
[Click chart to expand]
| 2017 | 2018 | Change 2018:I to 2018:II |
|||
|---|---|---|---|---|---|
| III | IV | Ir | IIp | ||
| Exports of goods and services and income receipts | 868,997 | 890,393 | 905,298 | 933,274 | 27,976 |
| Exports of goods | 387,814 | 401,939 | 411,442 | 429,238 | 17,796 |
| General merchandise | 382,828 | 397,143 | 404,927 | 423,937 | 19,010 |
| Foods, feeds, and beverages | 34,209 | 32,099 | 33,338 | 40,521 | 7,183 |
| Industrial supplies and materials | 111,819 | 124,271 | 125,430 | 134,571 | 9,141 |
| Energy products | 38,716 | 46,234 | 46,972 | 54,033 | 7,061 |
| Of which: Petroleum and products | 33,122 | 40,384 | 40,109 | 46,916 | 6,807 |
| Nonenergy products | 73,103 | 78,037 | 78,458 | 80,538 | 2,080 |
| Capital goods except automotive | 134,985 | 137,341 | 138,209 | 141,647 | 3,438 |
| Automotive vehicles, parts, and engines | 39,078 | 39,761 | 42,207 | 40,334 | −1,873 |
| Consumer goods except food and automotive | 48,879 | 49,807 | 51,598 | 51,282 | −316 |
| Other general merchandise | 13,858 | 13,866 | 14,144 | 15,582 | 1,438 |
| Net exports of goods under merchanting | 47 | 56 | 66 | 53 | −13 |
| Nonmonetary gold | 4,940 | 4,740 | 6,450 | 5,249 | −1,201 |
| Exports of services1 | 201,293 | 203,977 | 205,994 | 209,152 | 3,158 |
| Maintenance and repair services n.i.e. | 6,213 | 6,740 | 7,286 | 7,323 | 37 |
| Transport | 22,483 | 22,696 | 22,949 | 23,180 | 231 |
| Travel (for all purposes including education) | 52,980 | 53,429 | 53,504 | 53,811 | 307 |
| Business | 9,906 | 9,956 | 9,877 | 9,804 | −73 |
| Personal | 43,074 | 43,473 | 43,627 | 44,007 | 380 |
| Insurance services | 4,708 | 4,755 | 4,555 | 4,629 | 74 |
| Financial services | 27,927 | 28,751 | 27,907 | 28,703 | 796 |
| Charges for the use of intellectual property n.i.e. | 32,273 | 32,762 | 33,577 | 34,181 | 604 |
| Telecommunications, computer, and information services | 10,735 | 10,902 | 10,913 | 11,189 | 276 |
| Other business services | 38,936 | 39,326 | 40,556 | 41,403 | 847 |
| Government goods and services n.i.e. | 5,037 | 4,617 | 4,748 | 4,735 | −13 |
| Primary income receipts | 237,632 | 248,940 | 256,029 | 259,930 | 3,901 |
| Investment income | 236,058 | 247,367 | 254,435 | 258,325 | 3,890 |
| Direct investment income | 127,799 | 135,929 | 135,062 | 133,794 | −1,268 |
| Income on equity | 120,340 | 128,884 | 128,094 | 126,789 | −1,305 |
| Dividends and withdrawals | 55,110 | 26,874 | 294,856 | 169,533 | −125,323 |
| Reinvested earnings | 65,229 | 102,009 | −166,762 | −42,745 | 124,017 |
| Interest | 7,459 | 7,046 | 6,969 | 7,006 | 37 |
| Portfolio investment income | 91,154 | 93,614 | 99,244 | 102,162 | 2,918 |
| Income on equity and investment fund shares | 61,241 | 62,535 | 65,937 | 67,345 | 1,408 |
| Interest on debt securities | 29,913 | 31,078 | 33,307 | 34,817 | 1,510 |
| Other investment income | 16,996 | 17,741 | 19,959 | 22,322 | 2,363 |
| Reserve asset income | 109 | 82 | 169 | 47 | −122 |
| Compensation of employees | 1,573 | 1,573 | 1,594 | 1,605 | 11 |
| Secondary income (current transfer) receipts2 | 42,258 | 35,537 | 31,833 | 34,954 | 3,121 |
- p
- Preliminary
- r
- Revised
- n.i.e.
- Not included elsewhere
- See also Shari A. Allen, Alexis N. Grimm, and Christopher P. Steiner, “U.S. International Services: Trade in Services in 2017 and Services Supplied Through Affiliates in 2016,” Survey of Current Business 98 (October 2018).
- Secondary income receipts include U.S. government and private transfers, such as fines and penalties, withholding taxes, insurance-related transfers, and other current transfers.
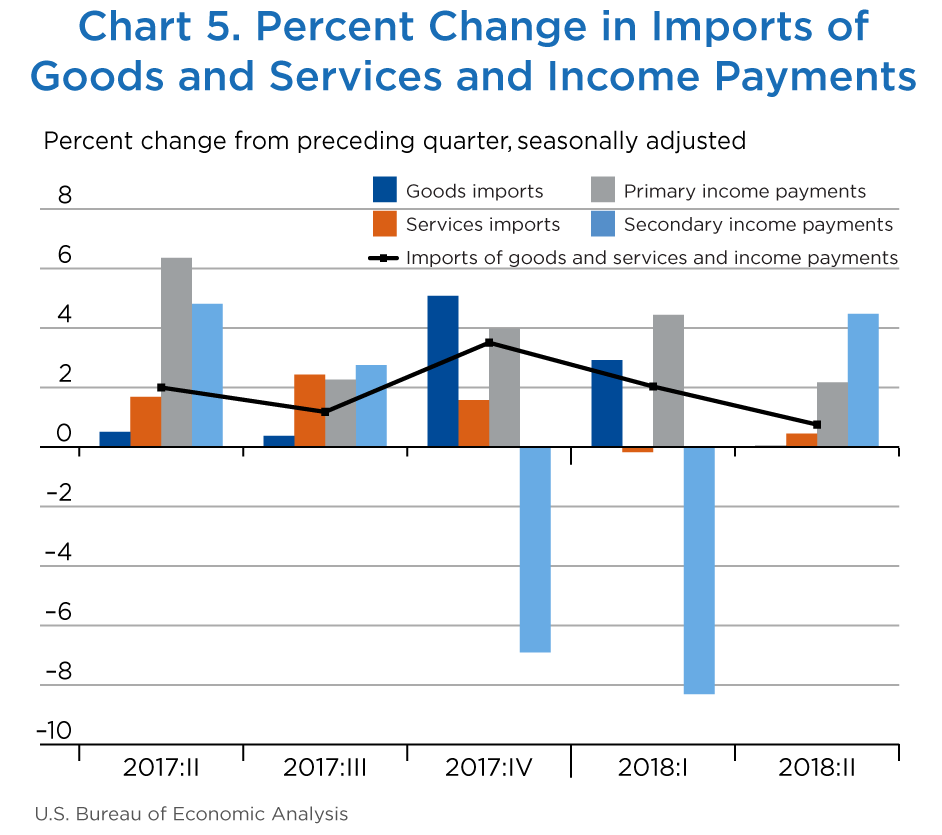
Imports of goods and services and income payments increased $7.7 billion, or 0.8 percent, in the second quarter to $1,034.7 billion (charts 3 and 5 and table C).
- Primary income payments increased $4.2 billion, or 2.2 percent, to $199.1 billion, mainly reflecting increases in other investment income and in portfolio investment income. A decrease in direct investment income partly offset the increases.
- Secondary income payments increased $2.7 billion, or 4.5 percent, to $63.4 billion, primarily reflecting an increase in U.S. government grants.
- Services imports increased $0.6 billion, or 0.4 percent, to $139.8 billion, mainly reflecting increases in other business services and in transport. A decrease in insurance services partly offset the increases.
- Goods imports increased $0.2 billion, or less than 0.1 percent, to $632.4 billion, mostly reflecting offsetting changes across categories. Increases in industrial supplies and materials and in capital goods except automotive were mainly offset by decreases in consumer goods except food and automotive and in automotive vehicles, parts, and engines.
[Click chart to expand]
| 2017 | 2018 | Change 2018:I to 2018:II |
|||
|---|---|---|---|---|---|
| III | IV | Ir | IIp | ||
| Imports of goods and services and income payments | 972,445 | 1,006,541 | 1,027,008 | 1,034,734 | 7,726 |
| Imports of goods | 584,637 | 614,317 | 632,244 | 632,396 | 152 |
| General merchandise | 581,849 | 610,844 | 629,436 | 629,718 | 282 |
| Foods, feeds, and beverages | 35,069 | 35,551 | 37,014 | 37,089 | 75 |
| Industrial supplies and materials | 123,450 | 133,707 | 142,210 | 146,228 | 4,018 |
| Energy products | 49,448 | 55,863 | 61,969 | 64,403 | 2,434 |
| Of which: Petroleum and products | 45,444 | 51,926 | 58,558 | 61,038 | 2,480 |
| Nonenergy products | 74,002 | 77,844 | 80,241 | 81,825 | 1,584 |
| Capital goods except automotive | 163,218 | 169,186 | 170,639 | 174,200 | 3,561 |
| Automotive vehicles, parts, and engines | 89,455 | 90,589 | 92,885 | 90,150 | −2,735 |
| Consumer goods except food and automotive | 148,197 | 157,597 | 164,007 | 157,413 | −6,594 |
| Other general merchandise | 22,460 | 24,214 | 22,681 | 24,638 | 1,957 |
| Nonmonetary gold | 2,789 | 3,473 | 2,809 | 2,678 | −131 |
| Imports of services1 | 137,261 | 139,426 | 139,182 | 139,806 | 624 |
| Maintenance and repair services n.i.e. | 2,004 | 2,059 | 2,093 | 2,063 | −30 |
| Transport | 25,352 | 25,872 | 26,253 | 26,619 | 366 |
| Travel (for all purposes including education) | 33,813 | 34,906 | 35,553 | 35,600 | 47 |
| Business | 4,147 | 4,140 | 4,009 | 4,182 | 173 |
| Personal | 29,666 | 30,766 | 31,544 | 31,418 | −126 |
| Insurance services | 13,094 | 12,434 | 9,754 | 9,216 | −538 |
| Financial services | 7,478 | 7,628 | 7,532 | 7,638 | 106 |
| Charges for the use of intellectual property n.i.e. | 13,136 | 13,808 | 13,925 | 13,710 | −215 |
| Telecommunications, computer, and information services | 10,068 | 10,280 | 10,174 | 10,343 | 169 |
| Other business services | 26,774 | 26,929 | 28,246 | 28,954 | 708 |
| Government goods and services n.i.e. | 5,541 | 5,510 | 5,653 | 5,662 | 9 |
| Primary income payments | 179,410 | 186,569 | 194,854 | 199,085 | 4,231 |
| Investment income | 174,430 | 181,601 | 189,875 | 194,092 | 4,217 |
| Direct investment income | 51,342 | 55,978 | 57,458 | 56,312 | −1,146 |
| Portfolio investment income | 109,845 | 111,305 | 114,968 | 116,948 | 1,980 |
| Income on equity and investment fund shares | 36,670 | 36,625 | 38,844 | 40,190 | 1,346 |
| Interest on debt securities | 73,175 | 74,680 | 76,124 | 76,758 | 634 |
| Other investment income | 13,243 | 14,317 | 17,448 | 20,832 | 3,384 |
| Compensation of employees | 4,980 | 4,969 | 4,979 | 4,993 | 14 |
| Secondary income (current transfer) payments2 | 71,136 | 66,229 | 60,728 | 63,447 | 2,719 |
| Supplemental detail on insurance transactions: | |||||
| Premiums paid | 33,943 | 31,429 | 23,986 | 23,699 | −287 |
| Losses recovered | 46,595 | 21,603 | 18,689 | 18,859 | 170 |
- p
- Preliminary
- r
- Revised
- n.i.e.
- Not included elsewhere
- See also Shari A. Allen, Alexis N. Grimm, and Christopher P. Steiner, “U.S. International Services: Trade in Services in 2017 and Services Supplied Through Affiliates in 2016,” Survey of Current Business 98 (October 2018).
- Secondary income payments include U.S. government and private transfers, such as U.S. government grants and pensions, fines and penalties, withholding taxes, personal transfers (remittances), insurance-related transfers, and other current transfers.
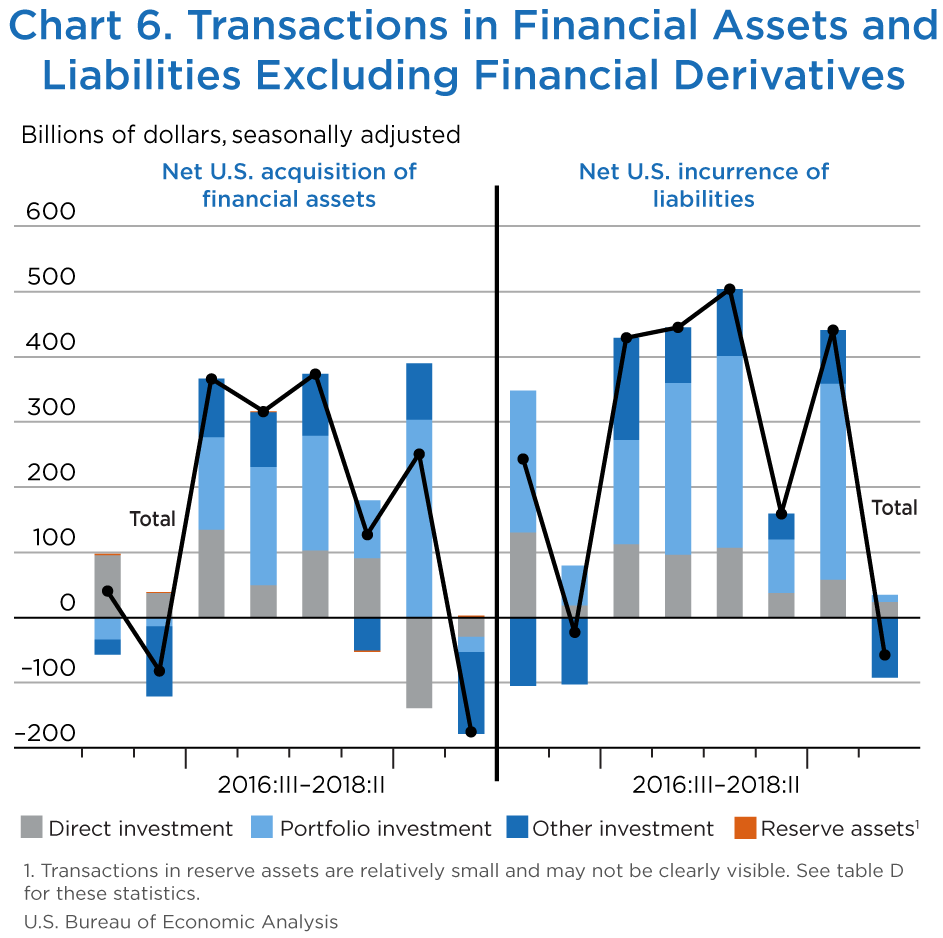
Liquidation of financial assets
- Net U.S. sales of portfolio investment assets were $23.7 billion, following net U.S. purchases of $304.1 billion in the first quarter (chart 6 and table D). This change mostly reflected net U.S. sales of foreign equity and investment fund shares, following net purchases in the first quarter.
- Net U.S. liquidation of other investment assets was $125.5 billion, following net U.S. acquisition of $86.4 billion in the first quarter. This change mostly reflected net foreign repayment of loans, following net U.S. provision of loans to foreigners in the first quarter.
- Net U.S. withdrawal of direct investment assets decreased $110.4 billion to $29.0 billion. The net withdrawal of direct investment assets reflected U.S. parent repatriation of previously reinvested earnings in response to the Tax Cuts and Jobs Act. For more information, see “Effects of the 2017 Tax Cuts and Jobs Act on Components of the International Transactions Accounts.”
Repayment of liabilities
- Net U.S. incurrence of portfolio investment liabilities decreased $291.4 billion to $10.1 billion, reflecting both net foreign sales of U.S. equity and investment fund shares, following net purchases in the first quarter, and a decrease in net foreign purchases of U.S. long-term debt securities.
- Net U.S. repayment of other investment liabilities was $92.4 billion, following net incurrence of $81.6 billion in the first quarter. This change mostly reflected net U.S. repayment of loan liabilities, following net incurrence of loans in the first quarter.
[Click chart to expand]
| 2017 | 2018 | Change 2018:I to 2018:II |
|||
|---|---|---|---|---|---|
| III | IV | Ir | IIp | ||
| Net U.S. acquisition of financial assets excluding financial derivatives (net increase in assets / financial outflow (+)) | 373,591 | 127,135 | 251,126 | −175,112 | −426,238 |
| Direct investment assets | 102,936 | 91,256 | −139,326 | −28,972 | 110,354 |
| Equity | 69,079 | 101,537 | −167,731 | −36,473 | 131,258 |
| Equity other than reinvestment of earnings | 3,850 | −472 | −969 | 6,272 | 7,241 |
| Reinvestment of earnings | 65,229 | 102,009 | −166,762 | −42,745 | 124,017 |
| Debt instruments | 33,857 | −10,281 | 28,406 | 7,501 | −20,905 |
| Portfolio investment assets | 175,910 | 88,301 | 304,094 | −23,737 | −327,831 |
| Equity and investment fund shares | 63,399 | −39,233 | 200,871 | −73,520 | −274,391 |
| Debt securities | 112,512 | 127,534 | 103,223 | 49,783 | −53,440 |
| Short-term securities | 74,149 | 40,467 | 27,771 | 2,469 | −25,302 |
| Long-term corporate securities | 26,957 | 62,231 | 53,741 | 32,876 | −20,865 |
| Other long-term securities | 11,406 | 24,836 | 21,711 | 14,438 | −7,273 |
| Other investment assets | 94,804 | −50,883 | 86,365 | −125,471 | −211,836 |
| Currency and deposits | 78,488 | 4,850 | 53,816 | −26,991 | −80,807 |
| Loans | 15,099 | −55,760 | 33,356 | −101,486 | −134,842 |
| Trade credit and advances | 1,217 | 26 | −807 | 3,006 | 3,813 |
| Reserve assets | −61 | −1,539 | −7 | 3,068 | 3,075 |
| Monetary gold | 0 | 0 | 0 | 0 | 0 |
| Special drawing rights | 26 | 26 | 33 | 33 | 0 |
| Reserve position in the International Monetary Fund | −98 | −1,535 | −73 | 3,136 | 3,209 |
| Other reserve assets | 11 | −29 | 34 | −101 | −135 |
| Net U.S. incurrence of liabilities excluding financial derivatives (net increase in liabilities / financial inflow (+)) | 504,082 | 159,164 | 441,080 | −57,743 | −498,823 |
| Direct investment liabilities | 107,107 | 38,250 | 57,949 | 24,565 | −33,384 |
| Equity | 72,927 | 64,320 | 72,661 | 33,445 | −39,216 |
| Equity other than reinvestment of earnings | 42,799 | 36,488 | 37,499 | 4,724 | −32,775 |
| Reinvestment of earnings | 30,127 | 27,832 | 35,163 | 28,721 | −6,442 |
| Debt instruments | 34,180 | −26,070 | −14,712 | −8,880 | 5,832 |
| Portfolio investment liabilities | 294,275 | 81,626 | 301,503 | 10,071 | −291,432 |
| Equity and investment fund shares | 80,561 | −3,377 | 154,313 | −26,164 | −180,477 |
| Debt securities | 213,713 | 85,003 | 147,190 | 36,235 | −110,955 |
| Short term | −20,035 | 25,215 | 31,355 | 34,585 | 3,230 |
| Treasury bills and certificates | 9,132 | 20,270 | 13,560 | 33,703 | 20,143 |
| Federally sponsored agency securities | −1,927 | 2,160 | 2,214 | −680 | −2,894 |
| Other short-term securities | −27,240 | 2,785 | 15,581 | 1,562 | −14,019 |
| Long term | 233,748 | 59,788 | 115,835 | 1,651 | −114,184 |
| Treasury bonds and notes | 150,035 | 546 | 73,078 | −12,865 | −85,943 |
| Federally sponsored agency securities | 14,153 | 8,523 | 37,775 | 5,983 | −31,792 |
| Corporate bonds and notes | 70,281 | 51,058 | 4,731 | 6,524 | 1,793 |
| Other | −721 | −339 | 251 | 2,009 | 1,758 |
| Other investment liabilities | 102,701 | 39,288 | 81,628 | −92,379 | −174,007 |
| Currency (short term) | 15,850 | 17,262 | 16,970 | 19,391 | 2,421 |
| Deposits | −31,642 | 44,161 | −27,004 | −53,800 | −26,796 |
| Loans | 112,549 | −23,436 | 82,566 | −63,135 | −145,701 |
| Trade credit and advances | 5,943 | 1,302 | 9,096 | 5,165 | −3,931 |
| Special drawing rights allocations | 0 | 0 | 0 | 0 | 0 |
- p
- Preliminary
- r
- Revised
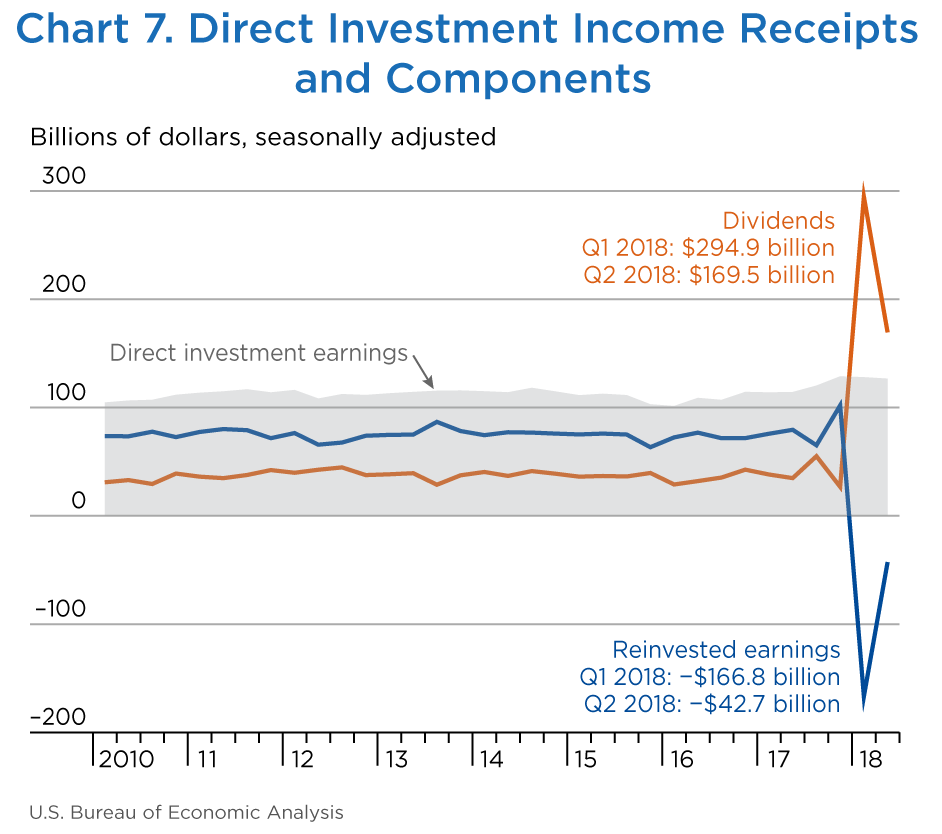
In the international transactions accounts, income on equity, or earnings, of foreign affiliates of U.S. multinational enterprises consists of (1) a portion that is repatriated to the parent company in the United States in the form of dividends and (2) a portion that is reinvested in foreign affiliates. At times, repatriation of dividends exceeds current-period earnings, resulting in negative values being recorded for reinvested earnings. In the first quarter of 2018, earnings were $128.1 billion, with dividends of $294.9 billion and reinvested earnings of −$166.8 billion. In the second quarter, earnings were $126.8 billion, with dividends of $169.5 billion and reinvested earnings of −$42.7 billion (chart 7 and table B).
The large magnitudes for dividends and withdrawals and the negative reinvested earnings reflect the repatriation of accumulated earnings by foreign affiliates of U.S. multinational enterprises to their U.S. parent companies in response to the 2017 Tax Cuts and Jobs Act (TCJA). The TCJA requires U.S. parent companies to pay a one-time tax on their accumulated earnings held abroad, but generally eliminates any further taxes on repatriated earnings. The negative reinvested earnings in the first and second quarters reflect the fact that dividends exceeded earnings and U.S. parent companies withdrew accumulated prior earnings from their foreign affiliates. The negative reinvested earnings are also reflected in the net acquisition of direct investment assets in the financial account, which was −$139.3 billion in the first quarter and −$29.0 billion in the second quarter (table D).
For more information, see “How does the 2017 Tax Cuts and Jobs Act affect BEA's business income statistics?” and “How are the International Transactions Accounts affected by an increase in direct investment dividend receipts?”
[Click chart to expand]
In addition to the repatriation of accumulated earnings, some companies made other changes to their business practices in reaction to the TCJA. For example, some insurance companies changed how they operate in response to the base erosion and anti-abuse tax (BEAT) provision of the TCJA. BEAT is a tax on certain payments from a U.S. company to a related foreign party, which can include premium payments for reinsurance. In response to the new tax, many U.S. insurance companies terminated these intracompany reinsurance contracts. As a result, premiums paid by U.S. insurers to foreign insurers in the first and second quarters of 2018—$24.0 billion and $23.7 billion, respectively—were down from $31.4 billion in the fourth quarter of 2017 and from other recent quarters (table C). Similarly, insurance services imports in the first and second quarters—$9.8 billion and $9.2 billion, respectively—were down from $12.4 billion in the fourth quarter of 2017 and from other recent quarters.
For more information on the estimation methods used to compile insurance services, see the insurance section in “U.S. International Economic Accounts: Concepts and Methods.”