
Activities of U.S. Affiliates of Foreign Multinational Enterprises in 2016
By primary industry of affiliate, the largest increases in U.S. affiliate value added in 2016 were in retail trade, chemicals manufacturing (mainly pharmaceuticals), and information (mainly wireless telecommunications). These increases were slightly greater than the growth in GDP in these industries. By country of ultimate beneficial owner (UBO), the largest increases in value added in 2016 were for British-owned and Japanese-owned affiliates.1
This article examines selected activities of MOUSAs in 2016 including value added, employment, international trade in goods, and expenditures on research and development (R&D)—and the changes in these activities from 2015 to 2016.2 Highlights of the activities of majority-owned U.S. affiliates in 2016 include the following:
- U.S. affiliate employment was 7.1 million workers, up 0.3 million workers, or 3.9 percent, from 6.8 million in 2015.
- Exports of goods by U.S. affiliates were $369.8 billion, up $0.8 billion, or 0.2 percent, from $368.9 billion in 2015.
- Imports of goods by U.S. affiliates were $649.9 billion, down $43.5 billion, or 6.3 percent, from $693.5 billion in 2015.
- R&D performed by U.S. affiliates was $60.1 billion, up $3.4 billion, or 6.0 percent, from $56.7 billion in 2015.
These statistics are based on the 2016 preliminary and 2015 revised results of the Bureau of Economic Analysis (BEA) Annual Survey of Foreign Direct Investment in the United States. The statistics are disaggregated by country of UBO, by industry of affiliate or by industry of sales, and by state. The revised statistics for 2015 replace preliminary statistics published in August 2017. Additional characteristics of U.S. affiliates and their activities—including asset holdings; property, plant, and equipment holdings and expenditures; sales; employee compensation; and net income—are presented in tables at the end of this article and are available on BEA’s website.
Current-dollar value added of U.S. affiliates grew to $910.6 billion in 2016 (table 1), a 1.9 percent increase from 2015 (table 2).3 In 2016, U.S. affiliates accounted for 6.4 percent of total U.S. business-sector GDP, down from 6.5 percent in 2015.
| Value added | Employment | |
|---|---|---|
| Millions of dollars | Thousands of employees | |
| By year: | ||
| 2008 | −5.0 | 0.9 |
| 2009 | −8.4 | −6.1 |
| 2010 | 11.5 | 2.7 |
| 2011 | 12.9 | 4.9 |
| 2012 | 6.2 | 3.3 |
| 2013 | 6.3 | 5.0 |
| 2014 | 4.9 | 7.0 |
| 2015 | 1.2 | 3.2 |
| 2016 | 1.9 | 3.9 |
| Overall: | ||
| 2007–2015 | 3.5 | 2.5 |
| Within specific time periods: | ||
| 2007–2009 | −6.7 | −2.7 |
| 2009–2014 | 8.3 | 4.6 |
| 2014–2016 | 1.5 | 3.5 |
By country of ownership
Affiliates with UBOs in the seven largest investing countries—the United Kingdom, Japan, Germany, Canada, France, Switzerland, and the Netherlands—accounted for 73.6 percent of U.S. affiliate value added in 2016. British-owned affiliates accounted for the largest share (15.2 percent) of U.S. affiliate value added, followed by Japanese-owned affiliates (14.8 percent) and German-owned affiliates (11.5 percent).
Manufacturing accounted for the largest share—slightly more than 40 percent—of total British-owned affiliate value added. Within British-owned affiliate manufacturing, the largest share was in pharmaceuticals, followed by petroleum and coal products. Outside of manufacturing, British-owned affiliates generated substantial value added in information and retail trade. In 2016, value added by British-owned affiliates rose $16.1 billion, or 13.1 percent, reflecting new affiliates in retail trade and pharmaceuticals.
Value added by Japanese-owned affiliates was largest in manufacturing and wholesale trade. Within manufacturing and wholesale trade, the largest share was in the production and sale of motor vehicle related products. Value added by Japanese-owned affiliates increased $9.6 billion, or 7.7 percent, in 2016, reflecting increases by existing affiliates in wireless telecommunications and wholesale trade and new affiliates in life insurance.
Manufacturing accounted for slightly less than half of all German-owned affiliate value added, mainly in motor vehicle related products, chemicals, and machinery. Value added by German-owned affiliates decreased $3.1 billion, or 2.9 percent, reflecting decreases by existing affiliates in chemicals and transportation equipment manufacturing.
Although the level of value added by Chinese-owned affiliates was much lower than that of the top three countries, it increased sharply, by $3.1 billion, or 50.2 percent, reflecting the establishment of new affiliates in 2016.
By industry of affiliate
In 2016, affiliates in manufacturing accounted for 44.5 percent of affiliate value added, affiliates in wholesale trade accounted for 11.9 percent, and affiliates in finance and insurance accounted for 9.8 percent.4 Within manufacturing, chemicals accounted for the largest share of affiliate value added, followed by transportation equipment.
The largest increases in U.S. affiliate value added in 2016 were in retail trade, chemicals manufacturing (mainly pharmaceuticals), and information (mainly wireless telecommunications). These increases were slightly greater than the growth in GDP in these industries. Value added in retail trade increased $10.1 billion, or 26.2 percent. The leading contributors to the increases in value added were new British-owned affiliates in retail trade and pharmaceuticals and existing French-owned pharmaceutical affiliates. Most of the increases in retail trade and about one-half of the increases in chemicals were from newly acquired affiliates.
The largest decreases in value added occurred in mining, finance and insurance, and petroleum and coal products manufacturing affiliates. Value added by affiliates in mining decreased $9.2 billion, or 27.1 percent, due to decreases in oil and gas extraction manufacturing and support activities by Australian-owned affiliates. The decreases in petroleum-related industries mainly reflected decreased prices for petroleum and coal products, which resulted in decreased revenues. Output prices decreased 12.7 percent for oil and gas extraction and 27.7 percent for petroleum and coal products manufacturing.5
Employment by U.S. affiliates represents U.S. jobs that are controlled by foreign parent companies. Employment by majority-owned U.S. affiliates increased 3.9 percent in 2016 to 7.1 million workers, after increasing 3.2 percent in 2015 (tables 1 and 2). The share of U.S. private industry employment accounted for by U.S. affiliates of foreign MNEs was 5.6 percent in 2016, up from 5.5 percent in 2015.
By country of ownership
British-owned affiliates accounted for the largest share of U.S. affiliate employment (17.5 percent), followed by Japanese-owned affiliates (12.1 percent). Employment by British-owned affiliates increased the most in 2016 (112,700 workers), followed by Canadian-owned affiliates (38,000 workers), and Chinese-owned affiliates (34,300 workers). The increases in British-owned and Chinese-owned affiliate employment was largely due to acquisitions of U.S. companies.
By industry of sales
This section uses employment statistics disaggregated by industry of sales (see “Industry Classification of U.S. Affiliate Statistics” for more information on these statistics). In 2016, manufacturing accounted for the largest share of U.S. affiliate employment by industry of sales (29.6 percent). Within manufacturing, motor vehicles, bodies and trailers, and parts accounted for 5.8 percent of U.S. affiliate employment by industry of sales, chemicals accounted for 4.1 percent (half of which was in pharmaceuticals), and food products accounted for 3.5 percent. Outside of manufacturing, administrative and support services (four-fifths of which was in employment services and investigation and security services) had the largest share of U.S. affiliate employment by industry of sales (10.7 percent), followed by retail trade (10.1 percent).
Employment outside of manufacturing increased by 217,800 workers, or 4.6 percent, in 2016. About one-third of this increase was in retail trade, followed by professional, scientific, and technical services and by administrative, support, and waste management. Increases in these industries were offset by decreases in mining and transportation and warehousing. Employment in manufacturing increased by approximately 55,900 workers, or 2.7 percent, primarily reflecting increases in pharmaceuticals and household appliances.
By U.S. region and state
In 2016, New England had the largest regional share of private industry employment that was accounted for by U.S. affiliates (6.8 percent), followed by the Mideast (6.3 percent) and the Great Lakes (6.1 percent). The Rocky Mountains (4.0 percent) and the Plains (4.6 percent) had the lowest shares of private industry employment accounted for by U.S. affiliates (table 3).
The U.S. states with the largest shares of total private industry employment accounted for by U.S. affiliates were New Jersey (8.2 percent), South Carolina (8.2 percent), and Kentucky (8.0 percent), followed by New Hampshire, Indiana, Connecticut, and North Carolina (each more than 7.0 percent) (table 3 and chart 2).
| Thousands of employees | Percentage of total private industry employment in the state 1 |
|||
|---|---|---|---|---|
| 2015 | 2016 | 2015 | 2016 | |
| Total 2 | 6,822.8 | 7,087.9 | 5.5 | 5.6 |
| New England | 417.7 | 434.0 | 6.6 | 6.8 |
| Connecticut | 102.6 | 105.3 | 7.1 | 7.2 |
| Maine | 34.3 | 34.2 | 6.7 | 6.6 |
| Massachusetts | 203.0 | 213.7 | 6.5 | 6.7 |
| New Hampshire | 41.2 | 43.3 | 7.3 | 7.5 |
| Rhode Island | 25.5 | 26.5 | 6.0 | 6.2 |
| Vermont | 11.0 | 11.1 | 4.2 | 4.2 |
| Mideast | 1,205.6 | 1,251.5 | 6.2 | 6.3 |
| Delaware | 25.2 | 25.0 | 6.6 | 6.5 |
| District of Columbia | 23.5 | 24.3 | 4.5 | 4.6 |
| Maryland | 116.9 | 118.3 | 5.4 | 5.4 |
| New Jersey | 270.7 | 283.6 | 8.0 | 8.2 |
| New York | 477.9 | 499.1 | 6.1 | 6.3 |
| Pennsylvania | 291.4 | 301.0 | 5.6 | 5.7 |
| Great Lakes | 1,109.6 | 1,149.9 | 5.9 | 6.1 |
| Illinois | 321.7 | 340.5 | 6.2 | 6.5 |
| Indiana | 189.7 | 193.0 | 7.2 | 7.2 |
| Michigan | 243.3 | 250.3 | 6.6 | 6.7 |
| Ohio | 257.7 | 267.5 | 5.5 | 5.6 |
| Wisconsin | 97.3 | 98.6 | 3.9 | 3.9 |
| Plains | 395.9 | 414.1 | 4.4 | 4.6 |
| Iowa | 59.9 | 60.3 | 4.5 | 4.5 |
| Kansas | 56.1 | 58.0 | 4.8 | 5.0 |
| Minnesota | 113.9 | 119.7 | 4.6 | 4.8 |
| Missouri | 109.8 | 119.2 | 4.6 | 4.9 |
| Nebraska | 31.4 | 32.1 | 3.8 | 3.8 |
| North Dakota | 13.0 | 12.6 | 3.4 | 3.5 |
| South Dakota | 11.9 | 12.1 | 3.3 | 3.4 |
| Southeast | 1,697.4 | 1,773.1 | 5.8 | 6.0 |
| Alabama | 104.6 | 109.1 | 6.5 | 6.7 |
| Arkansas | 46.1 | 47.0 | 4.6 | 4.6 |
| Florida | 331.2 | 348.8 | 4.6 | 4.7 |
| Georgia | 228.9 | 239.2 | 6.3 | 6.4 |
| Kentucky | 120.2 | 129.4 | 7.5 | 8.0 |
| Louisiana | 67.5 | 67.7 | 4.0 | 4.1 |
| Mississippi | 37.4 | 37.9 | 4.1 | 4.1 |
| North Carolina | 252.6 | 260.4 | 7.0 | 7.1 |
| South Carolina | 134.6 | 140.4 | 8.1 | 8.2 |
| Tennessee | 164.2 | 177.1 | 6.6 | 6.9 |
| Virginia | 180.6 | 187.2 | 5.8 | 5.9 |
| West Virginia | 29.4 | 28.9 | 5.1 | 5.2 |
| Southwest | 759.4 | 775.7 | 5.3 | 5.4 |
| Arizona | 104.4 | 108.9 | 4.6 | 4.7 |
| New Mexico | 16.9 | 18.0 | 2.7 | 2.8 |
| Oklahoma | 49.6 | 51.8 | 3.8 | 4.0 |
| Texas | 588.5 | 596.9 | 5.8 | 5.8 |
| Rocky Mountains | 177.2 | 185.1 | 4.0 | 4.0 |
| Colorado | 105.0 | 107.4 | 4.9 | 4.9 |
| Idaho | 15.6 | 15.4 | 2.8 | 2.7 |
| Montana | 6.8 | 7.2 | 1.8 | 1.9 |
| Utah | 42.6 | 47.8 | 3.6 | 3.9 |
| Wyoming | 7.2 | 7.3 | 3.3 | 3.5 |
| Far West | 1,008.9 | 1,052.6 | 5.0 | 5.1 |
| Alaska | 16.3 | 17.2 | 6.3 | 6.7 |
| California | 734.2 | 769.2 | 5.2 | 5.3 |
| Hawaii | 36.7 | 37.2 | 7.1 | 7.0 |
| Nevada | 47.8 | 48.1 | 4.3 | 4.2 |
| Oregon | 60.6 | 65.3 | 4.0 | 4.1 |
| Washington | 113.3 | 115.5 | 4.3 | 4.2 |
| Puerto Rico | 24.0 | 25.0 | n.a.5 | n.a.5 |
| Other U.S. areas 3 | 24.2 | 23.5 | n.a.5 | n.a.5 |
| Foreign 4 | 2.9 | 3.4 | n.a.5 | n.a.5 |
- n.a.
- Not available
- For employment by state, comparable data are available in the table “Full-Time and Part-Time Wage and Salary Employment by Industry (SA27, SA27N)” from BEA’s regional economic accounts, which can be accessed from the interactive tables for “Annual State Personal Income and Employment” under “Regional Data: GDP & Personal Income.” For consistency, U.S. private household employment, available in the same tables, was subtracted from U.S. business nonfarm wage and salary employment by state.
- For consistency with the coverage of the data on U.S. private industry employment, U.S. affiliate employment in Puerto Rico, in “other U.S. areas,” and in “foreign” was excluded from the U.S. affiliate totals when the employment shares were computed. Data on all U.S. private industry employment are derived from line 2 (private industries) of table 6.4D, Full-Time and Part-Time Employees by Industry, in the National Income and Product Accounts (NIPAs) on BEA’s website.
- “Other U.S. areas” consists of the U.S. Virgin Islands, Guam, American Samoa, and all other outlying U.S. areas.
- “Foreign” consists of employees of U.S. affiliates working abroad.
- Data on U.S. private industry employment does not cover employment in Puerto Rico, Other U.S. areas, and Foreign. As a result, employment shares cannot be calculated.

[Click chart to expand]
U.S. affiliate employment increased the most in California (35,000 workers), followed by New York (21,200 workers) and Illinois (18,800 workers) (chart 3). Other states with increases in U.S. affiliate employment of more than 10,000 employees were Florida, New Jersey, Tennessee, Massachusetts, and Georgia.
Affiliate employment decreased the most in West Virginia (600 workers) and North Dakota (300 workers). These decreases reflected both divestments by foreign investors and decreases in employment in existing affiliates in these states.

[Click chart to expand]
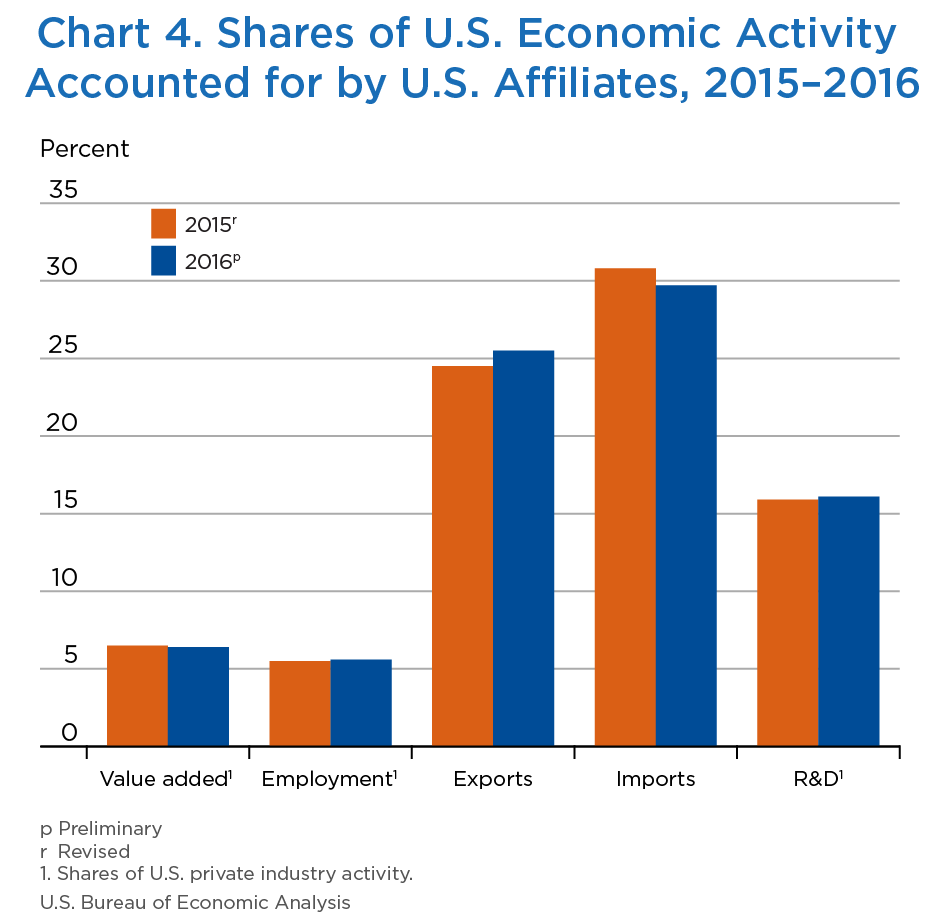
In 2016, U.S. affiliates accounted for 25.5 percent of total U.S. exports of goods, up from 24.5 percent in 2015, and they accounted for 29.7 percent of total U.S. imports of goods, down from 30.8 percent in 2015.6 The larger affiliate share for U.S. exports and imports (25.5 percent and 29.7 percent, respectively) than for value added (6.4 percent) or employment (5.6 percent) reflects the general international orientation of foreign-owned companies and their production and distribution ties with their foreign parents (chart 4). In 2016, intrafirm transactions between affiliates and their foreign parents or other members of their foreign parent groups accounted for 44.1 percent of affiliate exports of goods and for 74.6 percent of affiliate imports of goods.7
[Click chart to expand]
Exports
Exports of goods by U.S. affiliates totaled $369.8 billion in 2016. Japanese-owned affiliates accounted for the largest share of U.S. affiliate exports (23.4 percent), followed by British-owned and German-owned affiliates. Most of the exports of goods by Japanese-owned affiliates were in wholesale trade, including motor vehicles and motor vehicle parts and supplies as well as farm product raw materials, and in manufacturing, especially motor vehicles, bodies, trailers, and parts. The motor vehicles and parts manufacturing and wholesale trade industries were a large source of exports for German-owned affiliates, as was the chemical manufacturing industry. Exports were largest for British-owned affiliates in petroleum and coal products.
Exports of goods by U.S. affiliates increased $0.8 billion, or 0.2 percent, from 2015. The largest contributors were British-owned affiliates, mainly in retail trade, pharmaceuticals, and petroleum and coal product manufacturing.
Imports
Imports of goods by U.S. affiliates totaled $649.9 billion in 2016. Japanese-owned affiliates accounted for the largest share (29.2 percent) of affiliate imports in 2016, followed by German-owned and Korean-owned affiliates. Three-fourths of imports by Japanese-owned affiliates were in wholesale trade, primarily by wholesalers of motor vehicles and motor vehicle parts. Imports by German-owned affiliates were concentrated in manufacturing and wholesale trade, especially motor vehicles and motor vehicle parts.
Imports of goods by U.S. affiliates decreased $43.5 billion, or 6.3 percent, from 2015. Dutch-owned affiliates accounted for more than one-third of the decrease, followed by German-owned and Japanese-owned affiliates. Decreases in imports by Dutch-owned affiliates were concentrated in manufacturing, decreases in imports by German-owned affiliates were concentrated in motor vehicles and motor vehicle parts manufacturing and wholesale trade, and decreases in imports by Japanese-owned affiliates were concentrated in wholesale trade, mainly in professional and commercial equipment.
R&D performed by U.S. affiliates totaled $60.1 billion in 2016, up 6.0 percent from 2015. R&D performed by affiliates accounted for 16.1 percent of the R&D performed by all U.S. businesses in 2016.8 The affiliate share of U.S. business R&D expenditures in 2016 (16.1 percent) was substantially higher than the affiliate share of all U.S. business value added (6.4 percent) or employment (5.6 percent) (chart 4).9
Affiliates of UBOs in seven countries—Switzerland, the United Kingdom, Japan, Germany, France, the Netherlands, and Ireland—accounted for over 80 percent of all R&D expenditures by affiliates. Most of the R&D performed by Swiss-owned and British-owned affiliates was in pharmaceutical manufacturing, while Japanese-owned affiliates performed R&D in several industries in manufacturing and wholesale trade.
Almost three-fourths of the $3.4 billion increase in R&D performed by affiliates was accounted for by European-owned affiliates. Most of the increase by the European-owned affiliates reflected increases from British-owned, Swiss-owned, German-owned, and Dutch-owned affiliates. The increase in R&D performed by European-owned affiliates was concentrated in pharmaceuticals and medicines, followed by motor vehicles and motor vehicle parts and machinery manufacturing.
By industry, more than 60 percent of the increase in R&D performed by affiliates was by pharmaceutical and motor vehicle and motor vehicle parts manufacturing affiliates.
Tables 4.1 through 5.2 follow.
| Millions of dollars | |||||||
|---|---|---|---|---|---|---|---|
| Total assets | Gross property, plant, and equipment | Expenditures for property, plant, and equipment | Sales | Net income | Value added | Compensation of employees | |
| (1) | (2) | (3) | (4) | (5) | (6) | (7) | |
| All industries | 13,317,999 | 2,256,436 | 262,026 | 3,994,467 | 76,053 | 894,029 | 548,520 |
| Manufacturing | 2,484,761 | 958,495 | 94,919 | 1,667,524 | 35,560 | 396,433 | 220,710 |
| Food | 163,493 | 52,254 | 4,838 | 153,253 | 6,829 | 32,736 | 18,557 |
| Beverages and tobacco products | 116,870 | 21,265 | 1,197 | 36,130 | 1,108 | 14,516 | 4,281 |
| Paper | 13,761 | 11,316 | 755 | 13,214 | 97 | 3,520 | 2,249 |
| Petroleum and coal products | 261,435 | 258,929 | 19,306 | 217,229 | −14,031 | 28,553 | 11,636 |
| Chemicals | 821,501 | 178,589 | 22,255 | 352,870 | 15,535 | 97,875 | 45,402 |
| Basic chemicals | 116,369 | 78,982 | 7,504 | 100,861 | 5,723 | 23,426 | 9,296 |
| Pharmaceuticals and medicines | 608,779 | 67,455 | 10,631 | 188,882 | 6,255 | 59,974 | 29,103 |
| Other | 96,353 | 32,152 | 4,120 | 63,127 | 3,557 | 14,474 | 7,003 |
| Plastics and rubber products | 64,095 | 34,544 | 3,105 | 64,844 | 2,925 | 19,357 | 11,487 |
| Nonmetallic mineral products | 98,673 | 69,031 | 3,508 | 49,962 | 663 | 16,761 | 10,448 |
| Primary and fabricated metals | 124,543 | 59,780 | 3,044 | 102,549 | −1,410 | 21,713 | 15,848 |
| Primary metals | 79,145 | 44,009 | 1,962 | 68,640 | −2,474 | 11,678 | 9,116 |
| Fabricated metal products | 45,398 | 15,772 | 1,082 | 33,909 | 1,063 | 10,035 | 6,732 |
| Machinery | 149,438 | 27,242 | 2,538 | 101,386 | 4,825 | 31,216 | 21,562 |
| Computers and electronic products | 121,606 | 25,539 | 2,066 | 73,916 | 2,050 | 19,412 | 14,821 |
| Semiconductors and other electronic components | 41,037 | 11,839 | 782 | 20,970 | 2,509 | 5,847 | 4,027 |
| Navigational, measuring, and other instruments | 41,348 | 8,738 | 666 | 30,950 | −437 | 7,633 | 6,493 |
| Other | 39,221 | 4,962 | 618 | 21,996 | −22 | 5,933 | 4,301 |
| Electrical equipment, appliances, and components | 91,935 | 15,608 | 1,178 | 48,478 | 2,160 | 13,676 | 9,545 |
| Transportation equipment | 361,650 | 179,122 | 29,183 | 392,735 | 12,399 | 75,474 | 40,129 |
| Motor vehicles, bodies and trailers, and parts | 307,220 | 165,951 | 28,112 | 353,486 | 11,733 | 62,949 | 31,106 |
| Other | 54,430 | 13,171 | 1,070 | 39,250 | 666 | 12,525 | 9,023 |
| Other | 95,761 | 25,276 | 1,945 | 60,956 | 2,409 | 21,622 | 14,746 |
| Wholesale trade | 903,563 | 352,282 | 50,836 | 1,112,844 | 6,074 | 104,007 | 59,703 |
| Motor vehicles and motor vehicle parts and supplies | 329,362 | 151,350 | 29,488 | 277,055 | 4,997 | 17,528 | 10,402 |
| Electrical goods | 78,990 | 26,894 | 2,803 | 146,756 | 953 | 15,953 | 10,247 |
| Petroleum and petroleum products | 141,952 | 102,758 | 10,257 | 264,922 | −5,462 | 10,463 | 2,210 |
| Other | 353,259 | 71,281 | 8,289 | 424,111 | 5,585 | 60,063 | 36,844 |
| Retail trade | 111,183 | 68,560 | 8,719 | 177,955 | 3,195 | 38,597 | 21,214 |
| Food and beverage stores | 41,049 | 37,771 | 2,874 | 92,748 | 1,935 | 19,000 | 10,340 |
| Other | 70,134 | 30,789 | 5,845 | 85,208 | 1,260 | 19,597 | 10,874 |
| Information | 403,840 | 102,181 | 15,341 | 149,998 | −4,452 | 41,840 | 27,015 |
| Publishing industries | 54,720 | 4,565 | 373 | 21,418 | 723 | 9,077 | 6,673 |
| Telecommunications | 201,300 | 80,885 | 13,508 | 83,791 | −3,471 | 19,510 | 8,813 |
| Other | 147,820 | 16,730 | 1,460 | 44,789 | −1,703 | 13,252 | 11,529 |
| Finance and insurance | 7,934,160 | 110,279 | 26,294 | 347,332 | 21,110 | 93,983 | 72,587 |
| Depository credit intermediation (banking) | 3,839,117 | 23,724 | 2,297 | 75,047 | 8,241 | 24,728 | 17,196 |
| Finance, except depository institutions | 2,147,878 | 59,956 | (D) | 120,189 | 1,809 | 30,121 | 34,152 |
| Insurance carriers and related activities | 1,947,165 | 26,599 | (D) | 152,096 | 11,060 | 39,134 | 21,240 |
| Real estate and rental and leasing | 209,013 | 144,594 | 17,497 | 32,697 | 1,165 | 16,409 | 4,457 |
| Real estate | 122,566 | 100,057 | 9,616 | 18,440 | −398 | 8,308 | 2,275 |
| Rental and leasing (except real estate) | 86,447 | 44,537 | 7,881 | 14,257 | 1,563 | 8,101 | 2,182 |
| Professional, scientific, and technical services | 216,915 | 21,304 | 2,337 | 127,481 | 4,744 | 48,763 | 39,381 |
| Architectural, engineering, and related services | 28,909 | 4,868 | 394 | 19,658 | −463 | 7,844 | 7,240 |
| Computer systems design and related services | 69,711 | 6,279 | 1,044 | 35,420 | 294 | 13,380 | 10,909 |
| Management, scientific, and technical consulting | 43,367 | 1,457 | 101 | 21,502 | 2,388 | 11,210 | 9,050 |
| Other | 74,927 | 8,700 | 797 | 50,900 | 2,524 | 16,329 | 12,183 |
| Other industries | 1,054,564 | 498,741 | 46,083 | 378,636 | 8,657 | 153,997 | 103,453 |
| Mining | 260,552 | 223,335 | 21,057 | 71,699 | −16,795 | 33,921 | 15,711 |
| Utilities | 179,988 | 139,490 | 11,669 | 52,806 | 458 | 14,707 | 5,032 |
| Construction | 65,052 | 12,995 | 3,372 | 64,992 | 2,308 | 12,172 | 9,970 |
| Transportation and warehousing | 109,657 | 67,009 | 4,317 | 62,715 | 364 | 22,189 | 13,940 |
| Administration, support, and waste management | 67,395 | 11,881 | 1,387 | 53,305 | 1,734 | 35,648 | 30,992 |
| Health care and social assistance | 25,861 | 5,681 | 707 | 15,011 | 471 | 8,422 | 6,664 |
| Accommodation and food services | 41,492 | 23,156 | 1,953 | 37,651 | 375 | 19,256 | 15,447 |
| Other | 304,567 | 15,194 | 1,621 | 20,457 | 19,741 | 7,682 | 5,697 |
- (*)
- Less than $500,000.
- D
- Suppressed to avoid disclosure of data on individual companies.
| Thousands of employees | Millions of dollars | |||
|---|---|---|---|---|
| U.S. exports of goods shipped by affiliates | U.S. imports of goods shipped to affiliates | Research and development performed by affiliates | ||
| (8) | (9) | (10) | (11) | |
| All industries | 6,823 | 368,939 | 693,456 | 56,731 |
| Manufacturing | 2,425 | 211,683 | 288,819 | 39,546 |
| Food | 296 | 18,795 | 8,744 | 694 |
| Beverages and tobacco products | 51 | 1,803 | 2,867 | 49 |
| Paper | 27 | 1,623 | 1,170 | 61 |
| Petroleum and coal products | 46 | 22,033 | 33,758 | (D) |
| Chemicals | 343 | 42,133 | 58,966 | 20,608 |
| Basic chemicals | 85 | 16,456 | 15,808 | 737 |
| Pharmaceuticals and medicines | 187 | 17,253 | 30,850 | 19,156 |
| Other | 71 | 8,423 | 12,308 | 715 |
| Plastics and rubber products | 156 | 7,618 | 13,714 | 559 |
| Nonmetallic mineral products | 129 | 1,764 | 1,305 | 300 |
| Primary and fabricated metals | 188 | 8,424 | 13,947 | 546 |
| Primary metals | 100 | 4,984 | 7,821 | 176 |
| Fabricated metal products | 88 | 3,441 | 6,126 | 370 |
| Machinery | 217 | 19,005 | 15,639 | 2,267 |
| Computers and electronic products | 149 | 13,881 | 14,802 | 5,314 |
| Semiconductors and other electronic components | 39 | 4,267 | 4,358 | 1,843 |
| Navigational, measuring, and other instruments | 68 | 7,574 | 6,941 | 1,726 |
| Other | 43 | 2,040 | 3,504 | 1,745 |
| Electrical equipment, appliances, and components | 110 | 6,596 | 7,757 | 1,129 |
| Transportation equipment | 506 | 59,056 | 108,693 | 6,545 |
| Motor vehicles, bodies and trailers, and parts | 403 | 51,362 | 104,485 | 5,594 |
| Other | 103 | 7,695 | 4,208 | 951 |
| Other | 206 | 8,951 | 7,458 | (D) |
| Wholesale trade | 670 | 145,088 | 383,444 | 9,134 |
| Motor vehicles and motor vehicle parts and supplies | 107 | 24,823 | 126,951 | 608 |
| Electrical goods | 101 | 22,807 | 80,678 | 2,767 |
| Petroleum and petroleum products | 19 | 40,441 | 39,994 | (D) |
| Other | 443 | 57,017 | 135,820 | (D) |
| Retail trade | 594 | 1,103 | 16,467 | 28 |
| Food and beverage stores | 301 | 11 | (D) | 0 |
| Other | 293 | 1,092 | (D) | 28 |
| Information | 295 | 828 | 167 | 1,015 |
| Publishing industries | 77 | (D) | 120 | 637 |
| Telecommunications | 96 | 1 | 6 | (D) |
| Other | 121 | (D) | 41 | (D) |
| Finance and insurance | 400 | (D) | (*) | 69 |
| Depository credit intermediation (banking) | 122 | 0 | 0 | 1 |
| Finance, except depository institutions | 126 | (D) | (*) | 67 |
| Insurance carriers and related activities | 151 | 0 | (*) | 1 |
| Real estate and rental and leasing | 64 | (D) | (D) | 161 |
| Real estate | 38 | 0 | 0 | (*) |
| Rental and leasing (except real estate) | 26 | (D) | (D) | 161 |
| Professional, scientific, and technical services | 359 | 1,061 | 368 | 5,808 |
| Architectural, engineering, and related services | 70 | (D) | 334 | 240 |
| Computer systems design and related services | 96 | (D) | (D) | 1,555 |
| Management, scientific, and technical consulting | 77 | (D) | (*) | (D) |
| Other | 115 | 0 | (D) | (D) |
| Other industries | 2,018 | 8,766 | (D) | 971 |
| Mining | 122 | 6,827 | 1,943 | 484 |
| Utilities | 48 | 372 | 884 | 5 |
| Construction | 95 | (D) | (D) | (D) |
| Transportation and warehousing | 294 | 3 | (D) | (D) |
| Administration, support, and waste management | 744 | (D) | (D) | (D) |
| Health care and social assistance | 110 | (D) | 0 | (D) |
| Accommodation and food services | 495 | (D) | (*) | (*) |
| Other | 110 | 989 | 267 | 200 |
- (*)
- Less than $500,000.
- D
- Suppressed to avoid disclosure of data on individual companies.
| Millions of dollars | |||||||
|---|---|---|---|---|---|---|---|
| Total assets | Gross property, plant, and equipment | Expenditures for property, plant, and equipment | Sales | Net income | Value added | Compensation of employees | |
| (1) | (2) | (3) | (4) | (5) | (6) | (7) | |
| All industries | 13,389,403 | 2,335,532 | 258,886 | 4,054,918 | 85,796 | 910,599 | 575,678 |
| Manufacturing | 2,594,038 | 1,008,478 | 98,353 | 1,681,757 | 49,322 | 405,199 | 228,201 |
| Food | 159,033 | 53,959 | 4,667 | 156,476 | 7,839 | 34,468 | 19,858 |
| Beverages and tobacco products | 118,029 | 21,606 | 1,209 | 36,643 | 1,471 | 15,052 | 4,496 |
| Paper | 14,933 | 11,289 | 751 | 13,537 | 27 | 3,726 | 2,402 |
| Petroleum and coal products | 266,217 | 262,763 | 19,899 | 212,240 | −11,146 | 23,863 | 12,027 |
| Chemicals | 901,117 | 210,610 | 24,176 | 358,812 | 23,437 | 106,252 | 48,823 |
| Basic chemicals | 119,129 | 79,917 | 7,371 | 98,656 | 5,597 | 22,910 | 9,426 |
| Pharmaceuticals and medicines | 677,874 | 95,994 | 12,602 | 195,262 | 13,924 | 67,928 | 31,777 |
| Other | 104,115 | 34,700 | 4,203 | 64,894 | 3,916 | 15,413 | 7,620 |
| Plastics and rubber products | 65,153 | 35,337 | 3,114 | 65,666 | 3,921 | 20,159 | 11,930 |
| Nonmetallic mineral products | 92,856 | 69,666 | 3,284 | 50,060 | 1,148 | 17,615 | 10,602 |
| Primary and fabricated metals | 116,275 | 54,988 | 3,001 | 88,111 | 1,500 | 19,797 | 13,969 |
| Primary metals | 70,889 | 39,289 | 1,877 | 54,910 | 239 | 9,942 | 7,295 |
| Fabricated metal products | 45,386 | 15,699 | 1,124 | 33,201 | 1,260 | 9,856 | 6,674 |
| Machinery | 164,193 | 29,940 | 2,820 | 106,083 | 5,067 | 34,258 | 23,181 |
| Computers and electronic products | 129,648 | 26,662 | 2,293 | 74,990 | −445 | 18,966 | 14,796 |
| Semiconductors and other electronic components | 48,228 | 13,140 | 854 | 23,748 | 154 | 5,590 | 4,065 |
| Navigational, measuring, and other instruments | 40,007 | 8,248 | 810 | 29,383 | 57 | 7,760 | 6,397 |
| Other | 41,414 | 5,273 | 630 | 21,860 | −656 | 5,616 | 4,334 |
| Electrical equipment, appliances, and components | 100,025 | 18,420 | 1,351 | 54,420 | 2,436 | 15,534 | 10,879 |
| Transportation equipment | 364,159 | 185,864 | 29,798 | 399,920 | 11,477 | 72,912 | 39,678 |
| Motor vehicles, bodies and trailers, and parts | 309,707 | 172,245 | 28,664 | 362,193 | 10,886 | 60,868 | 31,052 |
| Other | 54,452 | 13,619 | 1,134 | 37,727 | 592 | 12,044 | 8,626 |
| Other | 102,401 | 27,374 | 1,990 | 64,800 | 2,590 | 22,596 | 15,560 |
| Wholesale trade | 925,331 | 361,537 | 48,886 | 1,114,759 | 12,339 | 108,581 | 65,038 |
| Motor vehicles and motor vehicle parts and supplies | 338,554 | 157,211 | 29,783 | 280,536 | 4,465 | 17,903 | 11,185 |
| Electrical goods | 79,235 | 26,819 | 2,803 | 147,022 | 1,168 | 16,464 | 10,887 |
| Petroleum and petroleum products | 139,752 | 103,139 | 8,583 | 269,014 | −193 | 10,747 | 2,231 |
| Other | 367,790 | 74,368 | 7,717 | 418,186 | 6,899 | 63,467 | 40,736 |
| Retail trade | 122,977 | 73,651 | 9,288 | 193,519 | 3,555 | 48,700 | 29,321 |
| Food and beverage stores | 43,694 | 39,421 | 2,945 | 96,100 | 2,067 | 20,138 | 11,124 |
| Other | 79,283 | 34,230 | 6,343 | 97,419 | 1,488 | 28,562 | 18,197 |
| Information | 409,608 | 110,313 | 14,177 | 158,067 | −3,817 | 47,269 | 28,213 |
| Publishing industries | 56,313 | 4,795 | 404 | 22,420 | 599 | 9,437 | 6,938 |
| Telecommunications | 199,343 | 86,648 | 12,221 | 83,123 | −2,486 | 22,908 | 8,718 |
| Other | 153,952 | 18,869 | 1,551 | 52,523 | −1,930 | 14,924 | 12,557 |
| Finance and insurance | 7,858,991 | 118,255 | 28,545 | 384,800 | 21,996 | 89,383 | 74,461 |
| Depository credit intermediation (banking) | 3,832,537 | 23,778 | 2,432 | 91,225 | 11,547 | 27,930 | 18,717 |
| Finance, except depository institutions | 1,890,295 | 65,027 | (D) | 115,075 | 4,268 | 25,307 | 32,465 |
| Insurance carriers and related activities | 2,136,159 | 29,449 | (D) | 178,500 | 6,182 | 36,146 | 23,279 |
| Real estate and rental and leasing | 204,185 | 138,212 | 18,072 | 30,964 | −577 | 13,763 | 4,628 |
| Real estate | 115,131 | 93,766 | 10,885 | 17,013 | −1,167 | 7,019 | 2,343 |
| Rental and leasing (except real estate) | 89,054 | 44,446 | 7,186 | 13,951 | 590 | 6,744 | 2,286 |
| Professional, scientific, and technical services | 235,243 | 26,394 | 2,058 | 136,523 | 2,491 | 50,268 | 42,604 |
| Architectural, engineering, and related services | 35,501 | 7,704 | 564 | 19,793 | −803 | 7,512 | 7,075 |
| Computer systems design and related services | 76,482 | 7,213 | 672 | 39,616 | 120 | 14,361 | 12,508 |
| Management, scientific, and technical consulting | 48,657 | 2,760 | 205 | 23,741 | 2,518 | 12,055 | 9,604 |
| Other | 74,602 | 8,716 | 617 | 53,372 | 656 | 16,339 | 13,417 |
| Other industries | 1,039,030 | 498,693 | 39,507 | 354,529 | 488 | 147,436 | 103,211 |
| Mining | 234,117 | 208,762 | 15,799 | 57,229 | −18,837 | 24,741 | 13,254 |
| Utilities | 185,204 | 148,870 | 9,613 | 45,841 | 1,981 | 17,686 | 5,345 |
| Construction | 65,870 | 13,819 | 3,488 | 61,437 | 1,844 | 11,102 | 9,626 |
| Transportation and warehousing | 109,491 | 68,384 | 4,625 | 57,525 | −899 | 20,094 | 13,534 |
| Administration, support, and waste management | 75,114 | 13,526 | 1,516 | 57,315 | 1,133 | 37,097 | 32,674 |
| Health care and social assistance | 26,462 | 6,181 | 750 | 16,020 | 721 | 9,567 | 7,378 |
| Accommodation and food services | 42,740 | 23,632 | 1,957 | 39,091 | 254 | 20,192 | 16,274 |
| Other | 300,031 | 15,519 | 1,759 | 20,071 | 14,292 | 6,956 | 5,126 |
- (*)
- Less than $500,000.
- D
- Suppressed to avoid disclosure of data on individual companies.
| Thousands of employees | Millions of dollars | |||
|---|---|---|---|---|
| U.S. exports of goods shipped by affiliates | U.S. imports of goods shipped to affiliates | Research and development performed by affiliates | ||
| (8) | (9) | (10) | (11) | |
| All industries | 7,088 | 369,770 | 649,911 | 60,140 |
| Manufacturing | 2,478 | 218,360 | 263,365 | 43,031 |
| Food | 301 | 19,031 | 8,568 | 752 |
| Beverages and tobacco products | 52 | 1,860 | 3,013 | 51 |
| Paper | 31 | 1,691 | 1,226 | 58 |
| Petroleum and coal products | 45 | 22,298 | 29,847 | (D) |
| Chemicals | 364 | 42,569 | 58,177 | 22,105 |
| Basic chemicals | 84 | 16,599 | 16,049 | 746 |
| Pharmaceuticals and medicines | 206 | 17,095 | 29,319 | 20,590 |
| Other | 75 | 8,875 | 12,810 | 769 |
| Plastics and rubber products | 157 | 7,752 | 14,361 | 572 |
| Nonmetallic mineral products | 128 | 1,652 | 1,309 | 303 |
| Primary and fabricated metals | 168 | 7,109 | 9,729 | 543 |
| Primary metals | 83 | 3,823 | 4,241 | 152 |
| Fabricated metal products | 85 | 3,286 | 5,488 | 391 |
| Machinery | 228 | 24,459 | 14,605 | 2,852 |
| Computers and electronic products | 153 | 14,653 | 15,803 | 5,641 |
| Semiconductors and other electronic components | 42 | 4,631 | 5,241 | 1,905 |
| Navigational, measuring, and other instruments | 68 | 7,652 | 6,896 | 1,804 |
| Other | 44 | 2,369 | 3,665 | 1,932 |
| Electrical equipment, appliances, and components | 124 | 8,423 | 9,225 | 1,269 |
| Transportation equipment | 510 | 58,047 | 89,590 | 7,304 |
| Motor vehicles, bodies and trailers, and parts | 407 | 49,955 | 86,672 | 6,290 |
| Other | 103 | 8,093 | 2,918 | 1,014 |
| Other | 217 | 8,816 | 7,912 | (D) |
| Wholesale trade | 680 | 139,074 | 361,095 | 9,080 |
| Motor vehicles and motor vehicle parts and supplies | 107 | 24,924 | 122,426 | 678 |
| Electrical goods | 98 | 22,188 | 75,781 | 2,793 |
| Petroleum and petroleum products | 19 | 40,006 | 36,189 | (D) |
| Other | 456 | 51,956 | 126,698 | (D) |
| Retail trade | 675 | 2,295 | 20,944 | 26 |
| Food and beverage stores | 301 | 10 | (D) | 0 |
| Other | 374 | 2,285 | (D) | 26 |
| Information | 317 | 821 | 181 | 1,079 |
| Publishing industries | 81 | 721 | 128 | 643 |
| Telecommunications | 99 | 1 | 6 | (D) |
| Other | 137 | 99 | 47 | (D) |
| Finance and insurance | 421 | (D) | (*) | 69 |
| Depository credit intermediation (banking) | 129 | 0 | 0 | 1 |
| Finance, except depository institutions | 124 | (D) | (*) | 67 |
| Insurance carriers and related activities | 168 | 0 | (*) | 1 |
| Real estate and rental and leasing | 62 | (D) | (D) | 145 |
| Real estate | 37 | 0 | 0 | (*) |
| Rental and leasing (except real estate) | 25 | (D) | (D) | 145 |
| Professional, scientific, and technical services | 394 | (D) | 355 | 5,827 |
| Architectural, engineering, and related services | 75 | (D) | 321 | 232 |
| Computer systems design and related services | 111 | (D) | (D) | 1,701 |
| Management, scientific, and technical consulting | 84 | (D) | (*) | (D) |
| Other | 125 | 0 | (D) | (D) |
| Other industries | 2,061 | 7,939 | (D) | 884 |
| Mining | 107 | 6,380 | 1,893 | (D) |
| Utilities | 49 | 47 | 534 | 5 |
| Construction | 94 | (D) | 424 | (D) |
| Transportation and warehousing | 289 | 3 | (D) | 1 |
| Administration, support, and waste management | 783 | (D) | (D) | (D) |
| Health care and social assistance | 113 | (D) | 0 | (D) |
| Accommodation and food services | 511 | (D) | 2 | (*) |
| Other | 114 | 947 | 235 | 183 |
- (*)
- Less than $500,000.
- D
- Suppressed to avoid disclosure of data on individual companies.
| Millions of dollars | ||||||||
|---|---|---|---|---|---|---|---|---|
| Total assets | Gross property, plant, and equipment | Expenditures for property, plant, and equipment |
Sales | Net income | Value added | Compensation of employees | ||
| (1) | (2) | (3) | (4) | (5) | (6) | (7) | ||
| All countries | 13,317,999 | 2,256,436 | 262,026 | 3,994,467 | 76,053 | 894,029 | 548,520 | |
| Canada | 1,829,187 | 306,868 | 31,221 | 303,809 | 2,718 | 81,936 | 46,014 | |
| Europe | 7,869,659 | 1,213,497 | 130,049 | 2,186,886 | 57,025 | 547,979 | 351,280 | |
| Belgium | 156,837 | 27,770 | 1,707 | 52,383 | 1,148 | 15,749 | 6,901 | |
| Denmark | 27,312 | 7,621 | 628 | 25,901 | 872 | 5,793 | 3,699 | |
| Finland | 55,668 | 5,275 | 349 | 14,122 | 75 | 3,400 | 2,353 | |
| France | 1,136,783 | 109,581 | 7,889 | 278,043 | 9,856 | 79,308 | 50,488 | |
| Germany | 1,507,635 | 273,327 | 43,294 | 477,949 | 14,260 | 107,949 | 63,654 | |
| Ireland | 468,728 | 42,121 | 2,983 | 110,181 | 7,704 | 38,888 | 27,112 | |
| Italy | 88,637 | 40,828 | 3,835 | 36,685 | −359 | 9,094 | 4,871 | |
| Netherlands | 730,307 | 92,055 | 9,189 | 293,241 | 15,180 | 57,517 | 33,968 | |
| Spain | 372,416 | 51,433 | 5,860 | 49,184 | 413 | 7,577 | 7,586 | |
| Sweden | 134,072 | 20,331 | 2,152 | 71,192 | 1,926 | 18,323 | 12,796 | |
| Switzerland | 1,157,388 | 86,072 | 7,837 | 222,052 | 13,661 | 73,285 | 46,204 | |
| United Kingdom | 1,936,913 | 381,735 | 36,877 | 518,043 | −402 | 122,703 | 87,059 | |
| Other | 96,963 | 75,350 | 7,448 | 37,911 | −7,311 | 8,392 | 4,588 | |
| Latin America and Other Western Hemisphere | 474,315 | 104,623 | 9,581 | 288,939 | 2,536 | 50,047 | 30,210 | |
| South and Central America | 217,027 | 53,419 | 4,140 | 112,651 | 1,665 | 21,324 | 11,433 | |
| Brazil | 109,454 | 19,546 | 1,804 | 45,941 | 198 | 7,311 | 4,401 | |
| Mexico | 46,447 | 17,475 | 1,185 | 33,469 | 1,221 | 7,341 | 5,034 | |
| Venezuela | 20,644 | (D) | (D) | (D) | 847 | (D) | 856 | |
| Other | 40,482 | (D) | (D) | (D) | −602 | (D) | 1,142 | |
| Other Western Hemisphere | 257,288 | 51,205 | 5,442 | 176,289 | 871 | 28,723 | 18,777 | |
| Bermuda | 182,992 | 27,889 | 2,930 | 91,972 | 1,224 | 14,373 | 8,713 | |
| United Kingdom Islands, Caribbean 1 | (D) | (D) | (D) | (D) | −372 | 8,101 | 5,339 | |
| Other | (D) | (D) | (D) | (D) | 20 | 6,249 | 4,725 | |
| Africa | 9,901 | 7,987 | (D) | 6,240 | 140 | 1,475 | 682 | |
| South Africa | 7,487 | (D) | (D) | 5,840 | (D) | 1,357 | 575 | |
| Other | 2,414 | (D) | 14 | 400 | (D) | 117 | 107 | |
| Middle East | 171,549 | 49,096 | 4,330 | 80,178 | 236 | 16,802 | 5,951 | |
| Israel | 84,177 | 3,770 | 333 | 21,041 | −370 | 4,150 | 2,262 | |
| Saudi Arabia | 34,655 | 27,074 | 1,652 | 44,456 | 1,363 | 10,428 | 1,723 | |
| United Arab Emirates | 38,990 | 11,474 | (D) | (D) | 243 | 1,380 | 971 | |
| Other | 13,727 | 6,777 | (D) | (D) | −1,000 | 844 | 995 | |
| Asia and Pacific | 2,764,464 | 561,409 | 83,609 | 1,083,607 | 9,336 | 179,798 | 102,140 | |
| Australia | 233,315 | 69,993 | 6,400 | 49,933 | 426 | 15,880 | 7,568 | |
| China | 203,284 | 31,193 | 4,118 | 22,837 | −483 | 6,104 | 2,857 | |
| Hong Kong | 43,584 | 17,045 | 1,231 | 27,753 | 10 | 4,757 | 2,907 | |
| India | 59,368 | 6,087 | 650 | 26,314 | 471 | 6,532 | 4,801 | |
| Japan | 1,980,216 | 363,007 | 64,705 | 768,873 | 8,163 | 124,882 | 72,875 | |
| Korea, Republic of | 114,946 | 49,322 | 4,614 | 141,291 | 770 | 11,460 | 4,707 | |
| Singapore | 59,220 | 9,488 | 1,049 | 18,206 | −216 | 3,492 | 2,708 | |
| Taiwan | 38,923 | 5,122 | 226 | 10,445 | 334 | 1,873 | 965 | |
| Other | 31,609 | 10,152 | 615 | 17,956 | −138 | 4,818 | 2,751 | |
| United States | 198,925 | 12,956 | (D) | 44,808 | 4,062 | 15,991 | 12,243 | |
| Addenda: | ||||||||
| European Union (28) 2 | 6,656,826 | 1,082,989 | (D) | 1,943,019 | 49,808 | 470,360 | 302,961 | |
| OPEC 3 | 104,733 | 52,698 | 4,166 | 81,999 | 2,207 | 17,177 | 3,846 | |
- D
- Suppressed to avoid disclosure of data on individual companies.
- The “United Kingdom Islands, Caribbean” consists of the British Virgin Islands, the Cayman Islands, Montserrat, and the Turks and Caicos Islands.
- The European Union (28) comprises Austria, Belgium, Bulgaria, Croatia, Cyprus, Czech Republic, Denmark, Estonia, Finland, France, Germany, Greece, Hungary, Ireland, Italy, Latvia, Lithuania, Luxembourg, Malta, the Netherlands, Poland, Portugal, Romania, Slovakia, Slovenia, Spain, Sweden, and the United Kingdom.
- OPEC is the Organization of Petroleum Exporting Countries. Its members are Algeria, Angola, Ecuador, Iran, Iraq, Kuwait, Libya, Nigeria, Qatar, Saudi Arabia, the United Arab Emirates, and Venezuela.
| Thousands of employees | Millions of dollars | |||
|---|---|---|---|---|
| U.S. exports of goods shipped by affiliates | U.S. imports of goods shipped to affiliates | Research and development performed by affiliates | ||
| (8) | (9) | (10) | (11) | |
| All countries | 6,823 | 368,939 | 693,456 | 56,731 |
| Canada | 641 | 13,432 | 18,440 | 906 |
| Europe | 4,341 | 192,062 | 310,837 | 41,242 |
| Belgium | 148 | 2,011 | 4,232 | 377 |
| Denmark | 40 | 1,269 | 11,020 | 433 |
| Finland | 23 | 1,318 | 3,251 | 120 |
| France | 738 | 26,641 | 34,151 | 5,355 |
| Germany | 682 | 40,207 | 95,778 | 7,269 |
| Ireland | 259 | 8,357 | 8,418 | 3,516 |
| Italy | 77 | 1,546 | 5,894 | 183 |
| Netherlands | 454 | 39,799 | 63,458 | 4,659 |
| Spain | 81 | 879 | 870 | 107 |
| Sweden | 207 | 7,139 | 10,579 | 670 |
| Switzerland | 458 | 16,867 | 13,342 | 10,042 |
| United Kingdom | 1,125 | 43,837 | 54,701 | 8,377 |
| Other | 51 | 2,192 | 5,144 | 135 |
| Latin America and Other Western Hemisphere | 360 | 42,630 | 37,911 | 1,697 |
| South and Central America | 182 | 9,650 | 15,191 | 97 |
| Brazil | 79 | 3,998 | 2,906 | (D) |
| Mexico | 79 | 1,132 | 3,424 | 33 |
| Venezuela | 6 | (D) | (D) | 0 |
| Other | 18 | (D) | (D) | (D) |
| Other Western Hemisphere | 178 | 32,980 | 22,719 | 1,599 |
| Bermuda | 62 | (D) | 4,226 | (D) |
| United Kingdom Islands, Caribbean 1 | 88 | 3,006 | (D) | 783 |
| Other | 28 | (D) | (D) | (D) |
| Africa | 7 | 695 | (D) | (D) |
| South Africa | 6 | 695 | (D) | (D) |
| Other | 2 | 0 | 0 | 1 |
| Middle East | 62 | 2,668 | 18,894 | 1,667 |
| Israel | 20 | 607 | 7,537 | 863 |
| Saudi Arabia | 11 | (D) | (D) | (D) |
| United Arab Emirates | 12 | 330 | (D) | (D) |
| Other | 19 | (D) | 107 | 6 |
| Asia and Pacific | 1,198 | 113,583 | 302,440 | 10,872 |
| Australia | 74 | 3,543 | 2,870 | 173 |
| China | 46 | 3,288 | 4,326 | 548 |
| Hong Kong | 32 | 780 | 10,724 | (D) |
| India | 56 | 1,407 | 3,648 | 107 |
| Japan | 847 | 87,068 | 197,620 | 7,776 |
| Korea, Republic of | 52 | 14,346 | 74,123 | 1,067 |
| Singapore | 36 | 1,220 | 1,171 | 388 |
| Taiwan | 14 | 857 | 4,401 | 121 |
| Other | 42 | 1,073 | 3,556 | (D) |
| United States | 214 | 3,871 | (D) | (D) |
| Addenda: | ||||
| European Union (28) 2 | 3,862 | 173,978 | 294,882 | 31,125 |
| OPEC 3 | 31 | 5,788 | 18,392 | 798 |
- D
- Suppressed to avoid disclosure of data on individual companies.
- The “United Kingdom Islands, Caribbean” consists of the British Virgin Islands, the Cayman Islands, Montserrat, and the Turks and Caicos Islands.
- The European Union (28) comprises Austria, Belgium, Bulgaria, Croatia, Cyprus, Czech Republic, Denmark, Estonia, Finland, France, Germany, Greece, Hungary, Ireland, Italy, Latvia, Lithuania, Luxembourg, Malta, the Netherlands, Poland, Portugal, Romania, Slovakia, Slovenia, Spain, Sweden, and the United Kingdom.
- OPEC is the Organization of Petroleum Exporting Countries. Its members are Algeria, Angola, Ecuador, Iran, Iraq, Kuwait, Libya, Nigeria, Qatar, Saudi Arabia, the United Arab Emirates, and Venezuela.
| Millions of dollars | |||||||
|---|---|---|---|---|---|---|---|
| Total assets | Gross property, plant, and equipment | Expenditures for property, plant, and equipment |
Sales | Net income | Value added | Compensation of employees | |
| (1) | (2) | (3) | (4) | (5) | (6) | (7) | |
| All countries | 13,389,403 | 2,335,532 | 258,886 | 4,054,918 | 85,796 | 910,599 | 575,678 |
| Canada | 1,859,615 | 320,134 | 29,717 | 319,230 | 5,006 | 80,846 | 49,090 |
| Europe | 7,710,940 | 1,255,579 | 129,918 | 2,232,902 | 73,307 | 562,630 | 367,452 |
| Belgium | 151,167 | 28,229 | 1,538 | 52,291 | 1,738 | 16,112 | 7,187 |
| Denmark | 27,903 | 7,615 | 631 | 25,613 | 867 | 5,821 | 3,819 |
| Finland | 59,177 | 5,091 | 320 | 14,602 | −58 | 3,589 | 2,609 |
| France | 1,054,209 | 107,523 | 7,950 | 278,707 | 12,018 | 80,823 | 52,084 |
| Germany | 1,382,697 | 270,178 | 42,686 | 470,783 | 17,539 | 104,805 | 65,210 |
| Ireland | 472,398 | 42,234 | 2,842 | 109,463 | 7,613 | 38,815 | 27,256 |
| Italy | 91,054 | 40,489 | 3,508 | 36,381 | −81 | 9,217 | 5,091 |
| Netherlands | 730,913 | 95,138 | 9,128 | 323,110 | 14,553 | 56,194 | 35,071 |
| Spain | 379,293 | 53,208 | 3,605 | 49,387 | 1,707 | 7,444 | 8,001 |
| Sweden | 126,539 | 21,031 | 2,123 | 70,286 | 1,588 | 18,411 | 13,293 |
| Switzerland | 1,176,920 | 89,707 | 8,753 | 232,511 | 13,016 | 73,942 | 47,941 |
| United Kingdom | 1,966,875 | 417,026 | 39,674 | 533,544 | 5,514 | 138,801 | 95,401 |
| Other | 91,795 | 78,110 | 7,159 | 36,223 | −2,707 | 8,656 | 4,486 |
| Latin America and Other Western Hemisphere | 476,341 | 95,608 | 8,748 | 285,337 | 1,384 | 45,204 | 30,682 |
| South and Central America | 196,427 | 53,571 | 3,861 | 107,759 | 893 | 19,575 | 12,045 |
| Brazil | 92,280 | 19,851 | 1,295 | 44,180 | 30 | 6,969 | 4,621 |
| Mexico | 47,066 | 17,135 | 1,169 | 33,967 | 1,430 | 7,600 | 5,210 |
| Venezuela | 21,412 | (D) | (D) | (D) | 51 | (D) | 889 |
| Other | 35,667 | (D) | (D) | (D) | −618 | (D) | 1,325 |
| Other Western Hemisphere | 279,915 | 42,037 | 4,887 | 177,577 | 492 | 25,629 | 18,637 |
| Bermuda | 202,249 | 16,827 | 2,165 | 92,526 | 989 | 11,373 | 8,449 |
| United Kingdom Islands, Caribbean 1 | (D) | (D) | (D) | (D) | −292 | 8,464 | 5,612 |
| Other | (D) | (D) | (D) | (D) | −206 | 5,791 | 4,576 |
| Africa | 12,808 | 6,828 | (D) | 6,003 | 202 | 1,464 | 713 |
| South Africa | 6,988 | (D) | (D) | 5,644 | 117 | 1,240 | 515 |
| Other | 5,819 | (D) | 17 | 359 | 84 | 225 | 198 |
| Middle East | 205,861 | 50,164 | 4,602 | 79,076 | 1,304 | 16,780 | 5,451 |
| Israel | 119,354 | 4,396 | 312 | 21,312 | 116 | 5,207 | 2,545 |
| Saudi Arabia | 34,435 | 27,801 | 1,922 | 43,382 | 536 | (D) | 937 |
| United Arab Emirates | 39,002 | 11,145 | (D) | (D) | 639 | 1,748 | 1,001 |
| Other | 13,069 | 6,822 | (D) | (D) | 13 | (D) | 968 |
| Asia and Pacific | 2,934,376 | 593,828 | 82,938 | 1,088,053 | 2,185 | 188,682 | 109,788 |
| Australia | 238,442 | 70,479 | 4,256 | 45,758 | −8,450 | 11,448 | 7,464 |
| China | 215,719 | 36,414 | 4,323 | 34,493 | −457 | 9,170 | 5,013 |
| Hong Kong | 45,538 | 17,624 | 1,367 | 26,967 | −168 | 4,470 | 2,986 |
| India | 58,815 | 6,433 | 634 | 27,861 | 532 | 7,459 | 5,921 |
| Japan | 2,110,496 | 382,584 | 66,153 | 765,925 | 9,659 | 134,525 | 76,573 |
| Korea, Republic of | 120,665 | 51,441 | 3,829 | 139,439 | 1,296 | 11,227 | 4,933 |
| Singapore | 71,446 | 12,778 | 1,265 | 18,121 | −339 | 3,444 | 2,874 |
| Taiwan | 40,411 | 5,345 | 246 | 10,509 | 163 | 1,788 | 1,075 |
| Other | 32,845 | 10,731 | 865 | 18,981 | −52 | 5,150 | 2,948 |
| United States | 189,463 | 13,392 | (D) | 44,319 | 2,407 | 14,992 | 12,504 |
| Addenda: | |||||||
| European Union (28) 2 | 6,483,337 | 1,120,785 | 117,230 | 1,980,801 | 62,432 | 484,426 | 317,558 |
| OPEC 3 | 107,892 | 53,939 | 4,735 | 76,250 | 1,324 | 13,772 | 3,091 |
- D
- Suppressed to avoid disclosure of data on individual companies.
- The “United Kingdom Islands, Caribbean” consists of the British Virgin Islands, the Cayman Islands, Montserrat, and the Turks and Caicos Islands.
- The European Union (28) comprises Austria, Belgium, Bulgaria, Croatia, Cyprus, Czech Republic, Denmark, Estonia, Finland, France, Germany, Greece, Hungary, Ireland, Italy, Latvia, Lithuania, Luxembourg, Malta, the Netherlands, Poland, Portugal, Romania, Slovakia, Slovenia, Spain, Sweden, and the United Kingdom.
- OPEC is the Organization of Petroleum Exporting Countries. Its members are Algeria, Angola, Ecuador, Iran, Iraq, Kuwait, Libya, Nigeria, Qatar, Saudi Arabia, the United Arab Emirates, and Venezuela.
| Thousands of employees | Millions of dollars | |||
|---|---|---|---|---|
| U.S. exports of goods shipped by affiliates | U.S. imports of goods shipped to affiliates | Research and development performed by affiliates | ||
| (8) | (9) | (10) | (11) | |
| All countries | 7,088 | 369,770 | 649,911 | 60,140 |
| Canada | 679 | 14,479 | 18,305 | 1,037 |
| Europe | 4,495 | 191,789 | 286,527 | 43,775 |
| Belgium | 145 | 2,109 | 4,043 | 377 |
| Denmark | 39 | 1,326 | 10,416 | 442 |
| Finland | 23 | 1,327 | 3,118 | 126 |
| France | 729 | 26,079 | 31,656 | 5,638 |
| Germany | 692 | 40,099 | 87,871 | 7,769 |
| Ireland | 263 | 8,376 | 8,078 | 3,653 |
| Italy | 78 | 1,555 | 5,574 | 200 |
| Netherlands | 475 | 37,424 | 47,473 | 5,157 |
| Spain | 80 | 845 | 1,029 | 107 |
| Sweden | 212 | 7,320 | 9,877 | 700 |
| Switzerland | 471 | 16,992 | 12,869 | 10,565 |
| United Kingdom | 1,238 | 46,507 | 59,701 | 8,918 |
| Other | 50 | 1,831 | 4,821 | 122 |
| Latin America and Other Western Hemisphere | 358 | 42,572 | 33,830 | 1,647 |
| South and Central America | 180 | 9,366 | 12,003 | 81 |
| Brazil | 78 | 3,900 | 2,478 | 26 |
| Mexico | 79 | 1,085 | 3,322 | (D) |
| Venezuela | 6 | (D) | (D) | 0 |
| Other | 17 | (D) | (D) | (D) |
| Other Western Hemisphere | 178 | 33,206 | 21,828 | 1,566 |
| Bermuda | 57 | (D) | 3,887 | (D) |
| United Kingdom Islands, Caribbean 1 | 94 | 3,349 | (D) | 793 |
| Other | 28 | (D) | (D) | (D) |
| Africa | 8 | (D) | (D) | 11 |
| South Africa | 4 | (D) | (D) | (D) |
| Other | 3 | (D) | 3 | (D) |
| Middle East | 62 | 2,814 | 15,660 | 1,962 |
| Israel | 24 | 673 | 5,911 | (D) |
| Saudi Arabia | 7 | 1,744 | (D) | (D) |
| United Arab Emirates | 12 | (D) | (D) | (D) |
| Other | 20 | (D) | 143 | 10 |
| Asia and Pacific | 1,267 | 114,034 | 290,747 | 11,373 |
| Australia | 74 | 3,051 | 2,882 | 180 |
| China | 80 | 4,699 | 7,020 | 598 |
| Hong Kong | 32 | 832 | 10,345 | (D) |
| India | 67 | 1,359 | 2,910 | 193 |
| Japan | 861 | 86,647 | 189,794 | 8,049 |
| Korea, Republic of | 52 | 14,175 | 69,195 | 1,121 |
| Singapore | 43 | 1,265 | 1,142 | 406 |
| Taiwan | 14 | 967 | 4,226 | 115 |
| Other | 44 | 1,039 | 3,233 | (D) |
| United States | 219 | (D) | (D) | 335 |
| Addenda: | ||||
| European Union (28) 2 | 4,005 | 173,983 | 271,163 | 33,145 |
| OPEC 3 | 27 | 5,552 | 13,710 | 802 |
- D
- Suppressed to avoid disclosure of data on individual companies.
- The “United Kingdom Islands, Caribbean” consists of the British Virgin Islands, the Cayman Islands, Montserrat, and the Turks and Caicos Islands.
- The European Union (28) comprises Austria, Belgium, Bulgaria, Croatia, Cyprus, Czech Republic, Denmark, Estonia, Finland, France, Germany, Greece, Hungary, Ireland, Italy, Latvia, Lithuania, Luxembourg, Malta, the Netherlands, Poland, Portugal, Romania, Slovakia, Slovenia, Spain, Sweden, and the United Kingdom.
- OPEC is the Organization of Petroleum Exporting Countries. Its members are Algeria, Angola, Ecuador, Iran, Iraq, Kuwait, Libya, Nigeria, Qatar, Saudi Arabia, the United Arab Emirates, and Venezuela.
- The UBO is the entity proceeding up a U.S. affiliate’s ownership chain, beginning with the foreign parent, which is not owned more than 50 percent by another entity. The UBO is the entity that ultimately owns or controls and thus ultimately derives the benefits and assumes the risks from owning or controlling an affiliate.
- For an analysis of services supplied by majority-owned U.S. affiliates, see Shari A. Allen and Alexis N. Grimm, “U.S. International Services: Trade in Services in 2016 and Services Supplied Through Affiliates in 2015,” Survey of Current Business 97 (October 2017). For information on newly acquired or established affiliates, see Thomas Anderson, “New Foreign Direct Investment in the United States in 2016,” Survey 97 (August 2017).
- Value added can be measured as gross output (sales or receipts and other operating income plus inventory change) minus intermediate inputs (purchased goods and services). Alternatively, it can be measured as the sum of the costs incurred (except for intermediate inputs) and the profits earned in production. The estimates of value added for U.S. affiliates were prepared by summing cost and profit data. The estimates are measures of gross value added rather than measures of net value added because they are calculated without deducting the consumption of fixed capital used in production.
- Each U.S. affiliate is classified in the industry that accounts for the largest portion of its sales. However, many large affiliates are involved in a variety of business activities. For example, the wholesale trade industry includes many affiliates that have substantial activities in manufacturing.
- These price changes are based on chain-type price indexes for value added by industry from BEA.
- The affiliate shares of U.S. exports and imports of goods are computed using data from the U.S. Census Bureau and are on a Census Bureau basis, which is the basis used in BEA AMNE surveys.
- The foreign parent group of a U.S. affiliate consists of (1) the foreign parent; (2) any foreign person (including a company), proceeding up the foreign parent’s ownership chain, which owns more than 50 percent of the person below it, up to and including the UBO; and (3) any foreign person, proceeding down the ownership chain(s) of each of these members, which is owned more than 50 percent by the person above it.
- Data on R&D performed by all U.S. businesses is from the National Science Foundation Business R&D and Innovation Survey (BRDIS).
- For additional information on R&D expenditures by U.S. affiliates of foreign MNEs, see William J. Zeile, “State-Level R&D by Multinational Companies: Results From an Interagency Data Link Project,” Survey 93 (September 2013) and Francisco Moris and William J. Zeile, “Innovation-Related Services Trade by Multinational Enterprises: Results From an Interagency Data Link Project,” Survey 96 (May 2016).