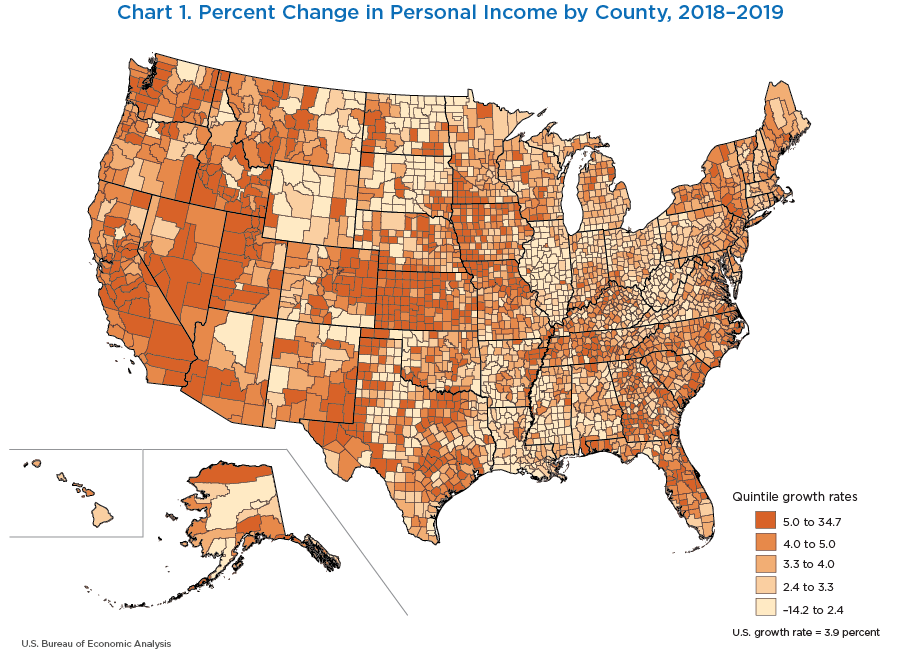
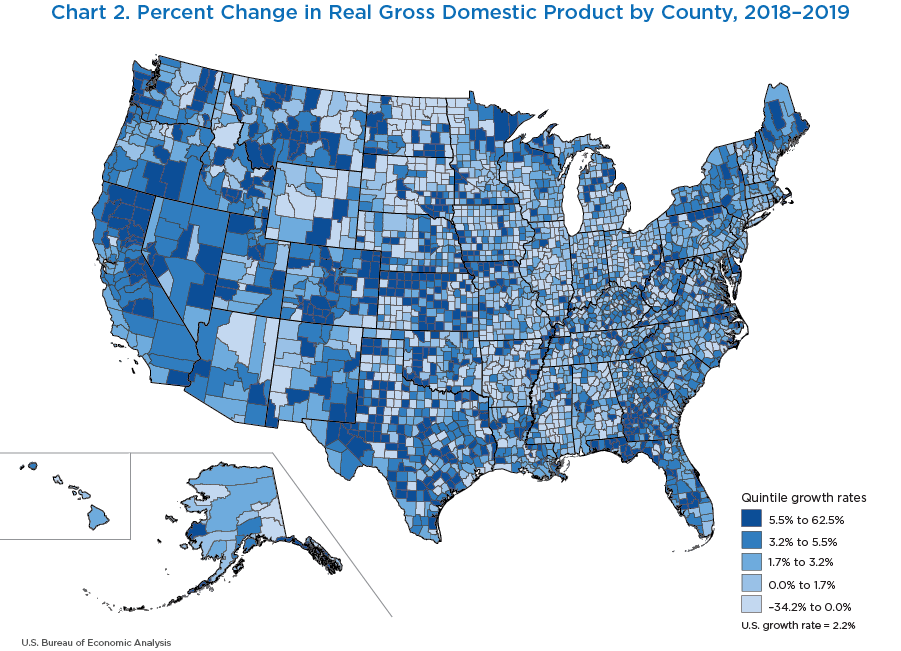
The statistics discussed in this Regional Quarterly Report include the following: (1) personal income statistics by county for 2019 and updated statistics for 2013–2018 and (2) gross domestic product (GDP) statistics by county for 2019 and updated statistics for 2001–2018.
On November 17, 2020, the Bureau of Economic Analysis (BEA) released personal income statistics by county for 2019 and updated personal income statistics for 2013–2018. Subsequently, on December 9, 2020, BEA released gross domestic product (GDP) statistics by county for 2019 and updated GDP statistics for 2001–2018. The annual county estimates incorporate the results of the July 2020 annual revision to the National Income and Production Accounts (NIPAs), the September 2020 annual update to the personal income by state estimates, and the October 2020 annual update to the GDP by state estimates.
Personal income by county measures the income received by, or on behalf of, all persons from all sources within a localized jurisdiction.1 Sources of income include participation as laborers in production and income from owning a home or business, ownership of financial assets, and transfers from government and business, whether such source of income is foreign or domestic. Not included in personal income are realized or unrealized capital gains or loses. GDP by county measures the value of goods and services produced within a county.2 Conceptually, GDP is by place of work, whereas personal income is by place of residence. The key difference between personal income and GDP is that personal dividend and interest income and personal current transfer receipts are only included in personal income, while corporate income and taxes on production and imports less subsidies are only included in GDP.
Personal income nationally grew 3.9 percent in 2019, down from 5.3 percent in 2018. The levels of total personal income by county ranged from $9.1 million in Loving County, TX, to $653.5 billion in Los Angeles County, CA. Personal income in 2019 increased in 2,964 counties, decreased in 139 counties, and remained unchanged in 10 counties. Personal income growth ranged from 34.7 percent in Sheridan County, KS, to −14.2 percent in Cavalier County, ND. Chart 1 illustrates the percent change in personal income by county for 2019.
Real GDP—the sum of current-dollar GDP for all counties deflated by national price measures—grew 2.2 percent in 2019, down from 3.0 percent in 2018. Real GDP by county across the United States ranged from $22.9 million in Petroleum County, MT, to $726.9 billion in Los Angeles County, CA. Real GDP increased in 2,484 counties, decreased in 612 counties, and was unchanged in 17 counties in 2019. The percent change in real GDP ranged from 62.5 percent in Greensville and Emporia, VA, to −34.2 percent in Jackson County, WV. Chart 2 illustrates the percent change in real GDP by county for 2019.
Population sizes by county vary greatly across the United States. BEA categorizes counties into small, medium, and large groupings based on total population as follows:
- Small counties are those with a total population of less than 100,000 persons.
- Medium counties are those with a total population between 100,000 and 500,000 persons.
- Large counties are those with a total population greater than 500,000 persons.
Personal income growth by county population size
Personal income increased in all 141 large counties in 2019. Personal income for large counties ranged from $23.3 billion in Pasco County, FL, to $653.5 billion in Los Angeles County, CA. Personal income grew fastest at 9.1 percent in Williamson County, TX, driven by wage and salary growth in durable-goods manufacturing. Baltimore (independent city), MD, grew the slowest at 2.0 percent. Growth slowed due to wage and salary declines in transportation and warehousing (table 1).
For medium-size counties, personal income increased in 464 counties and decreased in 1 county in 2019. Personal income for medium counties ranged from $3.7 billion in Highlands County, FL, to $50.0 billion in Morris County, NJ. Personal income grew fastest at 9.1 percent in Kaufman County, TX, driven by wage and salary growth in transportation and warehousing, and declined 0.8 percent in Bay County, FL, due to a decline in personal current transfer receipts.
There were 2,507 counties with small populations in 2019. Personal income in small counties increased in 2,359 counties, decreased in 138 counties, and remained unchanged in 10 counties in 2019. Personal income for small counties ranged from $9.1 million in Loving County, TX, to $7.6 billion in Ozaukee County, WI. Personal income grew fastest at 34.7 percent in Sheridan County, KS, driven by growth in farm proprietors' income. This county also had the fastest-growing personal income in the United States. Cavalier County, ND, had the largest percent decline in personal income in the United States. Personal income fell in the county by 14.2 percent due to a decline in farm proprietors' income.
| Counties | Population | Personal income (thousands of current dollars) |
Percent change in personal income |
|---|---|---|---|
| Large county personal income (population greater than 500,000) |
|||
| Fastest growing | |||
| Williamson, TX | 590,551 | 31,384,616 | 9.1 |
| San Joaquin, CA | 762,148 | 35,926,949 | 6.8 |
| Denton, TX | 887,207 | 52,712,796 | 6.8 |
| Slowest growing | |||
| Baltimore (independent city), MD | 539,490 | 31,679,263 | 2.0 |
| Milwaukee, WI | 945,726 | 46,433,612 | 2.3 |
| Hartford, CT | 891,720 | 58,603,659 | 2.4 |
| Medium county personal income (population between 100,000 and 500,000) |
|||
| Fastest growing | |||
| Kaufman, TX | 136,154 | 5,987,018 | 9.1 |
| Hays, TX | 230,191 | 10,435,043 | 8.0 |
| Kings, CA | 152,940 | 6,030,809 | 7.8 |
| Slowest growing | |||
| Bay, FL | 174,705 | 7,982,208 | −0.8 |
| McLean, IL | 171,517 | 8,507,653 | 0.2 |
| Macon, IL | 104,009 | 5,071,870 | 0.7 |
| Small county personal income (population less than 100,000) |
|||
| Fastest growing | |||
| Sheridan, KS | 2,521 | 156,696 | 34.7 |
| Greeley, KS | 1,232 | 121,865 | 30.4 |
| Cheyenne, CO | 1,831 | 101,050 | 26.0 |
| Slowest growing | |||
| Cavalier, ND | 3,762 | 245,651 | −14.2 |
| Buffalo, SD | 1,962 | 40,578 | −13.8 |
| Towner, ND | 2,189 | 136,879 | −12.6 |
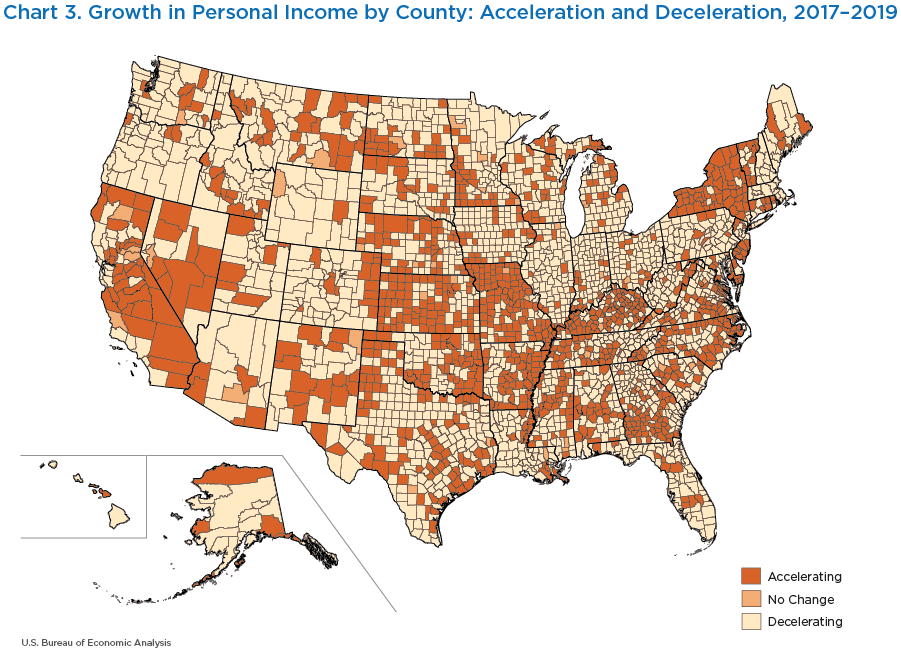
In 2019, personal income growth accelerated in 1,156 counties, decelerated in 1,905 counties, and remained unchanged in 52 counties, compared to 2018 (chart 3). Of the 2,839 counties that had positive personal income growth in both 2018 and 2019, 1,024 of these counties grew faster in 2019. The population of these 1,024 faster growing counties account for 19.8 percent of the total U.S. population. Of the 11 counties that had personal income decline in both 2018 and 2019, 6 of these counties had personal income decline at an accelerating rate in 2019. The population of these six counties accounts for less than 0.01 percent of the U.S. population.
Real GDP growth by county population size
Of the 141 large-size counties, real GDP grew in 132 counties and declined in 9 counties in 2019. Real GDP ranged from $11.6 billion in Pasco County, FL, to $726.9 billion in Los Angeles County, CA. Williamson County, TX, was the fastest growing large county with real GDP growth at 6.0 percent (table 2). The durable-goods manufacturing industry was the leading contributor to the county's growth. Hudson County, NJ, had the largest percent decline in real GDP at 2.6 percent among large counties. The real estate and rental and leasing industry was the leading contributor to the decline in Hudson County, NJ.
For medium-size counties, real GDP increased in 405 counties, decreased in 58 counties, and was unchanged in 2 counties in 2019. Real GDP ranged from $2.1 billion in Saline County, AR, to $49.3 billion in Morris County, NJ. Spurred by growth in the mining, quarrying, and oil and gas extraction industry, Midland County, TX, was the fastest growing medium county at 13.9 percent. Canadian County, OK, experienced the largest percent decline in real GDP at 4.9 percent. The mining, quarrying, and oil and gas extraction industry was the leading contributor to the decline in Canadian County, OK.
For small-size counties, real GDP increased in 1,947 counties, decreased in 545 counties, and was unchanged in 15 counties in 2019. Real GDP ranged from $22.9 million in Petroleum County, MT, to $16.1 billion in Reeves County, TX. Greensville and Emporia County, VA, was the fastest growing small county at 62.5 percent. The utilities industry was the leading contributor to the county's real GDP growth. The county also had the fastest growing real GDP in the United States. Jackson County, WV, had the largest percent decline in real GDP at 34.2 percent. The construction industry was the leading contributor to the decline in Jackson County. Jackson County, WV, had the largest percent decline in real GDP for any county in the United States.
| Counties | Population | Real GDP (thousands of chained (2012) dollars) |
Percent change in real GDP |
|---|---|---|---|
| Large county real GDP (population greater than 500,000) |
|||
| Fastest growing | |||
| Williamson, TX | 590,551 | 20,884,833 | 6.0 |
| Utah, UT | 636,235 | 25,899,184 | 5.9 |
| King, WA | 2,252,782 | 294,329,768 | 5.8 |
| Slowest growing | |||
| Hudson, NJ | 672,391 | 43,847,173 | −2.6 |
| Kings, NY | 2,559,903 | 93,907,140 | −0.8 |
| Queens, NY | 2,253,858 | 95,547,729 | −0.8 |
| Medium county real GDP (population between 100,000 and 500,000) |
|||
| Fastest growing | |||
| Midland, TX | 176,832 | 29,800,548 | 13.9 |
| Citrus, FL | 149,657 | 3,879,314 | 12.2 |
| Barnstable, MA | 212,990 | 13,587,539 | 7.9 |
| Slowest growing | |||
| Canadian, OK | 148,306 | 3,978,646 | −4.9 |
| Tazewell, IL | 131,803 | 5,549,702 | −4.6 |
| Coconino, AZ | 143,476 | 6,764,676 | −3.5 |
| Small county real GDP (population less than 100,000) |
|||
| Fastest growing | |||
| Greensville + Emporia, VA | 16,682 | 1,246,958 | 62.5 |
| Billings, ND | 928 | 209,871 | 61.6 |
| Holt, MO | 4,403 | 260,778 | 51.5 |
| Slowest growing | |||
| Jackson, WV | 28,576 | 947,980 | −34.2 |
| Nash, NC | 94,298 | 4,973,995 | −23.9 |
| Benton, MS | 8,259 | 230,407 | −23.8 |
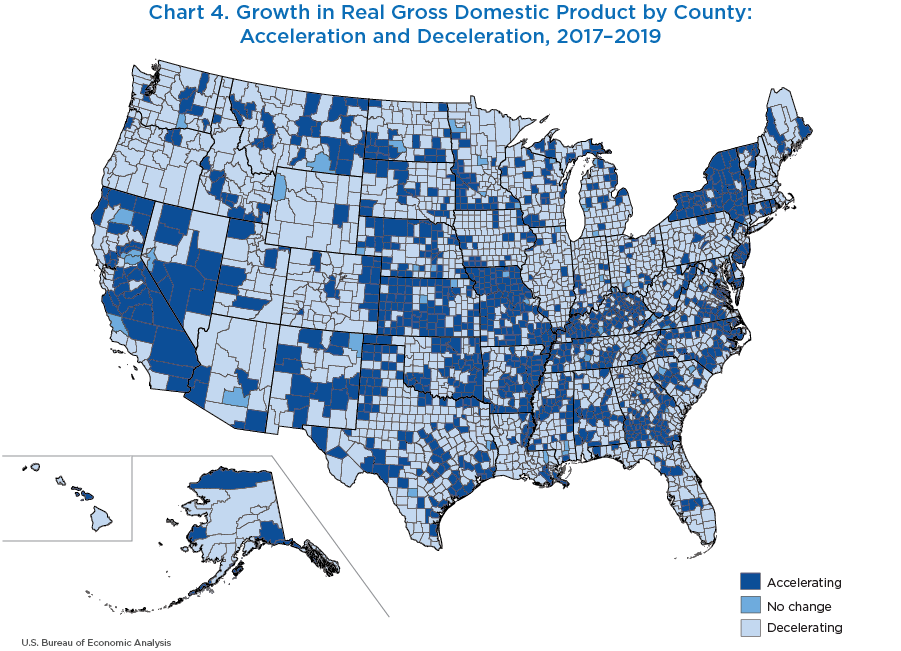
In 2019, real GDP growth accelerated in 1,645 counties, decelerated in 1,440 counties, and remained unchanged in 28 counties, compared to 2018 (chart 4). Of the 1,843 counties that had positive real GDP growth in both 2018 and 2019, 909 of these counties grew faster in 2019. Of the 158 counties that had real GDP decline in both 2018 and 2019, 64 of these counties had real GDP decline at an accelerating rate in 2019.
Employment by county population size
BEA also released employment figures along with personal income by county on November 17, 2020. BEA estimates of employment by county consist of the number of wage and salary jobs, sole proprietorships, and general partnerships. Estimates of employment by county are a complement to the place-of-work earnings estimates released as part of the personal income by county estimates.
Employment by county increased in 2,336 counties, decreased in 710 counties, and remained unchanged in 67 counties in 2019. Employment growth by county ranged from 98.5 percent in Loving County, TX to −25.5 percent in Johnston County, OK.
Employment increased in 140 large counties and decreased in 1 large county in 2019. Levels of employment ranged from 195,427 in Pasco County, FL to 6.7 million in Los Angeles County, CA. Employment growth in large counties ranged from 5.2 percent in Adams County, CO, to −0.3 percent in Honolulu County, HI (table 3).
In medium size counties, employment increased in 413 counties, decreased in 42 counties, and remained the same in 10 counties in 2019. Levels of employment ranged from 40,405 in Saline County, FL to 416,84 in Morris County, NJ. Employment growth in medium counties ranged from 6.4 percent in Henry County, GA, to −3.6 percent in Bay County, FL.
For small size counties, employment increased in 1,783 counties, decreased in 667 counties, and remained the same in 57 counties in 2019. Levels of employment in small size counties ranged from 252 in King County, TX to 81,719 in Roanoke (independent city), VA. Employment growth in small counties ranged from 98.5 percent in Loving County, TX, to −25.5 percent in Johnston County, OK.
| Counties | Population | Employment | Percent change in employment |
|---|---|---|---|
| Large county employment (population greater than 500,000) |
|||
| Fastest growing | |||
| Adams, CO | 517,421 | 302,140 | 5.2 |
| Williamson, TX | 590,551 | 290,973 | 4.4 |
| Denton, TX | 887,207 | 433,036 | 4.1 |
| Slowest growing | |||
| Honolulu, HI | 974,563 | 659,310 | −0.3 |
| Fairfield, CT | 943,332 | 614,726 | 0.2 |
| Milwaukee, WI | 945,726 | 666,826 | 0.5 |
| Medium county employment (population between 100,000 and 500,000) |
|||
| Fastest growing | |||
| Henry, GA | 234,561 | 108,451 | 6.4 |
| Beaver, PA | 163,929 | 77,666 | 5.4 |
| Licking, OH | 176,862 | 89,268 | 5.1 |
| Slowest growing | |||
| Bay, FL | 174,705 | 105,766 | −3.6 |
| Elkhart, IN | 206,341 | 162,215 | −2.4 |
| Trumbull, OH | 197,974 | 90,769 | −2.3 |
| Small county employment (population less than 100,000) |
|||
| Fastest growing | |||
| Loving, TX | 169 | 268 | 98.5 |
| Converse, WY | 13,822 | 10,589 | 18.1 |
| Reeves, TX | 15,976 | 10,897 | 17.3 |
| Slowest growing | |||
| Johnston, OK | 11,085 | 4,743 | −25.5 |
| Cameron, LA | 6,973 | 10,565 | −23.5 |
| Jackson, WV | 28,576 | 12,871 | −22.0 |
Personal income by county
In September 2020, BEA revised its preliminary annual personal income by state estimates that were released in March to incorporate updates from the annual revision of the NIPAs in July and to incorporate new and revised source data that are more complete and more detailed than previously available. In November, BEA incorporated both the July updates to the NIPAs and the September updates to personal income by state to revise the personal income by county statistics and to publish the 2019 personal income by county estimates. Moreover, the November publication was an opportunity to incorporate new and revised county-level source data. There were no changes made to the personal income by county methodology this year.
Revised source data for personal income by county include 2015–2018 data from the Quarterly Census of Employment and Wages (QCEW), published by the U.S. Bureau of Labor Statistics; Social Security and Supplemental Security Income data from the Social Security Administration; and veterans benefits data from the U.S. Department of Veterans Affairs (table 4). These same sources additionally had new data for 2019. Personal income by county estimates also utilized new data from the U.S. Department of Agriculture 2017 Census of Agriculture and 2018 Statistics of Income data from the Internal Revenue Service.
| Data | Source | Years updated |
|---|---|---|
| Quarterly Census of Employment and Wages | U.S. Bureau of Labor Statistics | 2015–2018, 20191 |
| Census of Agriculture | National Agricultural Statistics Service, U.S. Department of Agriculture | New data for 2017 |
| Statistics of Income | Internal Revenue Service | New data for 2018 |
| Social Security and Supplemental Security Income enrollees and benefits data | Social Security Administration | 2015–2018, 20191 |
| Medicare Advantage fee-for-services expenditure data; enrollment data for Medicare hospital insurance, Supplement Health Insurance, and Medicare Parts B and D | Centers for Medicare and Medicaid Services | 20191 |
| Veterans pension, disability, life insurance, and readjustment benefits data; number of pension and disability beneficiaries | U.S. Department of Veterans Affairs | 2015–2018, 20191 |
- Newly available data.
GDP by county
In October 2020, BEA revised its annual GDP by state estimates from 1997 to 2019 to incorporate the annual revision of the NIPAs in July, the annual revision of the GDP by industry statistics in September, the personal income by state statistics in September, and to incorporate new and revised source data that are more complete and more detailed than previously available.3 In December, BEA incorporated the update made to the GDP by state statistics to revise its GDP by county statistics and to publish the 2019 GDP by county estimates. The December release of GDP by county estimates was also an opportunity for BEA to incorporate new and revised county-level source data as well as methodological changes. Along with new 2019 estimates, the entire GDP by county time series from 2001 to 2018 was updated.
The GDP by county statistics rely heavily on the Economic Census.4 The Census Bureau conducts the Economic Census every 5 years, and it is used in most industries to estimate the other income payments and costs portion of GDP by county. With the release of the 2017 Economic Census data, BEA incorporated the newly available Economic Census data in the December 2020 publication. BEA made two methodological changes with the incorporation of the 2017 Economic Census.
First, where Economic Census data are suppressed or unavailable, the data are filled using a combination of the BLS QCEW wage data and National Establishment Time Series (NETS) sales data. In previous estimations, BEA used the average of QCEW wages and NETS sales to fill the missing data. Due to the relative magnitudes of the series respective to each other, NETS sales often outweighed the QCEW wage data. With the incorporation of the 2017 Economic Census, BEA improved its imputation of suppressed data in the Economic Census by now equally weighting the QCEW and NETS data by state shares of industry. This normalizes each series and ensures both data series are equally represented when filling suppressed values in the Economic Census data.
Additionally, due to the lack of availability of the value-added county-level data for the manufacturing sector in the 2017 Economic Census, a change was made to the methodology used to estimate value added by county for the manufacturing sector. Normally BEA would use Census value added directly to estimate value added by county for manufacturing industries. Manufacturing value added is derived by subtracting the cost of materials, supplies, containers, fuel, purchased electricity, and contract work from the value of shipments (products manufactured plus receipts for services rendered). The result of this calculation is adjusted by the addition of value added by merchandising operations (that is, the difference between the sales value and the cost of merchandise sold without further manufacture, processing, or assembly) plus the net change in finished goods and work-in-process between the beginning- and end-of-year inventories. Without value added included in the 2017 Economic Census, BEA constructed a proxy for value added for manufacturing industries using the value of shipments (products manufactured plus receipts for services rendered) minus the cost of materials, supplies, containers, fuel, purchased electricity, and contract work. Successful testing on the accuracy of the proxy for value added was done using the 2012 Economic Census, which did have value added available. Subsequently, BEA incorporated the 2017 Economic Census information by modifying its methodology by using a proxy value for value added for the manufacturing sector.
Aside from GDP by state and the Economic Census data, most of the source data used to estimate GDP by county were also updated. Moreover, newly available data were incorporated for 2019. These data include QCEW data, which was updated from 2015–2018 with new data for 2019; Census of Agriculture data available for 2017; updated net electricity generation data from the Energy Information Administration; and many other data sources. Table 5 lists the updated data sources used to estimate GDP by county and the years updated.
| Data | Source | Years updated |
|---|---|---|
| Quarterly Census of Employment and Wages | U.S. Bureau of Labor Statistics | 2015–2018, 20191 |
| Census of Agriculture | National Agricultural Statistics Service, U.S. Department of Agriculture | New data for 2017 |
| Economic Census | Census Bureau | New data for 2017 |
| Local area personal income | Bureau of Economic Analysis | 2013–2018, 20191 |
| National Establishment Time Series | Dun & Bradstreet | 2001–2017 |
| Net electricity generation data | Energy Information Administration | 2015–2018, 20191 |
| Coal production | Energy Information Administration | 2016–2018, 20191 |
| Value of Construction Put in Place | Dodge Data & Analytics | 2016–2018, 20191 |
| Oil and gas production | DrillingEdge | 2001–2018, 20191 |
| U.S. Airline Financial Data (Schedule P-1.2) | Bureau of Transportation Statistics | 2018, 20191 |
| U.S Air Carrier Traffic Statistics (T-100 Domestic and International Segments) | Bureau of Transportation Statistics | 2018, 20191 |
| Carload Waybill Sample | Surface Transportation Board | 2011,2015–2018 |
| Summary of Bank Deposits | Federal Deposit Insurance Corporation | 2001–2018, 20191 |
| International banking facilities deposits | Federal Reserve Bank of Chicago | 2001–2018, 20191 |
| American Housing Survey | Census Bureau | 2018 |
- Newly available data.
BEA has revised the personal income by county statistics from 2013 to 2018 and the GDP by county statistics from 2001 to 2018. These revisions were made to incorporate updates made to the source data and the state controls used to estimate the county statistics. The updates to the personal income statistics, measured as a percentage of the previously published statistics, were modest for most counties. Compared to personal income revisions, counties experienced a higher mean absolute revision (MAR) in real GDP (table 6). This can be explained by the incorporation of the larger number of revised source data used to estimate real GDP.
| Mean absolute revision | Number of counties | |
|---|---|---|
| Revisions to personal income by county (2013–2018) |
Revisions to real gross domestic product by county (2001–2018) |
|
| 0.0–4.9% | 2,898 | 2,493 |
| 5.0–9.9% | 142 | 446 |
| 10.0% or greater | 73 | 174 |
The MAR to personal income across all periods open to revision from 2013 to 2018 was 1.7 percent. MAR was less than 5.0 percent in 2,898 counties, between 5.0 and 9.9 percent in 142 counties, and equal to or greater than 10.0 percent in 73 counties.
The MAR to real GDP across all periods open to revision from 2001 to 2018 was 3.5 percent. MAR was less than 5.0 percent in 2,493 counties, between 5.0 and 9.9 percent in 446 counties, and equal to or greater than 10.0 percent in 174 counties.


