
![]()
A Primer on BEA's Foreign Direct Investment Products
The Bureau of Economic Analysis (BEA) publishes three sets of statistics on foreign direct investment in and by the United States that are derived from information collected in surveys conducted by BEA. They are as follows:
- Statistics on new foreign direct investment, which capture data on expenditures by foreign investors to acquire, establish, or expand a U.S. business. These include "greenfield" projects, where foreign investors establish a new business or expand an existing business on U.S. soil.
- Statistics on direct investment, which include transactions between U.S. affiliates and their foreign parents and between U.S. parents and their foreign affiliates, the income that the investors earn on their direct investments, and the cumulative value—or position—of direct investments.
- Statistics on the activities of multinational enterprises, which show a variety of indicators about the financial structure and operations of multinational enterprises that have a U.S. presence. These include U.S. parent companies with affiliates abroad and U.S. affiliates of foreign parent companies.
Published by BEA's International Directorate, these statistics help us measure how the operations of multinational enterprises affect the economic performance of the United States and the global economy. The data are used by various government agencies, businesses, research institutions, and policymakers to answer questions such as how much and who is investing, what industries are most affected, which countries or U.S. states receive the most investment, and how these investments are financed.
In 2019, for example, expenditures for new foreign direct investment in the United States were largest in chemical manufacturing, followed by transportation and warehousing and by publishing industries. By country of ultimate beneficial owner, the largest investors were from the United Kingdom, Canada, Germany, and Japan. By U.S. state, California received the largest investment, followed by Pennsylvania and Texas. Minnesota had the largest employment, followed by Texas and California. Employment for an acquired entity that operated in multiple states is attributed to the state in which it had the greatest number of employees.
On the outward side, in 2018, growth in employment by majority-owned foreign affiliates was largest in services, including courier and messenger services and financial services. By country, growth was largest in the Philippines, Italy, and Germany.
BEA's direct investment surveys are mandatory and confidential.
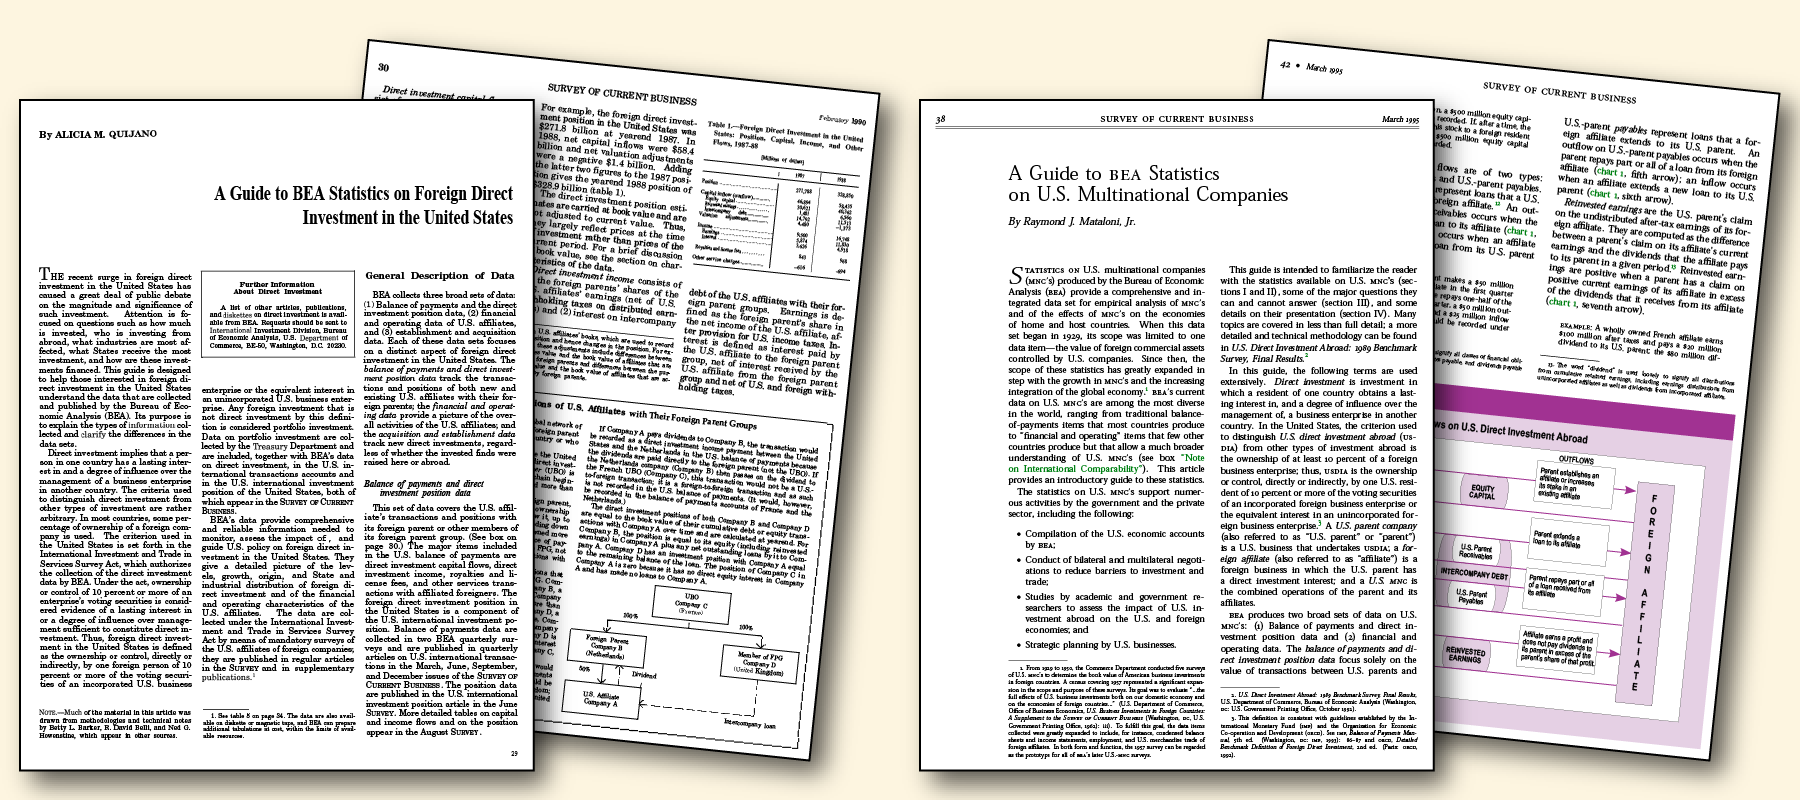
Pages from “A Guide to BEA Statistics on Foreign Direct Investment in the United States” (left) and
“A Guide to BEA Statistics on U.S. Multinational Companies” (right).
As part of the Survey of Current Business centennial, we are pleased to reprint the following two articles that provide an overview of the foreign direct investment surveys and how they are treated: “A Guide to BEA Statistics on Foreign Direct Investment in the United States” and “A Guide to BEA Statistics on U.S. Multinational Companies.”