
A Primer on the U.S. International Economic Accounts
This article presents an introduction to the structure and components of the U.S. International Economic Accounts. The last article of this kind was published in 2010. Since then, many updates have been introduced in the accounts, including those associated with a comprehensive restructuring, which was introduced in 2014.1 This month, the Bureau of Economic Analysis (BEA) is publishing an updated and expanded edition of the comprehensive methodology U.S. International Economic Accounts: Concepts and Methods, which describes in detail the concepts underlying, and the data sources and estimation methods used to compile, BEA's International Economic Accounts.
BEA's International Economic Accounts are composed of three core accounts: the International Transactions Accounts (ITAs), the International Investment Position (IIP) Accounts, and the statistics on the activities of multinational enterprises (AMNE).
- The ITAs are a statistical summary of transactions between U.S. residents and the rest of the world.
- The IIP Accounts include a statistical summary of the stocks of U.S. financial assets and liabilities vis-à-vis the rest of the world.
- The AMNE statistics present key measures on the finances and operations of multinational enterprises (MNEs), including both U.S. MNEs and U.S. affiliates of foreign MNEs.
In addition to the core accounts, BEA compiles and publishes several related statistics: monthly trade in goods and services, international services, direct investment by country and industry, and new foreign direct investment in the United States. There is some overlap between the statistics included in the core accounts and in the related statistics.
BEA's International Economic Accounts are compiled in accordance with international statistical guidelines, which form a common framework for economic measurement and facilitate international comparisons between countries. The primary guidance for the U.S. International Economic Accounts is the Balance of Payments and International Investment Position Manual, Sixth Edition (BPM6) published by the International Monetary Fund (IMF) in 2009. BPM6 closely followed the release of other updated statistical guidelines including the 2008 update to the System of National Accounts (SNA 2008) and the 2008 release of the fourth edition of the Benchmark Definition of Foreign Direct Investment (BD4) by the Organisation for Economic Co-operation and Development (OECD).
BEA's International Economic Accounts have evolved over time in response to policy needs as well as growth in international trade, changing financial markets and innovations, and increasingly complex organization of global production. This article will present a summary of the U.S. International Economic Accounts as they are currently compiled and presented.
Statistics for the three core accounts—the ITAs, IIP Accounts, and AMNE statistics—are available via interactive tables on the BEA website, via preformatted tables, and via BEA's application programming interface.
The first section of this article presents the ITAs, the second section presents the IIP Accounts, the third section presents the AMNE statistics, and the last section presents relationships to other accounts. Boxes present key terms and general background, which are broadly applicable to the various sections.
Overview and structure
The ITAs consist of quarterly and annual statistics for three component accounts: the current account, the capital account, and the financial account. The current account includes statistics on exports and imports of goods and services as well as receipts and payments of primary and secondary income. The capital account includes capital transfers between U.S. residents and nonresidents and transactions in nonproduced nonfinancial assets. The financial account consists of investment transactions—including direct investment, portfolio investment, other investment, reserve assets, and financial derivatives—between U.S. residents and nonresidents.
In concept, the ITAs are recorded according to the double-entry principle, which entails the recording of two equal and offsetting entries—a credit and a debit—for each transaction. Credit and debit entries for the current, capital, and financial accounts are identified in the sections that follow and in the box “Recording of Transactions in the ITAs.”
The ITAs also present balances for various component accounts. A balance is the difference between credits and debits for a component of the ITAs. One of the featured balances, the balance on the current account, is a Principal Federal Economic Indicator.2 The balance on goods and services, or “trade balance,” is included in the quarterly and annual ITAs as well as a monthly release; the monthly trade balance is also a Principal Federal Economic Indicator.
The ITAs are sometimes referred to as “balance-of-payments” statistics. Table 1 reproduces ITA table 1.1 for 2018–2020 and illustrates the basic structure of the ITAs.
| Line | Item description | 2018 | 2019 | 2020 |
|---|---|---|---|---|
| Current account | ||||
| 1 | Exports of goods and services and income receipts (credits) | 3,793.6 | 3,812.5 | 3,258.6 |
| 2 | Exports of goods and services | 2,538.6 | 2,528.4 | 2,134.4 |
| 3 | Goods | 1,676.9 | 1,652.1 | 1,428.8 |
| 4 | Services | 861.7 | 876.3 | 705.6 |
| 5 | Primary income receipts | 1,106.4 | 1,124.9 | 957.9 |
| 6 | Investment income | 1,099.5 | 1,117.8 | 951.4 |
| 7 | Compensation of employees | 6.9 | 7.2 | 6.5 |
| 8 | Secondary income (current transfer) receipts | 148.6 | 159.2 | 166.3 |
| 9 | Imports of goods and services and income payments (debits) | 4,231.9 | 4,284.6 | 3,874.7 |
| 10 | Imports of goods and services | 3,119.6 | 3,104.7 | 2,811.1 |
| 11 | Goods | 2,555.7 | 2,513.6 | 2,350.8 |
| 12 | Services | 563.9 | 591.1 | 460.3 |
| 13 | Primary income payments | 847.3 | 893.0 | 769.4 |
| 14 | Investment income | 830.1 | 874.1 | 755.0 |
| 15 | Compensation of employees | 17.2 | 18.9 | 14.4 |
| 16 | Secondary income (current transfer) payments | 265.0 | 286.9 | 294.2 |
| Capital account | ||||
| 17 | Capital transfer receipts and other credits | 3.3 | (*) | 0.4 |
| 18 | Capital transfer payments and other debits | 7.5 | 6.5 | 5.9 |
| Financial account | ||||
| 19 | Net U.S. acquisition of financial assets excluding financial derivatives (net increase in assets/financial outflow (+)) | 383.8 | 317.0 | 809.3 |
| 20 | Direct investment assets | −130.0 | 122.2 | 311.7 |
| 21 | Portfolio investment assets | 335.3 | −13.5 | 220.0 |
| 22 | Other investment assets | 173.6 | 203.6 | 268.6 |
| 23 | Reserve assets | 5.0 | 4.7 | 9.0 |
| 24 | Net U.S. incurrence of liabilities excluding financial derivatives (net increase in liabilities/financial inflow (+)) | 711.8 | 755.7 | 1,456.5 |
| 25 | Direct investment liabilities | 214.3 | 302.2 | 211.3 |
| 26 | Portfolio investment liabilities | 303.1 | 177.2 | 710.2 |
| 27 | Other investment liabilities | 194.4 | 276.4 | 535.1 |
| 28 | Financial derivatives other than reserves, net transactions | −20.4 | −41.7 | −5.8 |
| Statistical discrepancy | ||||
| 29 | Statistical discrepancy | 94.1 | −1.8 | −31.4 |
| Balances | ||||
| 30 | Balance on current account (line 1 less line 9) | −438.2 | −472.1 | −616.1 |
| 31 | Balance on goods and services (line 2 less line 10) | −581.0 | −576.3 | −676.7 |
| 32 | Balance on goods (line 3 less line 11) | −878.7 | −861.5 | −922.0 |
| 33 | Balance on services (line 4 less line 12) | 297.8 | 285.2 | 245.3 |
| 34 | Balance on primary income (line 5 less line 13) | 259.1 | 231.9 | 188.5 |
| 35 | Balance on secondary income (line 8 less line 16) | −116.4 | −127.7 | −127.9 |
| 36 | Balance on capital account (line 17 less line 18) | −4.3 | −6.4 | −5.5 |
| 37 | Net lending (+) or net borrowing (−) from current- and capital-account transactions (line 30 plus line 36) | −442.5 | −478.6 | −621.6 |
| 38 | Net lending (+) or net borrowing (−) from financial-account transactions (line 19 less line 24 plus line 28) | −348.4 | −480.4 | −653.0 |
- (*)
- Transactions between zero and +/- $50 million.
The ITAs are composed of several tables, which are organized into three main groups.
Overall ITA tables- Table 1.1 presents a summary of the current, capital, and financial accounts, as well as the statistical discrepancy and balances; it contains limited detail.
- Table 1.2 presents the same components as table 1.1 with expanded detail.
- Table 1.3 presents the expanded detail of table 1.2 by selected country and area.
- Table 1.4 presents the same statistics as table 1.3 but from the perspective of country and area detail by account.
- Table 1.5 (annual only) presents details for trade in goods and services by country and area.
- Tables 2.1–2.4 present details for trade in goods.
- Tables 3.1–3.3 present details for trade in services.
- Tables 4.1–4.4 present details for transactions in primary income.
- Table 5.1 presents detail for transactions in secondary income
- Table 6.1 presents detail for financial transactions in direct investment.
- Table 7.1 presents detail for financial transactions in portfolio investment.
- Table 8.1 presents detail for financial transactions in other investment.
- Table 9.1 presents detail for financial transactions for liabilities to foreign official agencies.
Current account
The current account relates to current economic activity including production, consumption, and income. Specifically, the current account presents statistics on transactions in goods, services, primary income, and secondary income between U.S. residents and nonresidents. (For definitions of key terms, see the box “Key Concepts: Economic Territory, Residence, and Institutional Units.”) The first two components of the current account together compose trade in goods and services. The third component, primary income, includes income received and paid by individuals or enterprises. The last component, secondary income, consists of transfers between U.S. residents and nonresidents without a quid pro quo. Each of the major components are discussed below.
In the current account of the ITAs, exports of goods and services as well as primary and secondary income receipts are recorded as credits. Imports of goods and services as well as primary and secondary income payments are recorded as debits.
Goods
Goods are physical items with ownership rights that can be exchanged among residents and nonresidents through transactions. Production of a good can be separated from its subsequent sale or resale. In the U.S. current account, goods exports (or imports) include all goods sold, exchanged, donated, or otherwise transferred from a U.S. owner to a nonresident owner (and, for imports, vice versa). Goods transactions in the ITAs do not distinguish between how goods will be used (that is, among personal consumption, intermediate consumption, inventories, or gross fixed capital formation), nor the period in which a good was produced.
The delineation between goods and services is not always well-defined and distinguishing between the two may be not be possible in some circumstances. For example, the valuation of goods in the ITAs includes transport services within the exporting economy as well as wholesale and retail services embedded in the price of the goods. In addition, expanded use of global production networks and complex intracompany transactions have given rise to new measurement challenges, especially in the areas of goods for processing (goods that cross borders, without a change in ownership, to be processed) and goods under merchanting (goods that are bought and resold without entering the country of the buyer/reseller).
Transactions in goods are presented for three main components: general merchandise, net exports of goods under merchanting, and nonmonetary gold.3 Detailed statistics for international trade in goods are presented in ITA tables 2.1–2.4.
General merchandise
General merchandise is, by far, the largest component of goods trade and covers goods exchanged between a U.S. resident and a nonresident, excluding goods under merchanting and nonmonetary gold. Statistics for general merchandise trade are published for six broad end-use commodities: foods, feeds, and beverages; industrial supplies and materials; capital goods except automotive; automotive vehicles, parts, and engines; consumer goods except food and automotive; and other general merchandise. Each subcomponent is further broken down by detailed commodity according to an end-use classification system that is built from the World Customs Organization's Harmonized Commodity Description and Coding System.
Net exports of goods under merchanting
Net exports of goods under merchanting are goods purchased by U.S. residents from nonresidents and subsequently resold to nonresidents without entering the U.S. economy. Net exports of goods under merchanting are measured as the margin between the proceeds from selling the goods less the cost of acquiring the goods.
Nonmonetary gold
Nonmonetary gold includes bullion, gold powder, noncommemorative gold coins, and gold in other unwrought or semi-manufactured forms; the component covers all gold other than monetary gold.4 Gold is recognized as a separate component of goods because of its special role in financial markets and its detachment from current production, consumption, and income.
Source data and methods
Trade in goods statistics are primarily based on monthly data compiled by the U.S. Census Bureau, which are based on customs declarations filed with U.S. Customs and Border Protection (CBP) through the Automated Commercial Environment. In addition, certain components of goods trade are based on information from other government agencies (U.S. Postal Service (USPS) and U.S. Department of Defense (DOD)), private sources (Airbus, Airfinance Journal, IHS Markit, and Planespotters.net), partner countries (Statistics Canada and the U.S.-Canada Data Exchange), and international organizations (United Nations Comtrade).
BEA adjusts goods data from the Census Bureau to conform to the coverage, valuation, definitions, and concepts required for the International Economic Accounts and the National Economic Accounts. (See the box “Key Accounting Principles” for more on the principles used to compile the goods and other International Economic Accounts statistics.) These “balance-of-payments” adjustments include additions and deductions, which are applied to both exports and imports. Many of the adjustments account for transactions that are not covered by customs documents; collectively, the adjustments are small relative to the value of trade on a Census basis.5
Services
Generally, services are outputs over which ownership rights cannot be established nor can trading occur separate from production. Services are the result of production activities that change the condition of the consumer—by changing either the condition of the consumer's goods or the physical or mental condition of the consumer—or that facilitate the exchange of products and financial assets. Services transactions also include most knowledge-capturing products, which include outputs of information, advice, and entertainment that can be repeatedly accessed by the consumer. As noted above, sometimes the value of goods cannot be distinguished from the value of services in a transaction; for example, service values for maintenance and repair services n.i.e. (not included elsewhere) include the value of parts or materials supplied by the service provider.
Trade in services statistics are presented for 12 broad categories, which are presented in table 2 and described in more detail in the discussion that follows. The categories are predominantly product based and correspond to standard components recommended in international statistical standards.6 Detailed statistics for international trade in services are presented in ITA tables 3.1–3.3.
| Services by category and subcategory | Line number in ITA table 3.1 | |
|---|---|---|
| Exports | Imports | |
| Exports (Imports) of services | 1 | 55 |
| Manufacturing services on physical inputs owned by others | 2 | 56 |
| Maintenance and repair services n.i.e. | 3 | 57 |
| Transport | 4 | 58 |
| Sea transport | 5 | 59 |
| Freight | 6 | 60 |
| Port | 7 | 61 |
| Air transport | 8 | 62 |
| Passenger | 9 | 63 |
| Freight | 10 | 64 |
| Port | 11 | 65 |
| Other modes of transport | 12 | 66 |
| Travel (for all purposes including education) | 13 | 67 |
| Business | 14 | 68 |
| Expenditures by border, seasonal, and other short-term workers | 15 | 69 |
| Other business travel | 16 | 70 |
| Personal | 17 | 71 |
| Health related | 18 | 72 |
| Education related | 19 | 73 |
| Other personal travel | 20 | 74 |
| Construction1 | 21 | 75 |
| Construction abroad (in the United States) | 22 | 76 |
| Foreign (U.S.) contractors' expenditures in the United States (abroad) | 23 | 77 |
| Insurance services | 24 | 78 |
| Direct insurance | 25 | 79 |
| Reinsurance | 26 | 80 |
| Auxiliary insurance services | 27 | 81 |
| Financial services | 28 | 82 |
| Explicitly charged and other financial services | 29 | 83 |
| Brokerage and market-making services | 30 | 84 |
| Underwriting and private placement services | 31 | 85 |
| Credit card and other credit-related services | 32 | 86 |
| Financial management services | 33 | 87 |
| Financial advisory and custody services | 34 | 88 |
| Securities lending, electronic funds transfer, and other services | 35 | 89 |
| Financial intermediation services indirectly measured | 36 | 90 |
| Charges for the use of intellectual property n.i.e. | 37 | 91 |
| Franchises and trademarks licensing fees | 38 | 92 |
| Licenses for the use of outcomes of research and development | 39 | 93 |
| Licenses to reproduce and/or distribute computer software | 40 | 94 |
| Licenses to reproduce and/or distribute audiovisual products | 41 | 95 |
| Telecommunications, computer, and information services | 42 | 96 |
| Telecommunications services | 43 | 97 |
| Computer services | 44 | 98 |
| Information services | 45 | 99 |
| Other business services | 46 | 100 |
| Research and development services | 47 | 101 |
| Professional and management consulting services | 48 | 102 |
| Technical, trade-related, and other business services | 49 | 103 |
| Personal, cultural, and recreational services | 50 | 104 |
| Audiovisual services | 51 | 105 |
| Artistic-related services | 52 | 106 |
| Other personal, cultural, and recreational services | 53 | 107 |
| Government goods and services n.i.e. | 54 | 108 |
- ITA
- International Transactions Accounts
- n.i.e.
- Not included elsewhere
- For exports, the components of construction are construction abroad and foreign contractors' expenditures in the United States. For imports, the components are construction in the United States and U.S. contractors' expenditures abroad.
Manufacturing services on physical inputs owned by others
Manufacturing services on physical inputs owned by others include processing, assembly, labeling, packaging, and related services performed by firms that own neither the inputs nor the outputs of the manufacturing process. The owner of the goods pays the manufacturer a service fee for processing services. At this time, BEA lacks adequate source data to measure manufacturing services, so cell values for this category are marked as “n.a.” (not available). However, a partial measure of these services is indistinguishably included in technical, trade-related, and other business services in the other business services category.
Maintenance and repair services
Maintenance and repair services n.i.e cover maintenance and repair services by residents on goods owned by nonresidents. Certain types of repairs and maintenance are included in other categories: maintenance and repair of ships, aircraft, and other transport equipment are included in transport services because these transactions cannot be separately identified in BEA's source data; construction maintenance and repairs, including renovation, repair, or extension of fixed assets in the form of buildings, and repairs of railway facilities, harbors, and airfield facilities are included in construction; and computer maintenance and repairs are included in telecommunications, computer, and information services.
Transport
Transactions associated with moving people and property are included in transport services. Statistics on transport services are broken down into three main subcategories based on the mode of transport: sea, air, and other. The statistics for sea transport are further disaggregated between freight and port services; air transport is further classified into passenger, freight, and port services. Other modes of transport include postal services, port services for rail, and freight services performed by truck, rail, pipeline, and in space.
For both sea and air freight, exports include the transport of U.S. goods exports to foreign destinations and the transport of goods between foreign locations by U.S. vessel operators or air carriers; imports cover the transport of U.S. goods imports from foreign points to the United States by foreign vessel operators or air carriers. Port services (sea and air) include the value of nonfuel goods and services procured by foreign vessel operators or air carriers in U.S. ports (exports) and the value of nonfuel goods and services procured by U.S. vessel operators or air carriers in foreign ports (imports).7
For air transport, passenger services include the transport of nonresidents by U.S. air carriers between the United States and foreign countries and between two foreign points (exports) and the transport of U.S. residents by foreign air carriers between the United States and foreign countries and between two foreign points (imports).
Travel
Transactions involving goods and services acquired by individuals while visiting a country other than where they reside are included in travel, which is presented as “travel (for all purposes including education)” in BEA statistics. Statistics on travel are presented for two subcategories based on the primary purpose of travel: business and personal. These categories, in turn, are further broken down into more detailed components. Business travel is composed of two subcomponents: (1) expenditures by border, seasonal, and other short-term workers and (2) other business travel. Personal travel is composed of three components: health related, education related, and other personal travel.
Travel is a transactor-based category that covers both services and goods purchased by travelers, which are defined as persons that stay (or intend to stay) less than 1 year in a country where the traveler is not a resident. Travelers also include nonresidents with the primary purpose of obtaining education or medical treatment, regardless of their length of stay. Travel covers a variety of goods and services, primarily lodging, meals, transportation in the country of travel, entertainment, gifts, and other miscellaneous expenditures.
Construction
Construction covers the creation, renovation, repair, or extension of buildings, land improvements and civil engineering constructions, and the management of construction projects.
Insurance services
BEA compiles and presents three types of insurance services: direct insurance, reinsurance, and auxiliary insurance services. Direct insurance services consist of the provision of life insurance (including annuities) and nonlife (property and casualty) insurance. Reinsurance is the provision of insurance to another insurance company to cover risks associated with the purchasing company's policies, either individually or collectively. Auxiliary insurance services support direct insurance and reinsurance operations and include agents' commissions, insurance brokering and agency services, insurance consulting services, actuarial services, evaluation and adjustment services, salvage administration services, and other insurance administration services.
Direct insurance and reinsurance services are computed as a net measure based on gross premiums less a measure of losses that an insurer expects to pay, called “normal” losses; to this net measure, an estimate of investment income earned on policyholders' reserves, called “premium supplements,” is added.8
Financial services
BEA's statistics on financial services include both those services for which an explicit fee or commission is charged as well as those for which fees are implicit. Financial services include two main components: (1) explicitly charged and other financial services and (2) financial intermediation services indirectly measured (FISIM). Explicitly charged and other financial services are further broken down into six subcomponents: brokerage and market-making services; underwriting and private placement services; credit card and other credit-related services; financial management services; financial advisory and custody services; and securities lending, electronic funds transfer, and other services. The second main component of financial services, FISIM, is a specific type of implicit service; it reflects lending and deposit-taking services provided by banks and is measured by differences between a “pure” interest rate and a bank's monetary interest rates on loans and deposits.9
Charges for the use of intellectual property
Statistics on charges for the use of intellectual property n.i.e. cover transactions involving rights to reproduce, distribute, or otherwise use intellectual property that are not covered in other service types. BEA classifies and presents these transactions for four subcomponents: franchises and trademarks licensing fees, licenses for the use of outcomes of research and development, licenses to reproduce and/or distribute computer software, and licenses to reproduce and/or distribute audiovisual products. Charges for the use of intellectual property exclude outright sales or purchases of ownership rights to intellectual property, which are included in other parts of the ITAs as shown in chart 1.
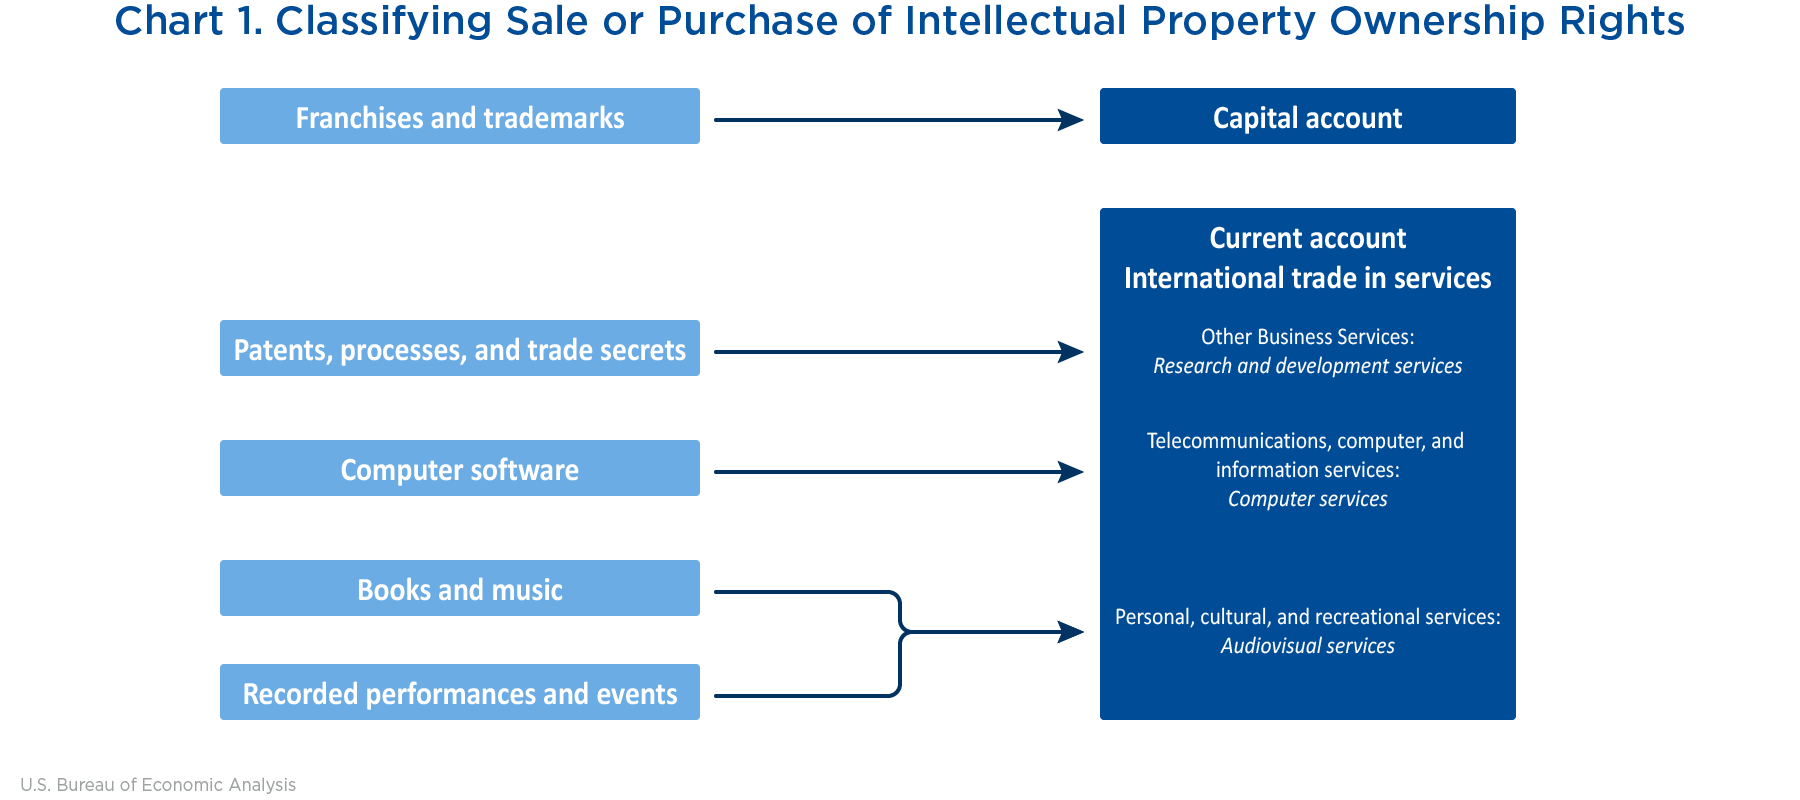
[Click chart to expand]
Additionally, two types of intellectual property licenses are classified in service categories other than charges for the use of intellectual property n.i.e. These include the end-user rights to computer software products (in telecommunications, computer, and information services) and to books, music, motion pictures, and recorded performances and events (in personal, cultural, and recreational services).
Telecommunications, computer, and information services
BEA classifies and presents statistics for each of the three components of telecommunications, computer, and information services. Telecommunications services cover services to broadcast or transmit sound, images, data, or other information by electronic means; these services include basic telecommunications, private leased channels, value-added services, support services, and reciprocal exchanges.10 Computer services include computer software—both end-user licenses and customized software—as well as computing and data storage services. Computing and data storage services includes cloud computing, data processing and hosting, hardware and software consultancy, installation, maintenance, and repair services. Information services cover news agency services, database services, and web search portals.
Other business services
BEA publishes three major subcomponents for the category other business services: research and development (R&D) services; professional and management consulting services; and technical, trade-related, and other business services. R&D services consist of customized and noncustomized R&D services; sales (or purchases) of proprietary rights resulting from work to increase the stock of knowledge such as patents, processes, and trade secrets; and testing and other development activities. Professional and management consulting services include a variety of services that can be grouped into two main subcomponents: (1) legal, accounting, management consulting, and public relations services and (2) advertising and related services. Technical, trade-related, and other business services cover a variety of services, namely architectural services; engineering services; scientific and other technical services; waste treatment and depollution services; services incidental to agriculture, forestry, and fishing; services incidental to mining and oil and gas extraction; operating leasing services; trade-related services; and other business services n.i.e.
Personal, cultural, and recreational services
BEA classifies and presents statistics on transactions in personal, cultural, and recreational services according to three subcomponents: audiovisual services; artistic-related services; and other personal, cultural, and recreational services. Audiovisual services include audiovisual production services for motion pictures, radio, television programs, and musical recordings as well as sales (or purchases) of rights to audiovisual originals associated with movies and television, books, and audio recordings. Artistic-related services include fees to performers, athletes, directors, and producers involved with live events, such as concerts, theatrical and musical productions, and sporting events. Other personal, cultural, and recreational services cover health services, education services, and heritage and recreational services.
Government goods and services n.i.e.
Statistics on government goods and services n.i.e include the value of both services and goods supplied by and to enclaves, that is, embassies, military bases, and international organizations. It also covers goods and services acquired from the host economy by official personnel (diplomats, consular staff, and military personnel) and their dependents. Government goods and services also cover transactions by and to governments that cannot be classified to specific service categories.11
Source data and methods
Trade in services statistics are based on data collected on BEA's quarterly, annual, and benchmark surveys of international trade in services as well as various external sources. BEA's trade in services survey program includes surveys on financial services, insurance services, selected services and transactions in intellectual property, and transport. BEA survey data is the primary source for construction; insurance services; financial services; charges for the use of intellectual property n.i.e.; telecommunications, computer, and information services; other business services; and personal, cultural, and recreational services. (See the box “Summary of Major Data Sources” for details on BEA's surveys.)
The services categories that rely most on external data include transport, travel (including education-related travel), and government goods and services. External data is also used for computer and information services, insurance services, and financial services.
External sources include the following other government agencies: Surface Transportation Board; Department of Commerce, International Trade Administration, National Travel and Tourism Office; Census Bureau; DOD; Department of Homeland Security (DHS), CBP; DHS, U.S. Immigration and Customs Enforcement, Student and Exchange Visitor Information System; Department of Labor, Bureau of Labor Statistics; Department of Transportation (DOT), Bureau of Transportation Statistics; DOT, Federal Aviation Administration; U.S. Department of the Treasury (Treasury Department), Treasury International Capital (TIC) System; and USPS. In addition, BEA uses information from private sources (Airlines Reporting Corporation, AM Best Company, Educational Commission for Foreign Medical Graduates, Institute of International Education, and IHS Markit) and partner countries (Statistics Canada, Bank of Mexico, and Mexican National Institute of Statistics and Geography).
Some services statistics are based on directly reported values, while others rely on computed values based on volumes and per-unit rates. For example, sea and air transport services statistics are produced by multistep methods that estimate transactions using rates multiplied by tonnage or passenger counts. Similarly, components of travel are based on a measure of average expenditures multiplied by the number of travelers.
Primary income
In the ITAs, primary income captures the return that accrues to institutional units for their contribution to production or for their provision of financial assets. BEA classifies and presents two main components of primary income: investment income and compensation of employees. Investment income is the return on holdings of financial assets. It is published separately for components associated with each of the functional categories of the financial account and IIP Accounts (except financial derivatives): direct investment; portfolio investment, other investment, and reserve assets.12 (For more information on functional categories, see the box “Functional Categories in the ITAs and IIP Accounts.”) Compensation of employees consists of the return to labor in the presence of an employer-employee relationship between a resident and a nonresident.13
Each of these types of investment income is further broken down by type of instrument in detailed ITA tables 4.1–4.4. An overview of the components of primary income is presented in table 3.
| Component | Line number in ITA table 4.1 | |
|---|---|---|
| Receipts | Payments | |
| Primary income | 1 | 23 |
| Investment income | 2 | 24 |
| Direct investment income | 3 | 25 |
| Income on equity | 4 | 26 |
| Dividends and withdrawals | 5 | 27 |
| Reinvested earnings | 6 | 28 |
| Interest1 | 7 | 29 |
| Portfolio investment income | 10 | 32 |
| Income on equity and investment fund shares | 11 | 33 |
| Dividends on equity other than investment fund shares | 12 | 34 |
| Income attributable to investment fund shareholders | 13 | 35 |
| Interest on debt securities | 14 | 36 |
| Short term | 15 | 37 |
| Long term | 16 | 38 |
| Other investment income | 17 | 39 |
| Interest | 18 | 40 |
| Income attributable to insurance policyholders | 19 | 41 |
| Reserve asset income2 | 20 | -- |
| Interest | 21 | -- |
| Compensation of employees | 22 | 42 |
- ITA
- International Transactions Accounts
- Interest is presented on an asset/liability basis in ITA table 4.1.
- Reserve asset income is included in U.S. primary income receipts only. Payments are not applicable for this functional category because it pertains to investments of the U.S. monetary authorities.
Direct investment income
Direct investment income consists of the return that parents and affiliates earn on their investments abroad or in the United States. (For definitions of the terms parents and affiliates, see the box “Direct Investment Key Terms.”) Direct investment income consists of two main components: income on equity and interest. Income on equity, also called earnings, is the parent's share of the earnings (or losses) from its affiliates' current operations, which is recorded as it accrues and before the deduction of withholding taxes on dividends.14 Interest corresponds to those amounts received or paid on intercompany debt before the deduction of withholding taxes.
Earnings need not be distributed to parent companies to be recognized in direct investment income; earnings include both those distributed to parents (“dividends and withdrawals”) and those reinvested in affiliates (“reinvested earnings”). Reinvested earnings are the earnings that remain after distributions have been made. It is possible for reinvested earnings to be negative if an affiliate has a loss on its operations in the reference period or if dividends exceed earnings in the reference period.
The featured measure of direct investment income on equity includes a current-cost adjustment to the income reported on BEA's direct investment surveys. This adjustment is applied to the reinvested earnings component of income to ensure that charges for depreciation and depletion recorded at historical cost (book value) reflect current-period prices and to align income earned in a particular period with charges against income in the same period, as required by economic accounting principles.
ITA table 4.2 provides direct investment income statistics in the most detail, including two presentational bases, an asset/liability basis, which is the featured measure in the ITAs, and a directional basis.15 (See the box “Direct Investment: Asset/Liability Versus Directional Basis” for more information on these two presentations.)
Portfolio investment income
In general terms, portfolio investment income is earned by a resident investor on equity and investment fund shares and debt securities issued in a foreign economy that are covered by the functional category portfolio investment. It includes dividends and interest and excludes other types of returns, such as those associated with holding gains and losses. In the ITAs, portfolio investment income receipts consist of income received by U.S. residents who own equity or debt securities issued by foreign governments or business enterprises. Portfolio investment income payments consist of income paid to nonresidents who own equity or debt securities issued by the U.S. government, U.S. federally sponsored agencies, or U.S. business enterprises. Statistics on portfolio investment income are classified and presented for two major components: (1) income on equity and investment fund shares and (2) interest on debt securities.
Other investment income
Other investment income is income received by a resident with a financial claim on a nonresident counterparty that is covered by the functional category other investment; this includes loans, deposits, insurance technical reserves, and trade credit and advances. In the ITAs, other investment income receipts include income received by U.S. residents on loans to nonresidents (including resale agreements), extensions of trade credit and advances to nonresidents, deposits in foreign banks (including resale agreements), and claims on insurance technical reserves of nonresident insurance companies. Other investment income payments include income paid to nonresidents on loans (including repurchase agreements) and extensions of trade credit and advances to U.S. residents, on deposits in U.S. banks (including repurchase agreements), and on claims on insurance technical reserves of U.S. insurance companies.
Reserve asset income
Reserve asset income is investment income earned on U.S. monetary authorities' foreign investments. In the ITAs, U.S. reserve asset income receipts include returns on U.S. foreign currency reserves, which are invested in a variety of high liquidity, high credit-quality instruments with market rates of return. These include investments in German, French, Dutch, and Japanese government securities; investments at official institutions and foreign central banks; assets held in the U.S. reserve position at the IMF; and special drawing rights (SDRs) held in the U.S. SDR account at the IMF.16
Compensation of employees
Compensation of employees is income earned by residents that are directly employed by a foreign resident, a foreign government, or an international organization. In the ITAs, these receipts include earnings of U.S. residents that are employed temporarily abroad, employed by foreign governments in the United States, or employed by international organizations in the United States. Payments include earnings of Canadian and Mexican workers who commute to work in the United States, foreign students studying at colleges and universities in the United States, foreign professionals temporarily residing in the United States, foreign temporary agricultural workers in the United States, foreign temporary nonagricultural workers in the United States, and foreign nationals working for U.S. diplomatic missions abroad.
Source data and methods
BEA statistics on primary income are based on a variety of sources and methods. Direct investment income statistics are largely based on data from BEA's direct investment surveys. Portfolio investment income, other investment income, and reserve asset income statistics are primarily derived by type of asset and liability as the product of average positions for the reference period (derived from the IIP Accounts) and effective yields. Effective yields are based on information from the Treasury Department's TIC system, and from private sources including Morgan Stanley Capital International (MSCI), S&P Dow Jones Indices, and Intercontinental Exchange (ICE) price indexes. Compensation of employees statistics are based on direct reporting by foreign central banks, counterpart statistical organizations, and international organizations, supplemented by estimates based on numbers of employees and average compensation using data from various government and private sources.
Secondary income
In the ITAs, secondary income represents current transfers between residents and nonresidents. The distinguishing feature of secondary income transactions versus other transactions in the current account is that there is no exchange of value. Rather, a transfer is a transaction in which a good, service, or asset is provided without a corresponding return of economic value (that is, no quid pro quo). BEA classifies and presents two main components of secondary income: general government transfers and private transfers.17 Both receipts and payments are presented for each of these two components based on the type of U.S. entity involved with the transfer. Secondary income receipts and payments are further classified and presented by more detailed subcomponents in ITA table 5.1. These subcomponents differ between secondary income receipts and payments; see table 4.18
| Receipts | Payments | ||
|---|---|---|---|
| Component | Line number in ITA table 5.1 | Component | Line number in ITA table 5.1 |
| Secondary income (current transfer) | 1 | Secondary income (current transfer) | 11 |
| General government transfer receipts | 2 | General government transfer payments | 12 |
| Taxes on income, wealth, etc. | 3 | Social benefits | 13 |
| International cooperation | 4 | International cooperation | 14 |
| Fines and penalties | 5 | Contributions to international organizations | 15 |
| Other general government transfer receipts | 6 | Other general government transfer payments | 16 |
| Private transfer receipts | 7 | Private transfer payments | 17 |
| Insurance-related transfers | 8 | Personal transfers | 18 |
| Fines and penalties | 9 | Insurance-related transfers | 19 |
| Other private transfer receipts | 10 | Taxes on income, wealth, etc. | 20 |
| Fines and penalties | 21 | ||
| Charitable donations | 22 | ||
| Transfers to foreign students | 23 | ||
| Other private transfer payments | 24 | ||
- ITA
- International Transactions Accounts
Source data and methods
BEA uses a variety of data sources and methods to compile the secondary income statistics. Statistics on general government transfers primarily rely on information from other government agencies (Treasury Department, Internal Revenue Service (IRS), Department of Education, U.S. Agency for International Development, DOD, and others). Private transfers are based on a variety of sources and methods including BEA surveys, government agencies (IRS, Department of Education, USPS, Census Bureau, and others), partner country data, and private sources.
Capital account
The capital account presents statistics on capital transfers between residents and nonresidents as well as transactions in nonproduced nonfinancial assets. Although current transfers (secondary income) and capital transfers are both transactions without an exchange of value (that is, no quid pro quo), capital-account transactions are distinguished from current-account transactions by the fact that capital transfers do not affect measures of production, income, and savings. In contrast, current transfers directly affect disposable income and savings and influence the consumption of goods or services.19
Capital transfers include debt forgiveness, nonlife insurance payments resulting from catastrophic events, and investment grants. Transactions in nonproduced nonfinancial assets include acquisitions and disposals related to both tangible and intangible assets such as natural resources and contracts, leases, and licenses.20 Transactions are often intermittent and are recorded in the ITAs when large transactions are identified. Capital-account statistics are not presented in a separate table but are included in ITA tables 1.1–1.4.
In the capital account of the ITAs, disposals of nonproduced nonfinancial assets and capital transfer receipts are recorded as credits. Acquisitions of nonproduced nonfinancial assets and capital transfer payments are recorded as debits.
Source data and methods
BEA's capital-account statistics are based on a variety of sources including BEA's international trade in services surveys as well as publicly available information and data from various government agencies including the Treasury Department and Department of State.
Financial account
The financial account presents statistics on transactions in financial instruments between U.S. residents and nonresidents.21 Financial instruments typically give rise to claims and liabilities between a party and a counterparty and may take any of a variety of forms of financial contract.22 While the current account uses the terms exports and imports (for goods and services) and receipts and payments (for primary and secondary income) for credits and debits, the financial account uses the terms “net acquisition of financial assets” and “net incurrence of liabilities.”
The financial account of the ITAs is presented for the five major functional categories: direct investment; portfolio investment, other investment, reserves, and financial derivatives other than reserves. Most of these categories are broken down by instrument; some instruments are further broken down by maturity.23 ITA tables 1.2–1.4 present an overview of information on the financial account. Detailed statistics on direct investment, portfolio investment, and other investment are presented, respectively, in ITA tables 6.1, 7.1, and 8.1. ITA table 9.1 presents financial transactions for liabilities to foreign official agencies. Table 5 presents the standard components included in the financial account.
| Net U.S. acquisition of financial assets excluding financial derivatives | Net U.S. incurrence of liabilities excluding financial derivatives | ||
|---|---|---|---|
| Component | Line number in ITA table 1.2 | Component | Line number in ITA table 1.2 |
| Net U.S. acquisition of financial assets excluding financial derivatives (net increase in assets / financial outflow (+)) | 67 | Net U.S. incurrence of liabilities excluding financial derivatives (net increase in liabilities / financial inflow (+)) | 91 |
| Direct investment assets | 68 | Direct investment liabilities | 92 |
| Equity | 69 | Equity | 93 |
| Debt instruments | 70 | Debt instruments | 94 |
| Portfolio investment assets | 71 | Portfolio investment liabilities | 95 |
| Equity and investment fund shares | 72 | Equity and investment fund shares | 96 |
| Debt securities | 73 | Debt securities | 97 |
| Short term | 74 | Short term | 98 |
| Long term | 75 | Long term | 99 |
| Other investment assets | 76 | Other investment liabilities | 100 |
| Other equity | 77 | Other equity | 101 |
| Currency and deposits | 78 | Currency and deposits | 102 |
| Loans | 79 | Loans | 103 |
| Insurance technical reserves | 80 | Insurance technical reserves | 104 |
| Trade credit and advances | 81 | Trade credit and advances | 105 |
| Special drawing rights allocations | 106 | ||
| Reserve assets | 82 | ||
| Monetary gold | 83 | ||
| Special drawing rights | 84 | ||
| Reserve position in the International Monetary Fund | 85 | ||
| Other reserve assets | 86 | ||
| Currency and deposits | 87 | ||
| Securities | 88 | ||
| Financial derivatives | 89 | ||
| Other claims | 90 | ||
| Financial derivatives other than reserves, net transactions | 107 | ||
- ITA
- International Transactions Accounts
Direct investment
Direct investment is distinguished from other types of international investment based on ownership of 10 percent or more by a resident in a nonresident entity's voting ownership, which is the threshold generally associated with significant and lasting influence on the management of a business enterprise.24 BEA classifies and presents direct investment financial transactions for two major components: equity and debt instruments. Equity is further broken down into equity other than the reinvestment of earnings and reinvestment of earnings.
Equity other than the reinvestment of earnings covers parents' equity in legally incorporated affiliates—including holdings of capital stock in, and other capital contributions to, its affiliates—and equity in unincorporated affiliates, which consists of the parents' share of the affiliates' total owners' equity.25 Equity investment other than reinvestment of earnings is measured as the net of parents' equity increases and equity decreases in their affiliates in a reference period. Equity increases result from the establishment of new affiliates, initial acquisitions of a 10 percent or more ownership interest in existing businesses, acquisitions of additional ownership interests in existing affiliates, and capital contributions to affiliates. Decreases in equity other than reinvestment of earnings result from liquidations, partial or total sales of ownership interests, and the return of capital contributions.
Reinvestment of earnings recognizes the fact that the earnings of an affiliate, which are income to the parent, increase the parent's investment in the affiliate if they are not distributed to the parent.26 Reinvested earnings are measured as total earnings less dividends and withdrawals. The featured measures of direct investment transactions and its reinvestment of earnings component include a current-cost adjustment; statistics are also presented without current-cost adjustment in ITA table 6.1.
The debt instruments component of direct investment captures lending and borrowing activity between parents and affiliates. If a direct investment parent extends a new loan to its affiliate, then the balance of the parent's receivables (amounts due) from the affiliate increases; subsequently, when the affiliate repays principal owed to its parent, the balance of the parent's receivables from the affiliate is reduced. If a parent borrows funds from its affiliate, then the balance of the parent's payables (amounts owed) to the affiliate increases; subsequently, when the parent repays principal owed to its affiliate, the balance of the parent's payables to the affiliate is reduced. In addition to transactions between parents and affiliates, transactions in debt instruments may also occur between fellow enterprises, which are entities owned by the same direct investor but neither one having control or influence over the other.
Detailed statistics on direct investment are available in ITA table 6.1, which also presents the conversion from the asset/liability basis to the directional basis for direct investment financial transactions. (See the box “Direct Investment: Asset/Liability Versus Directional Basis” for more information on these two presentations.)
Source data and methods
Statistics on direct investment financial transactions are primarily based on data collected on BEA's quarterly, annual, and benchmark direct investment surveys. (For more on BEA's surveys, see the box “Summary of Major Data Sources.”)
Portfolio investment
Portfolio investment includes international financial transactions in debt or equity securities except those that are included in direct investment or reserve assets. Like other components of the financial account, portfolio investment transactions are measured and presented on a net basis. That is, net U.S. acquisition of portfolio investment assets is measured as U.S. residents' net purchases (gross purchases less gross sales) of foreign securities. Similarly, net U.S. incurrence of liabilities is measured as nonresidents' net purchases of U.S. securities.
Statistics on portfolio investment are presented for two major subcomponents: (1) equity and investment fund shares and (2) debt securities. The statistics are further broken down by maturity, sector of U.S. holder (for assets), and sector of U.S. issuer (for liabilities) in ITA table 7.1. Transactions in portfolio investment liabilities to foreign official agencies are presented in ITA table 9.1. Table 6a shows the detail available by instrument for U.S. assets and for U.S. liabilities; detail by security type is mostly the same for foreign and U.S. securities except for certain debt securities. Table 6b shows the detail available in ITA table 7.1 by sector of U.S. holder (for assets) and by sector of U.S. issuer (for liabilities).
| Assets by type of foreign security | Line number in ITA table 7.1 | Liabilities by type of U.S. security | Line number in ITA table 7.1 |
|---|---|---|---|
| Net U.S. acquisition of portfolio investment assets | 1 | Net U.S. incurrence of portfolio investment liabilities | 14 |
| Equity and investment fund shares | 2 | Equity and investment fund shares | 15 |
| Equity other than investment fund shares | 3 | Equity other than investment fund shares | 16 |
| Investment fund shares | 4 | Investment fund shares | 17 |
| Debt securities | 5 | Debt securities | 18 |
| Short term | 6 | Short term | 19 |
| Negotiable certificates of deposit | 7 | Treasury bills and certificates | 20 |
| Commercial paper | 8 | Federally sponsored agency securities | 21 |
| Other short-term securities | 9 | Negotiable certificates of deposit | 22 |
| Commercial paper and other securities | 23 | ||
| Long term | 10 | Long term | 24 |
| Government securities | 11 | Treasury bonds and notes | 25 |
| Corporate bonds and notes | 12 | State and local government securities | 26 |
| Negotiable certificates of deposit | 13 | Federally sponsored agency securities | 27 |
| Corporate bonds and notes | 28 | ||
| Negotiable certificates of deposit | 29 |
- ITA
- International Transactions Accounts
| Assets by sector of U.S. holder | Line number in ITA table 7.1 | Liabilities by sector of U.S. issuer | Line number in ITA table 7.1 |
|---|---|---|---|
| Net U.S. acquisition of portfolio investment assets | 30 | Net U.S. incurrence of portfolio investment liabilities | 46 |
| Deposit-taking institutions except central bank | 31 | Deposit-taking institutions except central bank | 47 |
| Equity and investment fund shares | 32 | Equity and investment fund shares | 48 |
| Debt securities | 33 | Debt securities | 49 |
| Short term | 34 | Short term | 50 |
| Long term | 35 | Long term | 51 |
| Other financial institutions | 36 | Other financial institutions | 52 |
| Equity and investment fund shares | 37 | Equity and investment fund shares | 53 |
| Debt securities | 38 | Debt securities | 54 |
| Short term | 39 | Federally sponsored agency securities | 55 |
| Long term | 40 | Short term | 56 |
| Long term | 57 | ||
| Other securities | 58 | ||
| Short term | 59 | ||
| Long term | 60 | ||
| Nonfinancial institutions except general government | 41 | Nonfinancial institutions except general government | 61 |
| Equity and investment fund shares | 42 | Equity and investment fund shares | 62 |
| Debt securities | 43 | Debt securities | 63 |
| Short term | 44 | Short term | 64 |
| Long term | 45 | Long term | 65 |
| General government | 66 | ||
| Debt securities | 67 | ||
| U.S. Treasury securities | 68 | ||
| Short term | 69 | ||
| Long term | 70 | ||
| State and local government long-term securities | 71 |
- ITA
- International Transactions Accounts
Source data and methods
Statistics on portfolio investment are largely based on information from the Treasury Department's TIC system. The TIC data are supplemented by information from private sources: MSCI, S&P Dow Jones Indices, ICE indexes, and the Depository Trust & Clearing Corporation (DTCC).
Other investment
Other investment, a residual category, includes financial-account transactions other than those included in direct investment, portfolio investment, reserve assets, and financial derivatives other than reserves. Other investment covers a wide variety of financial instruments that are typically, but not exclusively, issued and held by financial institutions. Like most other components of the financial account, other investment transactions are measured and presented on a net basis. Net U.S. acquisition of other investment assets is measured as U.S. residents' gross acquisitions less gross disposals of foreign financial instruments. Similarly, net U.S. incurrence of other investment liabilities is measured as nonresidents' gross acquisitions less gross disposals of U.S. financial instruments.
The statistics on other investment transactions are broken down by type of claim or liability in ITA table 8.1. Other investment is recorded and presented for the components other equity, currency and deposits, loans, insurance technical reserves, and trade credit and advances; for net incurrence of other investment liabilities, the component SDR allocations is also presented. The statistics are also presented by sector of the U.S. holder or U.S. issuer and are further broken down by maturity for certain sectors.27 Table 7a shows the detail available by instrument in ITA table 8.1; table 7b shows the detail available by sector and maturity. Each of the major types of claims or liabilities is described below.
| Assets by type of claim on foreign residents | Line number in ITA table 8.1 | Liabilities by type of liability to foreign residents | Line number in ITA table 8.1 |
|---|---|---|---|
| Net U.S. acquisition of other investment assets | 1 | Net U.S. incurrence of other investment liabilities | 15 |
| Other equity | 2 | Other equity | 16 |
| Currency and deposits | 3 | Currency and deposits | 17 |
| Currency (short term) | 4 | Currency (short term) | 18 |
| Deposits | 5 | Deposits | 19 |
| Loans | 8 | Loans | 22 |
| Insurance technical reserves1 | 11 | Insurance technical reserves1 | 25 |
| Trade credit and advances | 12 | Trade credit and advances | 26 |
| Special drawing rights allocations | 29 |
- ITA
- International Transactions Accounts
- Because of a lack of source data, financial transactions for insurance technical reserves are not separately reported. At this time, transactions in insurance technical reserves are comingled with transactions in loans.
| Assets by sector of U.S. holder | Line number in ITA table 8.1 | Liabilities by sector of U.S. issuer | Line number in ITA table 8.1 |
|---|---|---|---|
| Net U.S. acquisition of other investment assets | 30 | Net U.S. incurrence of other investment liabilities | 62 |
| Central bank | 31 | Central bank | 63 |
| Currency and deposits | 32 | Currency and deposits | 64 |
| Deposits | 33 | Currency (short term) | 65 |
| Short term | 34 | Deposits | 66 |
| Short term | 67 | ||
| Deposit-taking institutions except central bank | 35 | Deposit-taking institutions except central bank | 68 |
| Of which: Interbank transactions | 36 | Of which: Interbank transactions | 69 |
| Currency and deposits | 37 | Currency and deposits | 70 |
| Deposits | 38 | Deposits | 71 |
| Of which: Resale agreements | 39 | Of which: Repurchase agreements | 72 |
| Short term1 | 40 | Short term1 | 73 |
| Long term1 | 41 | Long term1 | 74 |
| Loans | 42 | Loans | 75 |
| Short term1 | 43 | Short term1 | 76 |
| Long term1 | 44 | Long term1 | 77 |
| Other financial institutions and nonfinancial institutions except general government | 45 | Other financial institutions and nonfinancial institutions except general government | 78 |
| Currency and deposits | 46 | Currency and deposits | 79 |
| Deposits | 47 | Deposits | 80 |
| Short term1 | 48 | Short term1 | 81 |
| Long term1 | 49 | Long term1 | 82 |
| Loans | 50 | Loans | 83 |
| Of which: Resale agreements | 51 | Of which: Repurchase agreements | 84 |
| Short term1 | 52 | Short term1 | 85 |
| Long term1 | 53 | Long term1 | 86 |
| Insurance technical reserves | 54 | Insurance technical reserves | 87 |
| Trade credit and advances | 55 | Trade credit and advances | 88 |
| Short term1 | 56 | Short term1 | 89 |
| Long term1 | 57 | Long term1 | 90 |
| General government | 58 | General government | 91 |
| Other equity | 59 | Trade credit and advances | 92 |
| Loans | 60 | Long term | 93 |
| Long term | 61 | Special drawing rights allocations | 94 |
- ITA
- International Transactions Accounts
- Source data limitations do not yet permit a full breakout by maturity across every level of aggregation. ITA table 8.1 includes placeholder lines for all the maturity detail BEA intends to eventually publish.
Other equity covers financial transactions in equity that are not in the form of securities and are not included in the functional categories of direct investment or reserve assets. For U.S. assets, other equity includes the U.S. government's financial transactions (capital subscriptions and contributions) with international financial institutions. BEA lacks source data to separately measure other equity transactions for U.S. liabilities.
Currency is measured and presented for U.S. liabilities only.28 Transactions represent net shipments of U.S. currency into and out of the United States.
Deposits cover claims and liabilities with nonresidents for U.S. financial and nonfinancial institutions and their customers. Deposit claims also include the U.S. monetary authorities' assets held abroad as part of central bank liquidity swaps with foreign central banks.29 U.S. central bank deposit liabilities to foreign central banks include liabilities from repurchase agreements.
Loans cover claims and liabilities with nonresidents for U.S. financial and nonfinancial institutions and their customers as well as U.S. government agencies' loan claims on nonresidents.
Insurance technical reserves transactions are not separately reported currently because of a lack of source data; these transactions are comingled with transactions in loans.
Trade credits and advances include claims and liabilities of U.S. financial and nonfinancial institutions with nonresidents. Liabilities also include U.S. government liabilities to foreign governments from funds advanced, typically, for the purchase of military goods and services.
SDR allocations are liabilities of the U.S. Treasury Department to other governments that participate in the SDR program; transactions in this component, which rarely occur, are classified in the general government sector.
Source data and methods
Statistics on other investment are primarily based on data from the Treasury Department (TIC system, Monthly Treasury Statement, and the Foreign Credit Reporting System). Other data sources include the Federal Reserve Board (FRB), Federal Reserve Bank of New York (FRBNY), DOD, IMF, DTCC, and counterparty data from foreign central banks and the Bank for International Settlements (BIS). BEA's quarterly direct investment surveys are used to remove transactions included in the TIC source data but classified in direct investment.
Reserve assets
Reserve assets cover the external assets that are readily available to, and controlled by, the U.S. monetary authorities in order to meet balance-of-payments financing needs, intervene in exchange-rate markets to affect the currency exchange rate, and for other purposes. The main components of reserve assets that are measured and presented in the financial account of the ITAs include monetary gold, IMF SDRs, reserve position in the IMF, and other reserve assets. Because of their nature, reserve assets are recorded as a component of net acquisition of financial assets (excluding financial derivatives) only; reserve assets are not a component in net incurrence of liabilities.30
There is no dedicated ITA table on U.S. reserve assets; the transactions are recorded in lines 82–90 of ITA table 1.2. Table 8 illustrates the detail available in ITA table 1.2. Each component is discussed in more detail below.
| Assets by type | Line number in ITA table 1.2 |
|---|---|
| Net U.S. acquisition of financial assets excluding financial derivatives (net increase in assets / financial outflow (+)) | 67 |
| Reserve assets | 82 |
| Monetary gold | 83 |
| Special drawing rights | 84 |
| Reserve position in the International Monetary Fund | 85 |
| Other reserve assets | 86 |
| Currency and deposits | 87 |
| Securities | 88 |
| Financial derivatives | 89 |
| Other claims | 90 |
- ITA
- International Transactions Accounts
Monetary gold represents the value of gold transferred to, or received from, a foreign monetary authority or international institution such as the IMF by the U.S. monetary authorities. Transactions in monetary gold are rare.
SDRs are international reserve assets, which serve as the unit of account of the IMF and some other international organizations. An SDR represents a potential claim on the freely usable currencies of IMF members but are not a currency or a claim on the IMF.
The U.S. reserve position in the IMF includes the U.S. General Resources (or tranche) Account plus any borrowing or repayments by the IMF from the United States through various borrowing facilities.
Other reserve assets can include currency and deposits, securities, financial derivatives, and other claims, such as repurchase agreements that are readily redeemable in foreign currencies. A significant portion of the U.S. monetary authorities' foreign exchange reserves is invested on an outright basis in German, French, Dutch, and Japanese government securities. Reserves are also invested at official institutions such as the BIS and foreign central banks.
Source data and methods
Statistics on reserve assets are based on source data from the Treasury Department, FRBNY, and the IMF.
Financial derivatives other than reserves
Financial derivatives other than reserves include U.S. transactions with nonresidents in financial instruments whose value is derived from one or more underlying instruments. Derivatives include futures, options, and swaps that can be traded on exchanges or in over-the-counter markets. Underlying instruments may include securities, equity or other indexes, debt instruments, commodities, other derivative instruments, or any other agreed-upon arrangement. Transactions are recorded for sales, purchases, periodic settlements, and final settlements.
Unlike the other functional categories in the financial account, transactions for assets and liabilities are not separately reported for financial derivatives because of the difficulty in characterizing transactions as being related to either assets or liabilities. Transactions in financial derivatives are available in BEA's source data and presented in the statistics on a net settlement basis. Net settlements for financial derivatives are presented in ITA table 1.2 on a single line (line 107), separate from net U.S. acquisition of assets and net U.S. incurrence of liabilities.
Source data and methods
Statistics on financial derivatives are based on Treasury Department TIC data.
Balances and the statistical discrepancy
In addition to statistics on the current account, capital account, and financial account, the ITAs present the statistical discrepancy and several key balances.
The statistical discrepancy is the difference between total debits and total credits recorded in the three component accounts of the ITAs (current account, capital account, and financial account). The value of the statistical discrepancy can be calculated as the difference between net lending/borrowing as measured by transactions recorded in the financial account and net lending/borrowing as measured by transactions recorded in the current and capital accounts. Various types of measurement issues can contribute to the size of the statistical discrepancy.31 Rapid change, heightened uncertainty, and increased activity levels in markets can also contribute to the size of the discrepancy in a particular reference period.
The balances section of the ITAs presents several key balances, measured as credits less debits: balance on current account; balance on capital account; and balances on key components including goods and services, goods, services, primary income, and secondary income. A positive balance indicates a surplus while a negative balance indicates a deficit. The balance on the current account is the difference between credits (exports of goods and services and income receipts) and debits (imports of goods and services and income payments) in the current account.
The balance on goods and services is often referred to as the “trade balance” and is published not only in BEA's quarterly and annual ITAs, but it is also included in a monthly joint release with the Census Bureau.
More information on the ITAs
For a more indepth discussion of the methods and data sources used to compile the ITAs, see U.S. International Economic Accounts: Concepts and Methods (chapters 10–21).
Release and revision cycle
The ITAs are prepared and released quarterly, both with and without seasonal adjustment, and annually. Transactions are presented in current dollars, which are prices current in a given reference period. Preliminary quarterly statistics are released in March, June, September, and December, approximately 80 days after the end of the reference quarter. These statistics are revised the following quarter to incorporate new source data. Preliminary annual statistics are released in March. Annual updates occur each June and incorporate (1) newly available and revised source data for the preceding 3 years for both annual and quarterly statistics, (2) recalculated seasonal adjustments for the preceding 5 years, and (3) for selected series, new or updated methodologies, data sources, or statistical presentations for additional years.
Statistical releases for the ITAs are accompanied by a quarterly news release and a Survey of Current Business article in the month following the release.
Overview and structure
The IIP Accounts are a statistical balance sheet that presents the dollar value of accumulated stocks of U.S. residents' financial assets and liabilities with foreign residents at a specific point in time. Included in the IIP Accounts is the U.S. net international investment position, which is the value of U.S. financial assets less the value of U.S. liabilities. A positive net international investment position represents a U.S. net claim on the rest of the world, while a negative net international investment position represents a U.S. net liability to the rest of the world.
The IIP Accounts are classified and presented for each of the five functional categories, with further classification by type of financial instrument; detail is similar to that presented for financial-account transactions in the ITAs. (For more information on functional categories, see the box “Functional Categories in the ITAs and IIP Accounts.”) Table 9 reproduces IIP table 1.1 for 2018–2020.
| Line | Type of investment | 2018 | 2019 | 2020 |
|---|---|---|---|---|
| 1 | U.S. net international investment position (line 4 less line 12) | −9,684.7 | −11,231.4 | −14,011.2 |
| 2 | Net international investment position excluding financial derivatives (line 5 less line 13) | −9,726.7 | −11,251.6 | −14,004.6 |
| 3 | Financial derivatives other than reserves, net (line 6 less line 14) | 42.0 | 20.2 | −6.6 |
| 4 | U.S. assets | 25,217.9 | 29,108.3 | 32,256.3 |
| 5 | Assets excluding financial derivatives (sum of lines 7, 8, 10, and 11) | 23,768.3 | 27,317.9 | 29,710.6 |
| 6 | Financial derivatives other than reserves, gross positive fair value (line 9) | 1,449.6 | 1,790.4 | 2,545.7 |
| By functional category: | ||||
| 7 | Direct investment at market value | 7,417.4 | 8,702.2 | 9,405.1 |
| 8 | Portfolio investment | 11,433.6 | 13,366.2 | 14,605.6 |
| 9 | Financial derivatives other than reserves, gross positive fair value | 1,449.6 | 1,790.4 | 2,545.7 |
| 10 | Other investment | 4,468.3 | 4,735.0 | 5,072.6 |
| 11 | Reserve assets | 449.1 | 514.4 | 627.3 |
| 12 | U.S. liabilities | 34,902.6 | 40,339.7 | 46,267.6 |
| 13 | Liabilities excluding financial derivatives (sum of lines 15, 16, and 18) | 33,495.0 | 38,569.4 | 43,715.2 |
| 14 | Financial derivatives other than reserves, gross negative fair value (line 17) | 1,407.5 | 1,770.3 | 2,552.4 |
| By functional category: | ||||
| 15 | Direct investment at market value | 8,393.5 | 10,486.0 | 11,977.9 |
| 16 | Portfolio investment | 18,844.2 | 21,565.5 | 24,628.4 |
| 17 | Financial derivatives other than reserves, gross negative fair value | 1,407.5 | 1,770.3 | 2,552.4 |
| 18 | Other investment | 6,257.4 | 6,517.9 | 7,108.9 |
The IIP Accounts are comprised of four tables (tables 1.1, 1.2, 1.3, and 2.1) and an addendum (table 3.1).
- Table 1.1 presents the end-of-quarter U.S. net international investment position as well as positions for assets and liabilities by functional category.
- Table 1.2 covers the same positions presented in table 1.1 with expanded detail by type of instrument.
- Table 1.3 presents end-of-year positions classified the same way as in table 1.2 but also decomposes the annual change between financial-account transactions and other changes in position (including price changes, exchange-rate changes, and changes in volume and valuation n.i.e.).
- Table 2.1 presents direct investment positions at market value on an asset/liability basis and the conversion to a directional basis at historical cost.
- Table 3.1 presents the IIP for U.S. liabilities to foreign official agencies.
Positions and changes in position
The IIP Accounts and the financial account of the ITAs are closely related: the position at the end of a reference period equals the position at the start of the period plus financial-account transactions for the reference period plus other changes in position during the period. (See the box “Transactions, Other Flows, and Positions in the IIP Accounts.”)
IIP table 1.3 presents beginning positions, ending positions, and a decomposition of change for the net international investment position and for U.S. assets and U.S. liabilities with detail for each of the five functional categories and some detail by instrument and maturity. The level of detail by category, instrument, and maturity presented in table 1.3 mostly aligns with that presented for the financial account in ITA table 1.2 but includes greater detail than the associated financial-account transactions for certain debt securities and financial derivatives.
Table 10 presents an excerpt from IIP table 1.3 that highlights the net international investment position (excluding financial derivatives) as well as total U.S. assets and total U.S. liabilities (both excluding derivatives). The table illustrates the change in positions from the beginning of a reference period to the end of a reference period (for 2020) as a result of financial transactions and other changes, which are decomposed into price changes, exchange-rate changes, and changes in volume and valuation n.i.e.
| Line number in IIP table 1.3 | Type of investment | Yearend position, 2019 | Change in position in 2020 | Yearend position, 2020 | |||||
|---|---|---|---|---|---|---|---|---|---|
| Total | Attributable to: | ||||||||
| Financial-account trans- actions | Other changes in position | ||||||||
| Total | Price changes | Exchange rate changes | Changes in volume and valuation n.i.e. | ||||||
| 2 | Net international investment position excluding financial derivatives | −11,251.6 | −2,753.0 | −647.2 | −2,105.8 | −3,169.0 | 1,010.1 | 53.1 | −14,004.6 |
| 5 | Assets excluding financial derivatives | 27,317.9 | 2,392.8 | 809.3 | 1,583.4 | 345.4 | 1,097.7 | 140.3 | 29,710.6 |
| 37 | Liabilities excluding financial derivatives | 38,569.4 | 5,145.8 | 1,456.5 | 3,689.3 | 3,514.5 | 87.7 | 87.1 | 43,715.2 |
- n.i.e.
- Not included elsewhere
Financial-account transactions are as described for the financial account of the ITAs. Other changes are not transactions and consist of price changes and exchange rate changes, which are both types of revaluations, as well as changes in volume and valuation n.i.e.
Price changes reflect holding gains or losses that result from movements in the price of an asset or liability. Exchange-rate changes represent the holding gain or loss on foreign-currency-denominated assets and liabilities due to changes in the values of foreign currencies relative to the value of the U.S. dollar.
Changes in volume and valuation n.i.e. include changes in assets and liabilities that are not due to transactions, price changes, or exchange-rate changes or that cannot be separately identified. These changes include the entry or exit of assets and liabilities that are not due to transactions, such as the addition of new reporters or other changes to reporting panels in source data.
Table 11 summarizes the components of changes in position that are identified and presented for each functional category. For more detail than is presented in this summary, see U.S. International Economic Accounts: Concepts and Methods (chapters 23–27).
The remainder of this section discusses positions associated with each of the five functional categories: direct investment, portfolio investment, other investment, reserve assets, and financial derivatives other than reserves.
| U.S. assets | U.S. liabilities | |||||||
|---|---|---|---|---|---|---|---|---|
| Other changes in position | Other changes in position | |||||||
| Type of investment | Total | Price changes | Exchange-rate changes |
Changes in volume and valuation n.i.e. |
Total | Price changes | Exchange-rate changes |
Changes in volume and valuation n.i.e. |
| By functional category: | ||||||||
| Direct investment at market value |  |
|
|
|
|
|
..... | |
| Equity | |
|
|
|
|
|
..... | |
| Debt instruments | |
..... | ..... | |
|
..... | ..... | |
| Portfolio investment | |
|
|
|
|
|
|
|
| Equity and investment fund shares | |
|
|
|
|
|
0 | |
| Debt securities | |
|
|
|
|
|
|
|
| Short term | |
..... | |
|
|
..... | |
|
| Treasury bills and certificates | ..... | ..... | ..... | ..... | |
..... | ..... | |
| Other short-term securities | ..... | ..... | ..... | ..... | |
..... | |
|
| Long term | |
|
|
|
|
|
|
|
| Treasury bonds and notes | ..... | ..... | ..... | ..... | |
|
..... | |
| Other long-term securities | ..... | ..... | ..... | ..... | |
|
|
|
| Financial derivatives other than reserves | n.a. | n.a. | n.a. | n.a. | n.a. | n.a. | n.a. | n.a. |
| Other investment | |
0 | |
|
|
..... | |
|
| Other equity | 0 | 0 | ..... | 0 | n.a. | n.a. | n.a. | n.a. |
| Currency and deposits | |
..... | |
|
|
..... | |
|
| Loans | |
..... | |
|
|
..... | |
|
| Insurance technical reserves | n.a. | n.a. | n.a. | n.a. | n.a. | n.a. | n.a. | n.a. |
| Trade credit and advances | |
..... | |
|
|
..... | |
|
| Special drawing rights allocations | ..... | ..... | ..... | ..... | |
..... | |
0 |
| Reserve assets | |
|
|
|
..... | ..... | ..... | ..... |
| Monetary gold | |
|
..... | |
..... | ..... | ..... | ..... |
| Special drawing rights | |
..... | |
0 | ..... | ..... | ..... | ..... |
| Reserve position in the IMF | |
..... | |
0 | ..... | ..... | ..... | ..... |
| Other reserve assets | |
|
|
0 | ..... | ..... | ..... | ..... |
| Currency and deposits | |
..... | |
|
..... | ..... | ..... | ..... |
| Securities | |
|
|
|
..... | ..... | ..... | ..... |
| Financial derivatives | ..... | ..... | ..... | ..... | ..... | ..... | ..... | ..... |
| Other claims | |
..... | |
|
..... | ..... | ..... | ..... |
- Measured and separately identified
- .....
- Not applicable
- 0
- Changes are possible but have not been observed.
- n.a.
- Not available
- m.i.e.
- Not included elsewhere
- Assets in financial derivatives other than reserves are contracts with gross positive fair values; liabilities are contracts with gross negative fair values. Price changes, exchange rate changes, and changes in volume and valuation for financial derivatives are not available. Financial transactions and other changes in financial derivatives positions are available only on a net basis.
Direct investment
Direct investment positions represent the accumulated stock of investment between entities in a direct investment relationship. For both assets and liabilities, the major published components of direct investment positions are equity and debt instruments. Parents' equity in affiliates is composed of parents' holdings of capital stock in, and other capital contributions to, their affiliates and parents' equity in the retained earnings of their affiliates. Debt positions, often referred to as intercompany debt, comprise parents' and affiliates' claims and liabilities in trade accounts, trade notes receivable and payable, other current assets and liabilities, and long-term debt owed.
Direct investment is presented in IIP tables 1.1–1.3 on an asset/liability basis at market value. IIP table 2.1 presents the same positions as well as positions based on the directional principle and positions at historical cost (book value) and current cost. (See the box “Direct Investment: Asset/Liability Versus Directional Basis.”)
Alternative valuation bases
Historical cost, or book value, is the basis on which the direct investment data are collected on BEA surveys because it is the basis used for valuation in company accounting records and is, therefore, the most easily reportable.
Market value is the basis on which the direct investment statistics are featured in the main IIP Accounts tables 1.1–1.3. The market value estimates of the direct investment position revalue the equity portion of the position; the debt portion of the position is not revalued because it is assumed that there is no difference between market and book value for debt. For market value estimates of the direct investment position, parents' equity investment in their affiliates at historical cost is revalued based on general stock market indexes.
Current cost is the third valuation method used to present direct investment position statistics. The current-cost estimates of the direct investment position revalue parents' equity claims in their affiliates' tangible assets, including plant and equipment, land, and inventory stocks, from historical cost to current cost.32 The current-cost direct investment position is equal to the historical-cost position adjusted by the difference between the current-cost value of tangible assets and the historical-cost value of tangible assets.
Source data and methods
Historical cost, or book value, direct investment positions are largely based on data collected on BEA's direct investment surveys. Market value direct investment positions are revalued from historical cost based on stock market indexes from MSCI, Morgan Stanley World Index, and the S&P Dow Jones 500 U.S. stock market index. Current-cost direct investment positions are revalued from historical cost using ratios from a perpetual inventory model applied to domestic investment data, general price indexes, and ratios of current replacement cost to historical-cost values of U.S. inventory stocks.
Portfolio investment
Portfolio investment positions represent the accumulated stock of investment in debt or equities, excluding those included in direct investment or reserve assets. Portfolio investment positions are presented for two main components: (1) equity and investment fund shares and (2) debt securities. Debt securities are classified by maturity (short term and long term). For U.S. liabilities, short-term debt securities are further classified as U.S. Treasury bills and certificates and other short-term securities; long-term debt securities are further classified as U.S. Treasury bonds and notes and other long-term debt securities.
Portfolio investment is presented in IIP tables 1.1–1.3. Additionally, U.S. portfolio investment liabilities to foreign official agencies are presented in IIP table 3.1.
Source data and methods
The primary data source for portfolio investment positions is the Treasury Department TIC data. Other source data includes nongovernment sources such as DTCC, MSCI, S&P Dow Jones Indices, and ICE indexes. Positions are directly reported or projected from annual or benchmark surveys using quarterly changes from more frequent surveys.
Financial derivatives other than reserves
Positions in financial derivatives other than reserves consist of U.S. residents' contracts with nonresidents that are linked to underlying instruments. Contracts with positive fair values are classified as U.S. assets, and contracts with negative fair values are classified as U.S. liabilities.33 Statistics on positions in financial derivatives are published in IIP tables 1.1–1.3. Positions in financial derivatives other than reserves are identified for two main components in IIP tables 1.2 and 1.3 that correspond to two risk category classifications: over-the-counter contracts and exchange-traded contracts. Over-the-counter contracts are further broken down among three types of contracts: single-currency interest rate contracts, foreign exchange contracts, and other contracts.
Source data and methods
The primary data source for financial derivatives is the Treasury Department's TIC system. Positions are directly reported as gross positive or negative fair values in the TIC data.
Other investment
Other investment positions represent the accumulated investment positions between U.S. residents and nonresidents other than those included in direct investment, portfolio investment, reserve assets, and financial derivatives (other than reserve assets). As indicated in the discussion of other investment transactions in the financial account, other investment positions include positions in a wide variety of financial instruments that are usually, but not always, issued and held by financial institutions. The major published components include other equity, currency and deposits, loans, insurance technical reserves, and trade credit and advances. Other investment liabilities also include SDR allocations.
Other investment is presented in IIP tables 1.1–1.3. Additionally, U.S. other investment liabilities to foreign official agencies are presented in IIP table 3.1.
Source data and methods
Other investment positions include a variety of instruments and are based on the same set of data sources as financial-account transactions in other investment. The Treasury Department (TIC data, Monthly Treasury Statement, and the Foreign Credit Reporting System) is the main source for many components of other investment positions. Other data sources include the FRB, FRBNY, DOD, IMF, DTCC, foreign central banks, and the BIS. BEA's quarterly direct investment surveys are used to remove positions covered in direct investment that are included in the other investment source data.
Reserve assets
Reserve asset positions represent the stock of external assets that are readily available to, and controlled by, the U.S. monetary authorities for the purposes of meeting balance of payments funding needs, intervening in markets to affect the exchange rate, and for other purposes.
The major published components of the reserve assets position are monetary gold, SDRs, reserve position in the IMF, and other reserve assets. Reserve asset position statistics are presented in IIP tables 1.1–1.3.
Source data and methods
The primary data source for the reserve asset position is the Treasury Department. Other sources include the FRBNY and the IMF. Positions are based on direct reporting.
More information on the IIP Accounts
For a more indepth discussion of the methods and data sources used to compile the IIP Accounts, see U.S. International Economic Accounts: Concepts and Methods (chapters 22–27).
Release and revision cycle
The IIP Accounts are prepared and released quarterly and annually. Preliminary quarterly IIP Account statistics are released in March, June, September, and December, approximately 90 days after the end of the reference quarter. These statistics are revised the following quarter to incorporate new source data. Quarterly statistics are open for revision for at least the prior 3 years in annual updates released in June. Preliminary annual statistics are released in March, reflecting positions at the end of the fourth quarter of the previous year. These annual statistics are open for revision in subsequent annual updates.
Statistical releases for the IIP Accounts are accompanied by a quarterly news release and a Survey of Current Business article in the month following the release.
Overview and definitions
BEA's AMNE statistics are comprised of comprehensive and integrated information on multinational enterprises (MNEs) that are either based in, or operate affiliates in, the United States. AMNE statistics complement direct investment statistics on transactions and positions included in the ITAs and IIP Accounts by providing additional perspective, via a wide variety of measures on financial structure and operations, on the activities of U.S. entities involved in a direct investment relationship with a foreign entity.
BEA's AMNE statistics consist of two main sets of statistics: activities of U.S. MNEs (or outward AMNE) and activities of U.S. affiliates of foreign MNEs (or inward AMNE). Statistics on the activities of U.S. MNEs include statistics on all U.S. direct investors, or parents, and on the foreign business enterprises they own, which are referred to as their foreign affiliates. Statistics on the activities of U.S. affiliates of foreign MNEs are compiled for all foreign-owned U.S. businesses, referred to as U.S. affiliates. In both sets of AMNE statistics, a subset of affiliates in which the parent holds or controls a majority of the voting power, directly or indirectly, is featured in greater detail. The statistics on majority-owned foreign affiliates and majority-owned U.S. affiliates facilitate analysis of situations in which the direct investor or the ultimate owner controls and coordinates the global activities of affiliated businesses.
In addition to offering insights on the general operations of MNEs, the AMNE statistics complement the ITAs by providing a more complete picture of the international supply of services. Trade in services included in the ITAs records only direct transactions between residents and nonresidents; services delivered to foreign markets by affiliates of MNEs are not within the scope of the ITAs. However, services supplied through “commercial presence” is one of the four modes of supply identified in the General Agreement on Trade in Services (GATS), and many MNEs serve foreign markets through their affiliates.
In the outward AMNE statistics, measures of U.S.-parent operations are published by industry and measures of foreign-affiliate operations are presented by industry and by country.34 In the inward AMNE statistics, measures of U.S.-affiliate operations are presented by industry, by country of ultimate beneficial owner (UBO), and, for some series, by U.S. state or country of the immediate foreign investor, which is the first foreign parent outside the United States. AMNE statistics are available via a variety of table formats. Some tables present statistics for several related data items classified by industry or by country; others present a single data item cross-classified by industry and by country.
Majority-owned affiliates
As noted above, statistics are presented separately and in greater detail for the subset of affiliates that are owned more than 50 percent, directly or indirectly. Ownership above the 50 percent threshold is associated with a significant degree of control by the parent over the activities of the affiliate. In practice, majority-owned affiliates account for most of the value of both U.S. and foreign affiliate statistics. Table 12 presents key aggregates from the AMNE statistics featured in the annual releases for U.S. parents, majority-owned foreign affiliates, and majority-owned U.S. affiliates for 2018. These measures and others are discussed in more detail below.
| Total assets | Expenditures for property, plant, and equipment | Sales | Net income | Value added | Research and development performed | Compensation of employees | Number of employees | |
|---|---|---|---|---|---|---|---|---|
| Billions of dollars | Thousands | |||||||
| Activities of U.S. MNEs | ||||||||
| U.S. parents | 43,373.4 | 721.6 | 14,328.3 | 1,451.2 | 4,207.5 | 323.1 | 2,338.1 | 28,565.5 |
| Majority-owned foreign affiliates | 27,378.8 | 190.4 | 6,772.9 | 1,408.1 | 1,473.8 | 58.2 | 626.7 | 14,393.5 |
| Activities of U.S. affiliates of foreign MNEs | ||||||||
| Majority-owned U.S. affiliates | 14,755.5 | 277.4 | 4,893.2 | 169.1 | 1,121.2 | 66.9 | 645.3 | 7,808.1 |
- AMNE
- Activities of multinational enterprises
- MNEs
- Multinational enterprises
Key AMNE indicators
Balance sheets and income statements
Balance sheet and income statement statistics are collected and presented on the same basis as would be required for stockholders' reports, preferably according to U.S. Generally Accepted Accounting Principles.
One notable feature of affiliate balance sheet and income statement statistics, particularly for foreign affiliates, is that the aggregate statistics reflect cumulative balance sheets of each foreign affiliate. This feature allows for analysis of the complete financial structure of U.S. MNEs and highlights the complexity of MNE ownership structures. However, an affiliate's ownership in another affiliate (a “lower-tier affiliate”) is included as an asset in its balance sheet. Because many U.S. MNEs have complex ownership structures in which one foreign affiliate owns other affiliates, the assets of the lower-tier affiliates are counted at least twice in aggregate statistics on foreign affiliates' assets. BEA separately shows the value of equity investments in other foreign affiliates as a component of the aggregated balance sheet statistics, allowing users of the statistics to exclude these values for analytical purposes.35 Statistics covering the income statement are similarly affected.36 Balance sheet and income statistics for U.S. affiliates are also affected by complex organizational structures but to a lesser extent because there is much more consolidation in the U.S. affiliate survey reporting compared to foreign affiliates.
Sales by type and destination
Data used to compile MNE sales statistics are collected for various levels of disaggregation in the AMNE surveys. Sales are differentiated among three types: goods, services, and investment income. Goods are generally tangible economic outputs, and services are generally intangible. For finance and insurance companies, investment income is generated by a primary activity and is therefore included in sales.37 The sales-by-type statistics form the basis for statistics that more closely approximate measures of output: goods supplied, services supplied, and other sales.38 Sales are further disaggregated by affiliation (affiliated or unaffiliated) and by location (resident in the same country as the affiliate or not) of the customer.
Expenditures for property, plant, and equipment
Expenditures for property, plant, and equipment include expenditures for land, timber, mineral and like rights owned; structures; machinery, equipment, special tools, and other depreciable property; construction in progress; and capitalized and expensed tangible and intangible exploration and development costs. They exclude expenditures for other types of intangible assets (such as R&D expenditures), and expenditures on land held for resale.
Value added
Value added measures the value of goods and services produced by MNEs and represents the firm's direct contribution to gross domestic product in the United States (for U.S. parents and majority-owned U.S. affiliates) or abroad (for majority-owned foreign affiliates). Valued added is computed as the sum of costs incurred (except intermediate inputs) and profits earned in production.
Research and development
Research and development expenditures include R&D performed by the parent or the affiliate, whether for its own use or for use by others.
Taxes
Taxes include both income taxes (regardless of level of government) and taxes other than income and payroll taxes, also referred to as indirect taxes. Indirect taxes include sales taxes, value-added taxes, excise taxes, property taxes, import and export duties, license fees, and various other taxes, fines, and penalties.
Employment and employee compensation
Employment and employee compensation include full-time and part-time employees on the payroll, typically, at the end of the fiscal year.
U.S. trade in goods
Trade in goods in the AMNE statistics is defined in the same way as the goods trade data compiled by the Census Bureau, referred to as Census-basis trade in goods in the ITAs. However, differences in accounting records used by reporters on BEA surveys and customs records used for compiling Census-basis statistics can arise because of variation in timing, valuation, origin and destination, shipper, or product.
Source data and methods
Statistics on AMNEs are based almost entirely on data from BEA's benchmark and annual direct investment surveys. (For more on BEA's surveys, see the box “Summary of Major Data Sources.”)
More information on the statistics on AMNEs
For a more in-depth discussion of the methods and data sources used to compile the statistics on AMNEs, see U.S. International Economic Accounts: Concepts and Methods (chapter 28).
Release and revision cycle
Statistics on AMNEs are prepared and released annually. Preliminary statistics are released each August or November of the second year after the reference year and are revised once the following August or November. Releases of the AMNE statistics are accompanied by a news release and a Survey of Current Business article in the month following the release.
Other international economic accounts
BEA also compiles and presents related statistics that provide supplemental detail or cover related topics, including monthly trade in goods and services, international services, direct investment by country and industry, and new foreign direct investment in the United States.
Monthly trade in goods and services
The monthly trade in goods and services statistics are released jointly with the U.S. Census Bureau and cover statistics featured in two categories of the current account (trade in goods and trade in services) at a greater frequency than do the ITAs. The statistics presented in the monthly statistical and news releases are conceptually consistent with those in the ITAs.
International services
The international services statistics are a collection of statistics published annually that feature greater detail on selected categories from the ITAs (trade in services) and the AMNE statistics (services supplied through affiliates). The international services statistics provide a broad view of the international supply of services, which cover all four of the GATS modes of supply.39 The international services statistics are published in October and are featured in a Survey of Current Business article, but some of the component statistics are separately available earlier.40
Direct investment by country and industry
Statistics on direct investment by country and industry supplement the direct investment financial transactions and income statistics presented in the ITAs and the direct investment position statistics presented in the IIP Accounts by providing additional detail. Although the statistics are conceptually consistent with and based on the same source data as those presented in the core accounts, the valuation and presentations differ in the direct investment by country and industry tabulations.
Financial transactions and income in the direct investment by country and industry statistics are without current-cost adjustment because the adjustment is only available at the global level.41 Positions in direct investment by country and industry statistics are presented at historical cost, or book value, because the data underlying the direct investment by country and industry statistics are only available on that basis. Lastly, transactions and positions are presented on a directional basis rather than on an asset/liability basis because the directional basis is recommended for bilateral statistics in international guidelines BPM6 and BD4.
The detailed information on direct investment by country and industry consist of two sets of statistics: U.S. direct investment abroad (USDIA), or outward investment, and foreign direct investment in the United States (FDIUS), or inward investment.
New foreign direct investment in the United States
Statistics on new foreign direct investment in the United States provide information on the acquisition, establishment, and expansion of U.S. business enterprises by foreign direct investors. They allow for separate identification of greenfield investment. Greenfield investment includes establishments of new U.S. business enterprises by foreign investors and expansions of existing U.S. affiliates. These statistics complement and partly overlap other FDIUS statistics. Expenditures for new investments include the total cost of the new investment, regardless of whether the funds were obtained from domestic or foreign sources.42 The new investment statistics also present key measures on the finances and operations of the newly acquired, established, or expanded U.S. businesses, which overlap some of the items included in the AMNE statistics but highlight affiliates with new investment
Statistics in Common Among U.S. International Economic Accounts
The core accounts—the ITAs, IIP Accounts, and AMNE statistics—and the other related international statistics provide a comprehensive, integrated, and detailed picture of U.S. international economic activities. In addition to using consistent definitions and accounting principles, some accounts also share common underlying source data or common published components. Chart 2 presents an overview of statistics that connect the three core International Economic Accounts and the four sets of related statistics.
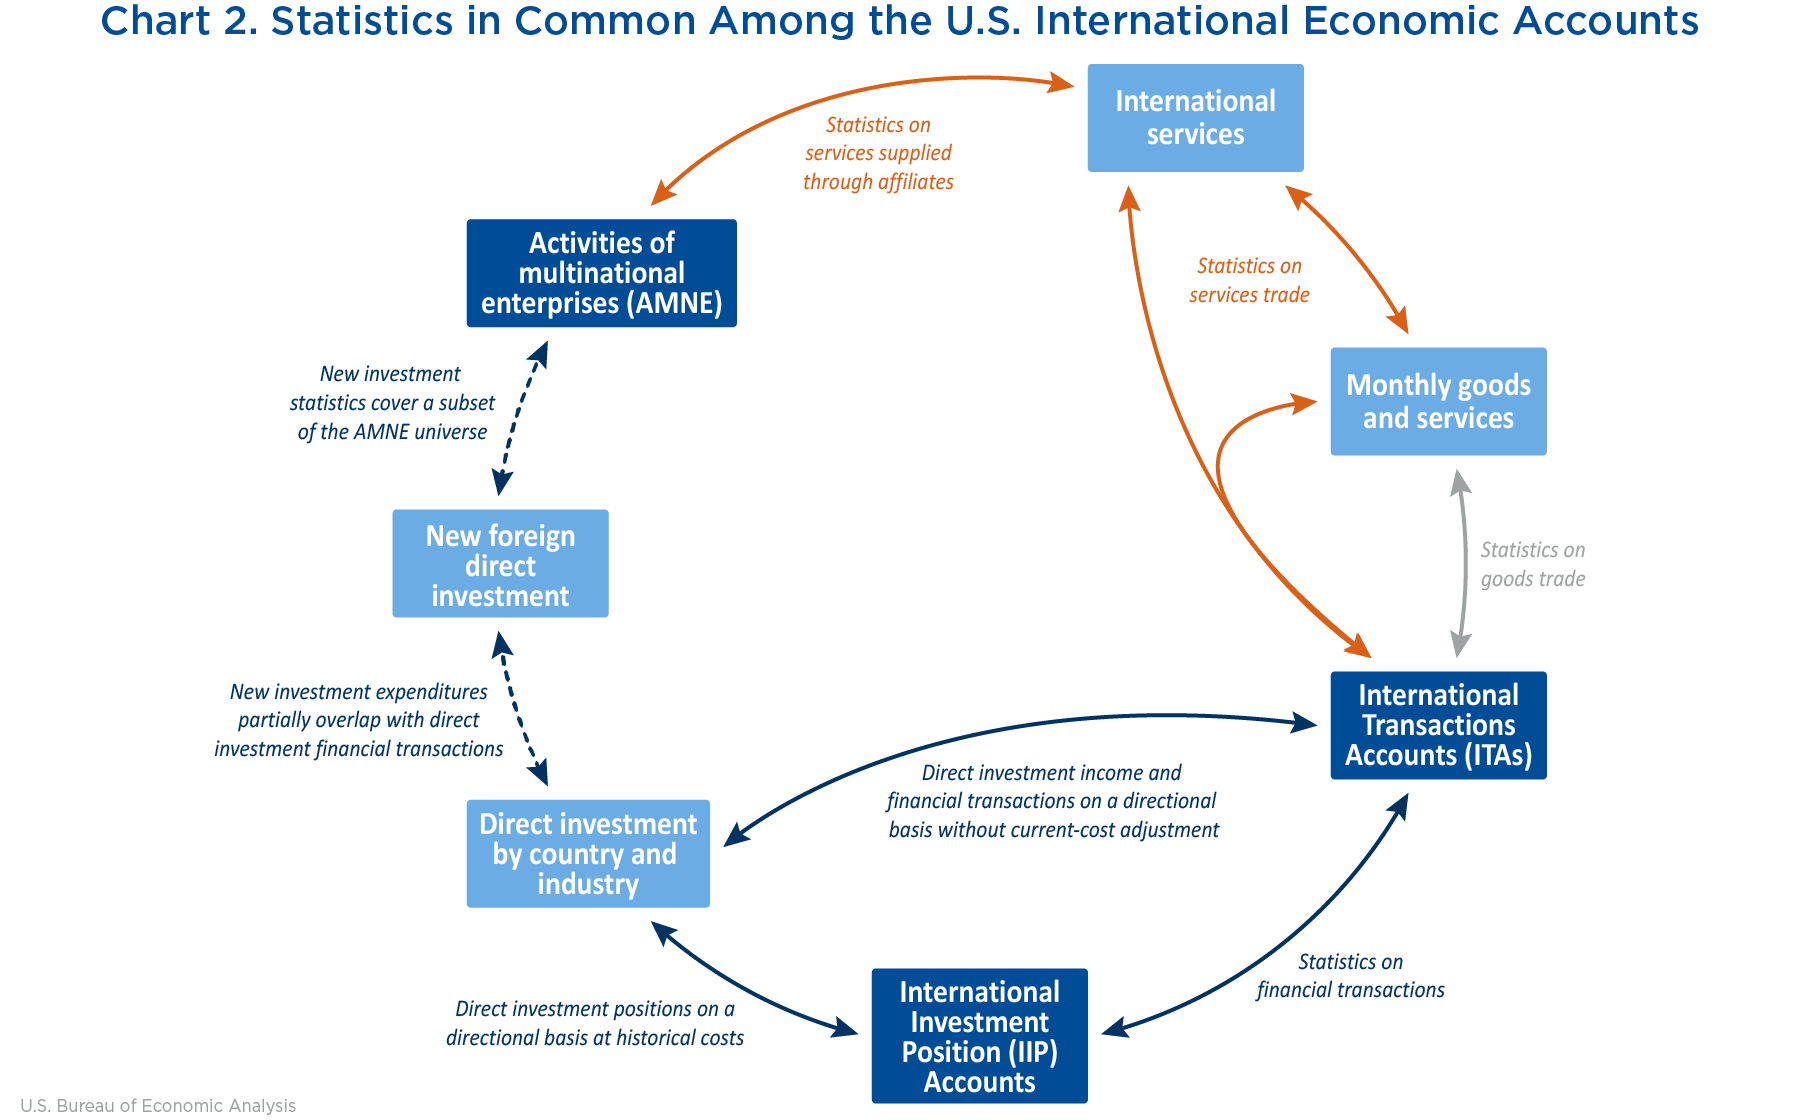
[Click chart to expand]
Relationship between the International Economic Accounts and the National Economic Accounts
In addition to informing the analysis of U.S. international transactions and positions specifically, statistics from the International Economic Accounts also serve as inputs to other accounts compiled and published by BEA, including the U.S. National Income and Product Accounts (NIPAs) and the Industry Economic Accounts, as well as national accounts produced by others, such as the Federal Reserve Board's Financial Accounts of the United States.43 Table 13 presents statistics from the ITAs that are inputs to the following items for the rest-of-the-world component of the NIPAs: exports and imports of goods and services, primary income, secondary income, current external balance, balance on the capital account, and net lending/net borrowing. For more information, see NIPA table 4.3B, which presents transactions with the rest of the world on an ITA basis and on a NIPA basis as well as the adjustments made to convert from one basis to the other. Adjustments are generally small because of the use of common concepts, definitions, and source data; the largest adjustments are for territorial coverage and for nonmonetary gold.44
| ITA series | Is the primary basis for… | NIPA series |
|---|---|---|
| Trade in goods, exports | Exports of goods | |
| Trade in services, exports | Exports of services | |
| Primary income receipts | Income receipts | |
| Secondary income receipts | Current taxes, contributions for government social insurance, and transfer receipts from the rest of the world | |
| Trade in goods, imports | Imports of goods | |
| Trade in services, imports | Imports of services | |
| Primary income payments | Income payments | |
| Secondary income payments | Current taxes and transfer payments to the rest of the world | |
| Balance on goods and services and primary income | Net exports of goods and services and net receipts of income |
- For information on the restructuring, see Jeffrey Bogen, Mai-Chi Hoang, Kristy Howell, and Erin Whitaker, “Comprehensive Restructuring and Annual Revision of the U.S. International Transactions Accounts,” Survey of Current Business 94 (July 2014).
- Principal Federal Economic Indicators are major statistical series designated by the Office of Management and Budget that describe the current condition of the U.S. economy.
- Net exports of goods under merchanting is a component of goods exports but not goods imports. The country importing goods under a merchanting scenario records the imported goods as general merchandise.
- Gold is considered monetary when it is owned by monetary authorities and held as a reserve asset.
- For both exports and imports in 2020, the net value of balance-of-payments adjustments was less than 1 percent of the value of the corresponding Census-basis trade value. The largest adjustments for both exports and imports were attributable to goods procured in air and sea ports, which reflect fuel purchases by air and sea carriers.
- Exceptions to product-based service categorization include travel, construction, and government goods and services n.i.e., which are transactor-based categories.
- Port services include (1) cargo handling, (2) storage and warehousing, and (3) other related transport services. Purchases of fuel in ports are excluded from transport and are instead included in trade in goods.
- BEA's measure of normal losses is computed via a multistep procedure that recognizes two types of losses (regularly occurring losses and catastrophic losses) rather than actual claims, which may be highly volatile.
- Other implicit services include brokerage services on bond transactions and dealer (market-maker) margins on transactions in financial securities. These services are included in brokerage and market-making services.
- Telecommunications services do not include the value of the information transmitted.
- When source data permits, services supplied by and to governments are classified to the particular service category associated with the transaction.
- No investment income accrues to financial derivatives; rather, any amounts that accrue under the contract are classified as revaluations.
- The existence of an employer-employee relationship is key to distinguishing compensation of employees from services trade.
- Because income on equity is related to current production, it excludes several items that may be included in income as typically recorded in financial accounting statements.
- ITA tables 1.1, 1.2, and 4.1 present statistics on an asset/liability basis and with current-cost adjustment.
- Because reserves are assets held by the U.S. monetary authorities, there are no liabilities associated with the functional category of reserves, and therefore, there are no payments of reserve asset income.
- Capital transfers are not included in secondary income; such transfers are included in the capital account.
- For example, transfers to foreign students are included only in U.S. payments, and personal transfers are separately identified in payments but not in receipts. Additionally, receipts for taxes on income, wealth, etc. are included in general government transfers because the recipient U.S. entity is in the government sector, but payments are included in private transfer payments because the U.S. entity making the payment is an individual or business enterprise.
- Current transfers (secondary income) reduce income and consumption possibilities of the donor country and increase income and consumption possibilities of the recipient country.
- Acquisitions and disposals of tangible assets include those rights related to mineral rights, electromagnetic spectrum, and offshore drilling. Acquisitions and disposals of intangible assets include those rights related to trademarks and franchises.
- Changes in the value of holdings of financial instruments attributable to price fluctuations or exchange-rate movements are not considered to be transactions, but such changes do contribute to changes in the international investment position. See the section “International Investment Position Accounts” for more information.
- One exception is monetary gold—gold bullion held in reserves by a monetary authority. This financial instrument does not give rise to a claim.
- The functional category financial derivatives other than reserves is not broken down by instrument.
- The 10-percent threshold used by BEA follows international statistical guidelines. Direct investment exists when a direct investor owns 10 percent or more of the voting power in an affiliate; furthermore, control exists when ownership exceeds 50 percent.
- Capital stock consists of all stock of affiliates, whether common or preferred, voting or nonvoting.
- Thus, reinvestment of earnings in the financial account is the offsetting entry to the reinvested earnings entry in direct investment income receipts or payments.
- Source data limitations do not yet permit a full breakout by maturity across every level of aggregation. ITA table 8.1 includes placeholder lines for all the maturity detail BEA intends to eventually publish. At this time, no detail by maturity is published for statistics by instrument in ITA table 8.1. However, some detail by maturity is available for statistics by sector of U.S. holder for the following assets: central bank deposits (short term) and general government loans (long term). Maturity detail is available by sector of U.S. issuer for the following liabilities: central bank deposits (short term), central bank currency (short term), and general government trade credit and advances (long term).
- U.S. currency represents a claim on the U.S. central bank. Therefore, there are no transactions in U.S. assets for this component.
- These deposits are excluded from U.S. reserve assets because they are held until the swap is reversed and are not available for other purposes.
- U.S. transactions in liabilities with foreign official agencies, which include central banks, treasuries, stabilization funds, exchange control offices, and other government exchange authorities, are separately identified and presented in ITA table 9.1.
- Measurement issues include statistical errors and omissions in recorded transactions due to overlaps or gaps in the coverage of independent statistical reporting systems, reporting errors by transactors, timing differences, and the use of indirect measures for transactions that cannot be directly measured. Note that the statistical discrepancy will not reflect all types of measurement issues. For example, if both sides of a transaction are absent from the statistical reporting systems, the statistical discrepancy would be unaffected, but the accounts would be affected.
- The estimates do not revalue mineral or other natural resource rights.
- The calculation of a derivative's fair value depends on the type of derivative, such as an option, swap, or future contract. The value of a derivative at a point in time may be determined based on the difference between the contractually agreed price for the underlying instrument and the prevailing market price for the instrument, appropriately discounted for remaining time in the contract.
- Industry classifications in the AMNE statistics are according to BEA's International Survey Industry classification system, which is based on the North American Industry Classification System.
- Excluding equity investment in affiliates would reduce the $27.4 billion in majority-owned foreign affiliate assets shown in table 12 to $18.9 billion.
- Excluding income attributable to equity investments in affiliates would reduce the $1.4 billion in majority-owned foreign affiliate net income shown in table 12 to $0.5 billion. Some other items in the AMNE statistics are not affected in the same way by complex ownership structures. For example, the statistics count each employee of a foreign affiliate and each dollar of R&D spending exactly once. BEA's statistics on direct investment transactions and positions are also not affected in the same way, because, for these statistics, only direct transactions and positions are included.
- For firms in other industries, investment income is not due to primary activity and is included in other income.
- See U.S. International Economic Accounts: Concepts and Methods, chapter 28, for details.
- The four modes of supply for international services delivery identified in GATS include three modes—(1) cross-border supply, (2) consumption abroad, and (4) presence of natural persons—that are covered in trade in services; mode (3), commercial presence, is covered by AMNE statistics on services supplied by affiliate to the market in which they are located.
- Detailed trade in services are available in June or July; part of services supplied are available in August as part of the AMNE statistical releases.
- In the ITAs, the featured measures of direct investment financial transactions and income typically include a current-cost adjustment.
- In the financial transactions statistics in the ITAs, only funds obtained from the foreign parent group are included.
- The National Economic Accounts and the International Economic Accounts are conceptually consistent because the national accounts follow the international guidelines of SNA 2008, which are aligned with standards for measuring international transactions in BPM6.
- In the ITAs, U.S. territories are treated as part of the United States and therefore transactions between those areas and the rest of the world are treated as international transactions. In contrast, in the NIPAs, U.S. territories are included in the 'rest of the world' because they are not covered in many of the federal data sources that form the basis for BEA's data on the domestic economy. Under this treatment, transactions between the rest of the United States and those areas are treated as foreign transactions, and transactions between residents of those areas and nonresidents are excluded from foreign transactions. However, BEA provides separate estimates on the economies of American Samoa, the Northern Mariana Islands, Guam, the U.S. Virgin Islands, and Puerto Rico. BEA's efforts to measure these economies have been supported by information provided by the territorial governments and by the Statistical Improvement Program funded by the Office of Insular Affairs of the U.S. Department of the Interior.The measures of trade in nonmonetary gold in the ITAs includes gold that has been previously extracted from the ground and refined; therefore, the NIPAs replace the ITA measures of trade in nonmonetary gold with an estimate that is more closely related to current production.