Accounting for Household Production in the National Accounts
An Update 1965–2020
The value of household production has been an issue of longstanding interest. The Bureau of Economic Analysis (BEA) publishes a satellite account that estimates the value of production by households (Landefeld and McCulla 2000; Landefeld, Fraumeni, and Vojtech 2009; Bridgman and others 2012; Bridgman 2016; Kanal and Kornegay 2019). This article updates these estimates for the years 2018 to 2020.
This period is particularly interesting because it includes the onset of the COVID-19 pandemic. The pandemic led to unprecedented changes to economic activity. One of its major features was that people spent more time at home. This raises the question of whether people increased household production, which is unpaid work done at home, such as cooking, cleaning, and child care.
We find that household production did increase significantly during 2020. This increase provided a partial buffer to the COVID-19 recession, reducing but not eliminating the decline in economic activity. This marks a major change, since household production had become less important relative to the market production measured by gross domestic product (GDP). We find that both the hours devoted to household production and the value of those hours increased.
Most of the change in hours is due to people moving from employment to nonemployment. People who do not work in the market do more household production, a force that is particularly strong for women. The COVID-19 recession had a notably strong negative impact on women's employment, in contrast to the previous recession that had a bigger impact on men's employment.
The pandemic did influence the relative importance of different activities within a demographic group (employment status by gender), even though total hours were flat. Activities that occur outside the home declined, but this was offset by some activities that occur within the home.
Surprisingly, child care did not increase much within demographic groups despite widespread closure of in-person schooling and daycare. The increase in home child care needs were met by women shifting from employment to nonemployment and an increase in secondary child care—looking after children while primarily performing a different activity. Secondary child care is omitted from the estimates, largely for practical reasons. However, the increase in secondary child care was relatively small. Omitting it does not change our main finding, that household production provided a partial buffer to the COVID-19 recession.
In the long-run trends, household production's size relative to market production has declined. Compared to 1965, household production is smaller relative to GDP despite the 2020 increase in its relative importance.
The onset of the pandemic led to a sharp decline in market activity with a related fall in employment. Household production could provide a buffer to the decline in market work because some of the hours that were used in market production could shift to household production. In this section, we investigate how much of a buffer household production provided during the COVID-19 recession.
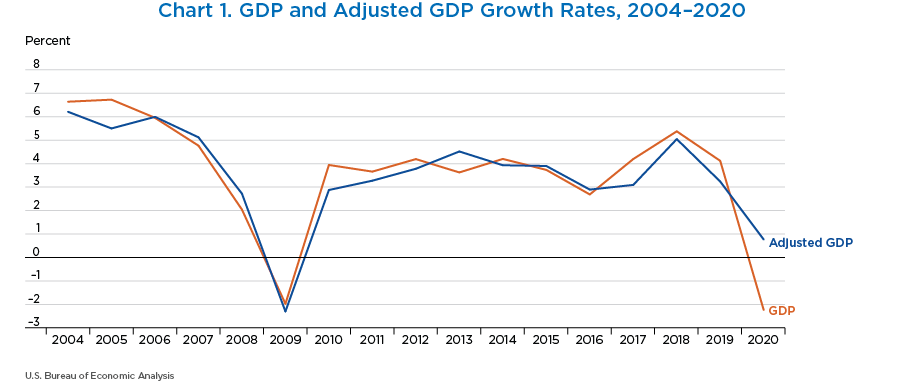
Chart 1 shows growth rate of nominal GDP and adjusted GDP (GDP plus household production) from 2004 to 2020. This period is when we have high-quality annual source data from the ATUS. It includes two recessions, the Great Recession in 2008–2009 and the COVID-19 recession in 2020. Both are significant events, with large declines in real GDP and employment.
Both recessions show up as noticeable declines in GDP. Adjusted GDP generally has the same growth rate as GDP. This is true during the Great Recession but not during the COVID-19 recession. While adjusted GDP growth slows, it does not show a large decline like GDP.
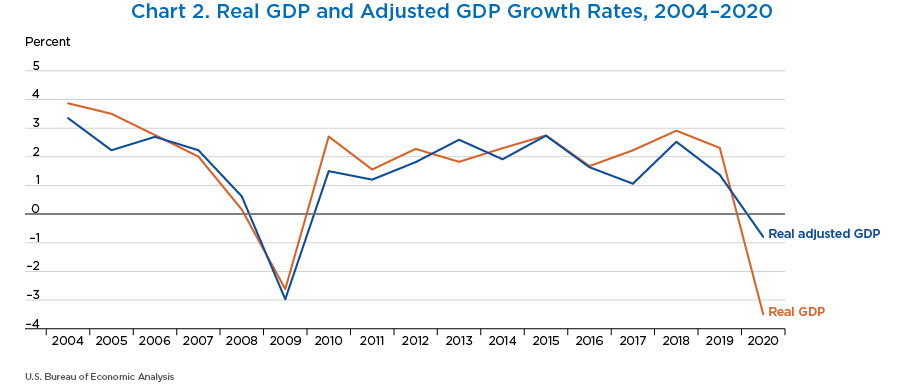
A concern with this comparison is that analysts use real, not nominal, GDP to measure the business cycle. This raises the possibility that the buffering effect is just due to price increases, not real economic activity. Unfortunately, we do not have a direct market equivalent to the household production price deflator. However, we can use the same principles we used to calculate nominal household production to get an estimate of real activity. Those principles imply that price change of household production is proportional to that of market substitutes (Bridgman 2015). We use the services GDP deflator to deflate household production. This series matches the available price indices for market substitutes to household activities, such as child care, closely. Since not all our activities have a published price index, we use the overall services price index.
Chart 2 shows that deflation mitigates but does not eliminate buffering effect. Services inflation was a bit higher than that of total GDP. Real adjusted GDP shows a slight decline in 2020, but this is much less than real GDP. The contrast with the Great Recession remains, as there is no buffering effect there in the deflated series.
The household sector buffered the recession but did not eliminate it. The adjusted GDP is still below the previous years' growth rate in 2020. This finding is consistent with the findings in Leukhina and Yu (2020), who also find limited buffering effects from household production.
The COVID-19 recession was different because both the total household hours and the valuation of those hours increased sharply. Total hours increased from 300 billion to 308 billion from 2019 to 2020. In contrast, total hours were flat during the Great Recession. The value of those hours increased during the COVID-19 recession, as the wage of household workers increased from $10.93 to $12.71 an hour. In contrast, household worker wages fell slightly during the Great Recession. We will discuss both these changes in more detail below.
In this section, we examine disaggregated time use to see why household hours increased during the COVID-19 recession but not the Great Recession. We find that most of the change is due to changes in employment status, while total household hours within a demographic group (employment status by gender) were nearly constant. The movement of women out of employment was the main driver. While total hours were nearly constant, activities shifted from those outside the home (like shopping and travel) to those inside the home (cooking and household chores).
Total hours
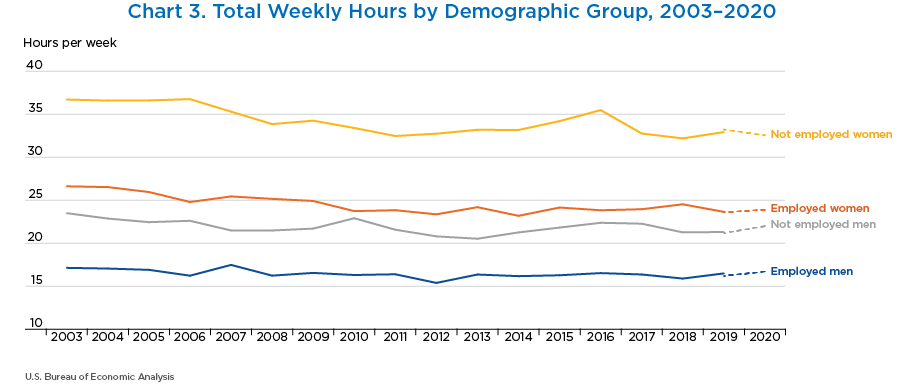
We begin by looking at total hours by demographic group. The time series plots show two series for each hours estimate. The solid line is the full-year estimate. We do not have such an estimate for 2020. However, BLS provides weights that allow us to compare household hours during the part of the year that was collected in 2020 with the same dates in 2019. The dashed series shows the average weekly hours using the partial-year weights.
Chart 3 shows total weekly household production hours by demographic group (employment status by gender). These data show several facts.
First, 2019 hours using the truncated year (omitting the dates that are missing from the 2020 data) gives very similar answers to the full year's data. This is evidence that our procedure to fill in the missing data is not significantly affected by changes in hours over the year (seasonality).
Second, there are not big changes in hours within the demographic groups. Men show a slight increase in time, but it is well within the historical range. These hours have been relatively stable in the past decade. Prior to 2010, there had been a decline in women's hours.
Total hours of household production increased even though hours within demographic groups were flat. This increase is the result of the differences in hours across groups and a significant shift to nonemployment during the COVID-19 recession.
Chart 3 shows there are significant differences across groups. Women, particularly not employed women, spend more time on household activities than men. Within each gender, not employed people perform more household production than employed people. This difference is larger for women than men. The gap between not employed and employed women is about 9 hours a week, much larger than the 5 hours for men. (See Kanal and Kornegay 2019 for a fuller treatment of the differences across demographic groups.)
Increases in nonemployment are common during recessions, and we did not see an increase in hours in the past. The Great Recession had a similar decrease in employment as that in the COVID-19 recession, but household hours did not show an increase. The big difference is who left employment. The employment rate of women fell 3 percentage points during 2020, compared to only 1 percentage point in the Great Recession. In contrast, men employment left employment at a greater rate during the Great Recession. Alon and others (2022) contrast the Great Recession, which they refer to as a “Mancession,” to the COVID-19 recession, which they call a “Shecession.”
Hours by activity
Total hours by demographic group show surprisingly little change during the COVID-19 recession. However, there are significant changes across activities. People have shifted their time from activities that occur outside the home to those that occur within the home. These two shifts offset each other, leaving total hours unchanged.
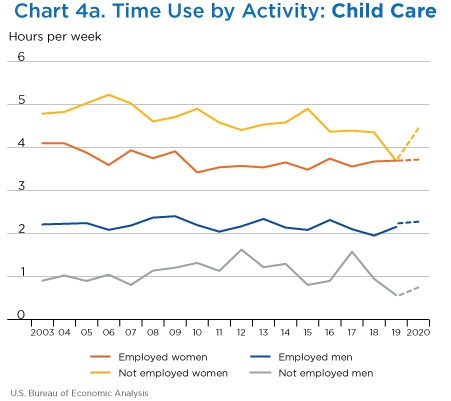
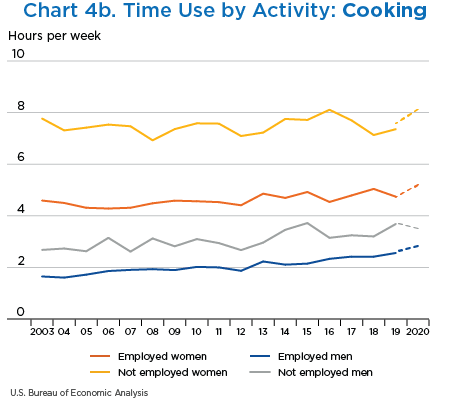
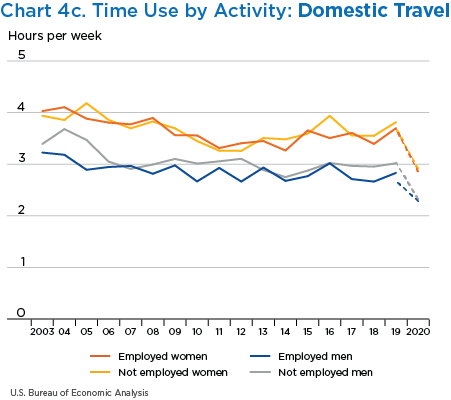
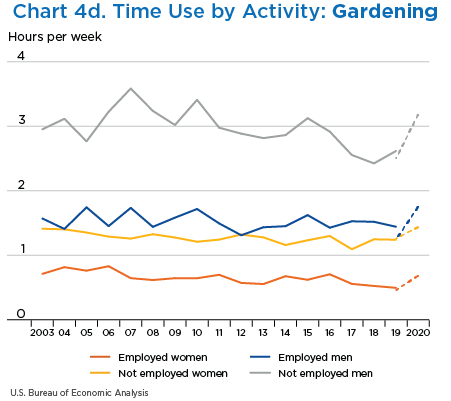
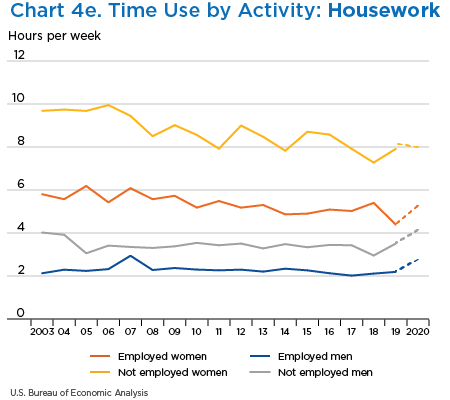
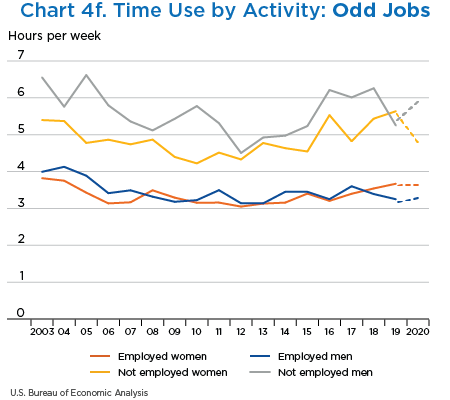
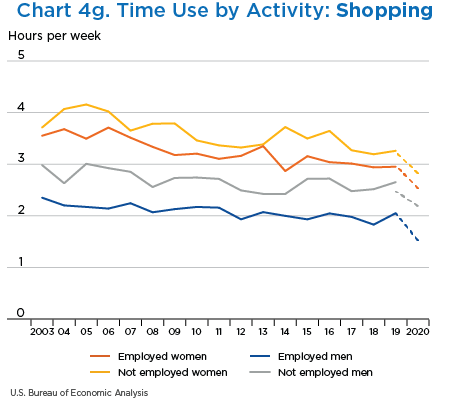
In this section, we examine total hours within a demographic group by the major activities. These activities are cooking, housework, odd jobs, gardening, shopping, child care, and domestic travel. The panels in Chart 4 report these data.
Two activities that are generally performed outside the home, domestic travel and shopping, show major declines. There is a sharp decline in weekly hours of shopping and domestic travel across all genders and employment statuses during the pandemic. It shouldn't come as a surprise that there is a sharp decline in this category across the board during the pandemic, as travel for any purpose was halted.
Three activities that occur at home—cooking, housework, and gardening—have increased. Being physically present in the home increased the opportunity to do these tasks. Also, COVID-19 led to restrictions on restaurants, so it is logical that people shifted away from meals eaten outside the home. While none of the increases in hours are very large relative to the pre-COVID-19 levels, they do add up. Cooking and housework were an important part of people's household production, so even modest increases in these categories matter.
The two remaining activities do not show a significant change: odd jobs and child care. While not employed women show an increase in child care hours, it only returns their time to what it was in 2018. Given the significant changes in child care during COVID-19, with the widespread closure of in-person teaching and daycare, we find this result surprising enough that we examine it in detail.
Child care during COVID-19
Before examining why child care within the demographic groups changed so little, we note that child care hours did increase due to reduced employment of women. Not employed women perform more than 2 additional hours of child care per week than employed women. Some have suggested that the two are linked, with the loss of market child care reducing women's employment (Alon and others 2020).
Turning to why child care did not increase within demographic categories substantially, we begin by noting that our estimates cover the entire economy, and most households do not have minor children present. According to the 2020 Annual Social and Economic Supplement of the Current Population Survey, 40 percent of households had children under 18. Only half of those (21 percent of total households) had children under 13, the ages that require the most direct child care. Many of those children were too young to attend school, so school closures may not have changed their parents' time use much.
Our estimates only include “primary” child care, times when child care is the main activity. There was an increase in “secondary” child care, looking after children while primarily performing another task. For example, a parent working from home while an infant naps would be counted as a market work, not household production. It is excluded for practical reasons, as our source data do not collect secondary child care in a consistent manner (Allard and others 2007). Further, it is unclear how to value this care. Secondary child care is being “on call” to perform child care as needed. Being on call to do an activity is usually paid less than doing that activity. It is not clear what discount we should use on secondary hours. See Folbre and Yoon (2007) for a fuller discussion of this issue.
While secondary child care hours increased, the increase is modest, even within the minority of households with young children. The ATUS asks whether a child under the age of 13 was under care while doing a non-child care activity. (Teenagers are presumed to not require active care when a parent is present.) Among households with such children, parents report that they increased secondary child care by an hour per day in May to December 2020 compared to the same period in 2019 (Bureau of Labor Statistics 2021).
While this is a notable increase, it is a relatively small increase compared to the 5 hours a day that these parents performed in 2019, especially considering the major changes in schooling. Further, other household production tasks were the primary activity for one-fifth of that increase so are already included in the estimates. If we were to include secondary child care, the level of household production would increase but the change to growth from 2019 to 2020 would be relatively small.
Summary
Looking at hours by activity within demographic groups, we see significant changes within household production that largely cancel out. Activities done in the home increased, but this was offset by falling hours in activities outside the home. Including secondary child care would increase the buffering impact of household production, but the effect is surprisingly modest. Shifts across demographic groups, particularly the shift of women out of employment, are the driving force behind the change in hours.
Another source of the increase in household production was an increase in the value of household hours, which are the most important factor of production. Household workers' wages, the market price we use to value household production hours, increased from $10.93 in 2019 to $12.71 in 2020. This wage increase shows up in other parts of the economy closely related to household services. For example, there is a similar increase in (non-household) child care worker wages. It also contrasts with the Great Recession, where household worker wages fell slightly. It is out of the scope of this article to explain why these wages increased so much, but they appear to be real increases rather than error due to disrupted data collection.
Under our methodology, this implies a big increase in the marginal value that people put on household production. There are some reasons to believe this is the case. More time in the home may make household services more valuable. The value of a clean house or someone to look after children may be higher if you spend more time there, so people may be more willing to pay more for household workers.
The methodology relies on the assumption that households can adjust their activity between the home and the market to equalize the marginal value of these activities. However, we know that markets were disrupted, so the marginal equalization of value may also be disrupted. This disruption could take two forms. It could be the case that people were willing to work for lower wages but were legally prevented by quarantine restrictions. In this case, the wage increase could be overstated. It could also be the case that people may want a different mix of market and nonmarket activity with COVID-19, and it takes time to shift to the new mix.
We acknowledge that the pandemic increases the uncertainty of the estimates, but we believe the buffering effect is not exclusively due to measurement issues related to disrupted markets. The most restrictive quarantine measures, such as stay-at-home orders, ended in most of the country by the summer of 2020. Therefore, household workers could be hired in most of the country for most of 2020. The pandemic started early in 2020, giving people time to change their mix of activities.
Up to this point, we have examined short-run, business cycle frequency trends. This section examines the long-run trends in household production. It extends the previous analysis of Kanal and Kornegay (2019), with new data to take us from 2017 to 2020.
Tables 1 and 2 break out the adjustments into categories for the years 1965 and 2020. Table 1 is separated into two sections, both containing new data for 2020 and rates of growth based on this new data. One uses National Income and Product Accounts (NIPA) measures, while the other uses measures from the Household Production Satellite Account. Under NIPA measures, the categories under services of consumer durables and nonmarket services are zero because they are not included in NIPA GDP. The estimates of these categories, which are part of our satellite account, are shown under the heading “Household Production Satellite Account measures.” These estimates lead to an increase in personal consumption expenditures. Note that these tables are nominal since we do not have price indices for the household production components. We do not want to add imprecision to the categorical breakout by using the stand-in price index we used above.
Table 2 contains data on the percentage share of GDP as defined by NIPA or household satellite account measures for various aggregate categories in both years. The first column contains the percentage growth of aggregate measures in the same year household production is included in GDP. The second column shows the relative impact on NIPA GDP when household production is included in the same year, where “impact” is defined as the increase in the aggregate measure upon the inclusion of household production divided by NIPA GDP. The third and fourth columns simply measure the aggregate share of GDP as defined by NIPA measures and household satellite account measures, respectively.
Personal investment is a new category that is created from adding investment in consumer durables from personal consumption expenditures and residential investment. Residential investment is categorized under gross business investment in the NIPAs. Reclassifying consumer durables as personal investment raises GDP because of the inclusion of a return on consumer investment. Moving residential investment under personal investment simply shifts it into a new category, but it doesn't change the measure. (See Bridgman and others 2012, for a fuller treatment of the differences between the NIPAs and satellite accounts.)
Including the household sector in GDP slows the growth rate of output. From 1965 to 2020, the average annual growth rate of nominal GDP was 6.3 percent. When household production is included, this growth rate drops to 6.1 percent. Household production has declined in significance over time as more women engage in market work. This sector accounted for 37 percent of the satellite account's output in 1965, but that declined to 25 percent in 2020 (table 2). The recent uptick in household production increased the relative size of the household sector. It was only 22 percent of the satellite accounts output in 2019. But it did not undo the longer-run decline in the relative importance of the sector. Note that the buffering effect documented above occurred despite the falling relative size of this sector.
| NIPA measures | Household production satellite account measures | |||||||
|---|---|---|---|---|---|---|---|---|
| 1965 | 2020 | Average annual rate of change | Contribution to GDP growth | 1965 | 2020 | Average annual rate of change | Contribution to GDP | |
| Billions of dollars | Percent | Billions of dollars | Percent | |||||
| (1) | (2) | (3) | (4) | (5) | (6) | (7) | (8) | |
| Gross domestic product | 742.3 | 20,893.7 | 6.3 | 100.0 | 1,019.7 | 26,210.6 | 6.1 | 100.0 |
| Personal consumption expenditures (PCE) and investment | 443.0 | 14,047.6 | 6.5 | 67.5 | 755.5 | 20,262.2 | 6.2 | 77.4 |
| PCE | 443.0 | 14,047.6 | 6.5 | 67.5 | 658.7 | 17,852.0 | 6.2 | 68.3 |
| Nondurables | 163.3 | 3,037.4 | 5.5 | 14.3 | 163.3 | 3,037.4 | 5.5 | 11.4 |
| Services | 213.3 | 9,393.7 | 7.1 | 45.6 | 490.7 | 14,710.5 | 6.4 | 56.4 |
| Housing | 76.6 | 2,668.1 | 6.7 | 12.9 | 76.6 | 2,668.1 | 6.7 | 10.3 |
| Services of consumer durables | 0.0 | 0.0 | n.a. | n.a. | 55.0 | 1,401.9 | 6.1 | 5.3 |
| Depreciation of consumer durables | 0.0 | 0.0 | n.a. | n.a. | 45.8 | 1,208.5 | 6.1 | 4.6 |
| Return to consumer durables | 0.0 | 0.0 | n.a. | n.a. | 9.2 | 193.4 | 5.7 | 0.7 |
| Nonmarket services | 0.0 | 0.0 | n.a. | n.a. | 222.4 | 3,914.9 | 5.4 | 14.7 |
| Other | 136.7 | 6,725.6 | 7.3 | 32.7 | 136.7 | 6,725.6 | 7.3 | 26.2 |
| Consumer durables1 | 66.4 | 1,616.4 | 6.0 | 7.7 | 4.7 | 104.0 | 5.8 | 0.4 |
| Investment | 0.0 | 0.0 | n.a. | n.a. | 96.9 | 2,410.2 | 6.0 | 9.2 |
| Residential | 0.0 | 0.0 | n.a. | n.a. | 35.2 | 897.8 | 6.1 | 3.4 |
| Consumer durables1 | 0.0 | 0.0 | n.a. | n.a. | 61.7 | 1,512.4 | 6.0 | 5.8 |
| Gross business investment | 129.6 | 3,637.8 | 6.2 | 17.4 | 94.5 | 2,740.0 | 6.3 | 10.5 |
| Nonresidential fixed investment | 85.2 | 2,799.6 | 6.6 | 13.5 | 85.2 | 2,799.6 | 6.6 | 10.8 |
| Change in business inventories | 9.2 | −59.6 | −203.4 | −0.3 | 9.2 | −59.6 | −203.4 | −0.3 |
| Residential | 35.2 | 897.8 | 6.1 | 4.3 | n.a. | n.a. | n.a. | n.a. |
| Net exports | 5.6 | −651.2 | −209.0 | −3.3 | 5.6 | −651.2 | −209.0 | −2.6 |
| Government consumption and investment | 164.1 | 3,859.5 | 5.9 | 18.3 | 164.1 | 3,859.5 | 5.9 | 14.7 |
| Other aggregates | ||||||||
| Labor income | 405.4 | 11,572.2 | 6.3 | 55.4 | 627.8 | 15,487.0 | 6.0 | 59.0 |
| Personal income | 570.7 | 19,627.6 | 6.6 | 94.6 | 848.0 | 24,944.4 | 6.3 | 95.7 |
| Personal savings | 58.8 | 2,887.5 | 7.3 | 14.0 | 74.7 | 3,191.4 | 7.1 | 12.4 |
| Private investment | 129.6 | 3,637.8 | 6.2 | 17.4 | 191.3 | 5,150.2 | 6.2 | 19.7 |
| Gross savings | 182.9 | 4,002.9 | 5.8 | 19.0 | 244.6 | 5,515.3 | 5.8 | 20.9 |
- n.a.
- Not applicable
- Under current NIPA methodology, a portion of expenditures on “other motor vehicles and parts” are allocated as maintenance expenditures and are not capitalized in the fixed assets accounts.
| Component increase from adjustment | Impact of adjustment on National Income and Product Accounts (NIPA) GDP | Component shares of NIPA GDP | Satellite components share of satellite GDP | |||||
|---|---|---|---|---|---|---|---|---|
| 1965 | 2020 | 1965 | 2020 | 1965 | 2020 | 1965 | 2020 | |
| (1) | (2) | (3) | (4) | (5) | (6) | (7) | (8) | |
| Gross domestic product | 37 | 25 | 37 | 25 | 100 | 100 | 100 | 100 |
| Personal consumption expenditures (PCE) and investment | 71 | 44 | 42 | 30 | n.a. | n.a. | 74 | 77 |
| PCE | 49 | 27 | 29 | 18 | 60 | 67 | 65 | 68 |
| Nondurables | 0 | 0 | 0 | 0 | 22 | 15 | 16 | 12 |
| Services | 130 | 57 | 37 | 25 | 29 | 45 | 48 | 56 |
| Housing | 0 | 0 | 0 | 0 | 10 | 13 | 8 | 10 |
| Services of consumer durables | n.a. | n.a. | 7 | 7 | n.a. | n.a. | 5 | 5 |
| Depreciation of consumer durables | n.a. | n.a. | 6 | 6 | n.a. | n.a. | 4 | 5 |
| Return to consumer durables | n.a. | n.a. | 1 | 1 | n.a. | n.a. | 1 | 1 |
| Nonmarket services | n.a. | n.a. | 30 | 19 | n.a. | n.a. | 22 | 15 |
| Other | 0 | 0 | 0 | 0 | 18 | 32 | 13 | 26 |
| Consumer durables1 | −7 | −6 | −8 | −8 | 9 | 8 | 0 | 0 |
| Investment | n.a. | n.a. | 13 | 12 | n.a. | n.a. | 9 | 9 |
| Residential | 0 | 0 | 5 | 4 | n.a. | n.a. | 3 | 3 |
| Consumer durables | 0 | 0 | 8 | 7 | n.a. | n.a. | 6 | 6 |
| Gross business investment1 | −27 | −25 | −5 | −4 | 17 | 17 | 9 | 10 |
| Nonresidential fixed investment | 0 | 0 | 0 | 0 | 11 | 13 | 8 | 11 |
| Change in business inventories | 0 | 0 | 0 | 0 | 1 | 0 | 1 | 0 |
| Residential1 | 0 | 0 | −5 | −4 | 5 | 4 | n.a. | n.a. |
| Net exports | 0 | 0 | 0 | 0 | 1 | −3 | 1 | −2 |
| Government consumption and investment | 0 | 0 | 0 | 0 | 22 | 18 | 16 | 15 |
| Other aggregates | ||||||||
| Household PCE and investment share of GDP | n.a. | n.a. | n.a. | n.a. | 60 | 67 | 74 | 77 |
| Private investment share of GDP | n.a. | n.a. | n.a. | n.a. | 17 | 17 | 19 | 20 |
| Household investment share of private investment | n.a. | n.a. | n.a. | n.a. | 0 | 0 | 51 | 47 |
| Nonmarket services and services of consumer durables share of PCE | n.a. | n.a. | n.a. | n.a. | 0 | 0 | 42 | 30 |
| Labor income share of national income (GDP) | n.a. | n.a. | n.a. | n.a. | 55 | 55 | 62 | 59 |
| Personal saving rate (percent of personal income) | n.a. | n.a. | n.a. | n.a. | 10 | 15 | 9 | 13 |
| Personal saving rate (percent of personal disposable income) | n.a. | n.a. | n.a. | n.a. | 11 | 8 | 14 | 9 |
| Personal saving as percent of GDP | n.a. | n.a. | n.a. | n.a. | 8 | 14 | 7 | 12 |
| National saving rate (gross savings percent of GDP) | n.a. | n.a. | n.a. | n.a. | 25 | 19 | 24 | 21 |
- n.a.
- Not applicable
- The apparent negative impacts of the adjustments are solely a result of the reclassification of residential and consumer durables.
The COVID-19 pandemic led to significant changes in many aspects of economic activity, including household production. Household production provided a buffer to the associated recession, a feature not seen in the previous recession. This buffer was due to an increase in household production hours and the value of those hours. Hours increased mostly due to women shifting out of employment, with little room for changes within demographic groups.
Allard, Mary Dorinda, Suzanne Bianchi, Jay Stewart, and Vanessa Wight. 2007. “Comparing Childcare Measures in the ATUS and Earlier Time-Diary Studies” Monthly Labor Review 130 (5): 27–36.
Alon, Titan, Matthias Doepke, Jane Olmstead-Rumsey, and Michèle Tertilt. 2020. “This Time It's Different: The Role of Women's Employment in a Pandemic Recession.” Working paper 27660. Cambridge, MA: National Bureau of Economic Research, August.
Alon, Titan, Sena Coskun, Matthias Doepke, David Koll, and Michèle Tertilt. 2022. “From Mancession to Shecession: Women's Employment in Regular and Pandemic Recessions.” In NBER Macroeconomics Annual 2021, Volume 36, edited by Martin S. Eichenbaum and Erik Hurst. Cambridge, MA: National Bureau of Economic Research.
Bridgman, Benjamin. 2015. “Home Productivity” Journal of Economic Dynamics and Control 71 (October 2016): 60–76.
Bridgman, Benjamin. 2016. “Accounting for Household Production in the National Accounts: An Update, 1965–2014.” Survey of Current Business 96 (February):1–5.
Bridgman, Benjamin, Andrew Dugan, Mikhael Lal, Matthew Osborne, and Shaunda Villones. 2012. “Accounting for Household Production in the National Accounts, 1965–2010.” Survey of Current Business 92 (May): 23–36.
Bureau of Labor Statistics. 2021. “American Time Use Survey–May to December 2019 and 2020 Results.” News release. Washington, DC: BLS, July 22.
Diewert, Erwin, and Paul Schreyer. 2014. “Household Production, Leisure and Living Standards.” In Measuring Economic Sustainability and Progress, edited by Dale W. Jorgenson, J. Steven Landefeld, and Paul Schreyer, 89–114. Cambridge, MA: National Bureau of Economic Research.
Folbre, Nancy, and Jayoung Yoon. 2007. “The Value of Unpaid Child Care in the U.S. in 2003.” In How Do We Spend Our Time? Recent Evidence from the American Time-Use Survey, edited by Jean Kimmel. Kalamazoo, MI: W. E. Upjohn Institute for Employment Research.
Kanal, Danit, and Joseph Ted Kornegay. 2019. “Accounting for Household Production in the National Accounts: An Update, 1965–2017.” Survey of Current Business 99 (June): 1–9.
Landefeld, J. Steven, Barbara Fraumeni, and Cindy M. Vojtech. 2009. “Accounting for Household Production: A Prototype Satellite Account Using the American Time Use Survey.” Review of Income and Wealth 55 (2): 205–225.
Landefeld, J. Steven, and Stephanie H. McCulla. 2000. “Accounting for Nonmarket Household Production Within a National Accounts Framework.” Review of Income and Wealth 46 (3): 289–307.
Leukhina, Oksana, and Zhixiu Yu. 2020. “Production and Leisure During the COVID-19 Recession.” Working Paper 020-025B. St. Louis, MO: Federal Reserve Bank of St. Louis.
U.N. Economic Commission for Europe. 2017. Guide on Valuing Unpaid Household Service Work. New York, NY: United Nations.
