
GDP and the Economy
Third Estimates for the Fourth Quarter of 2021
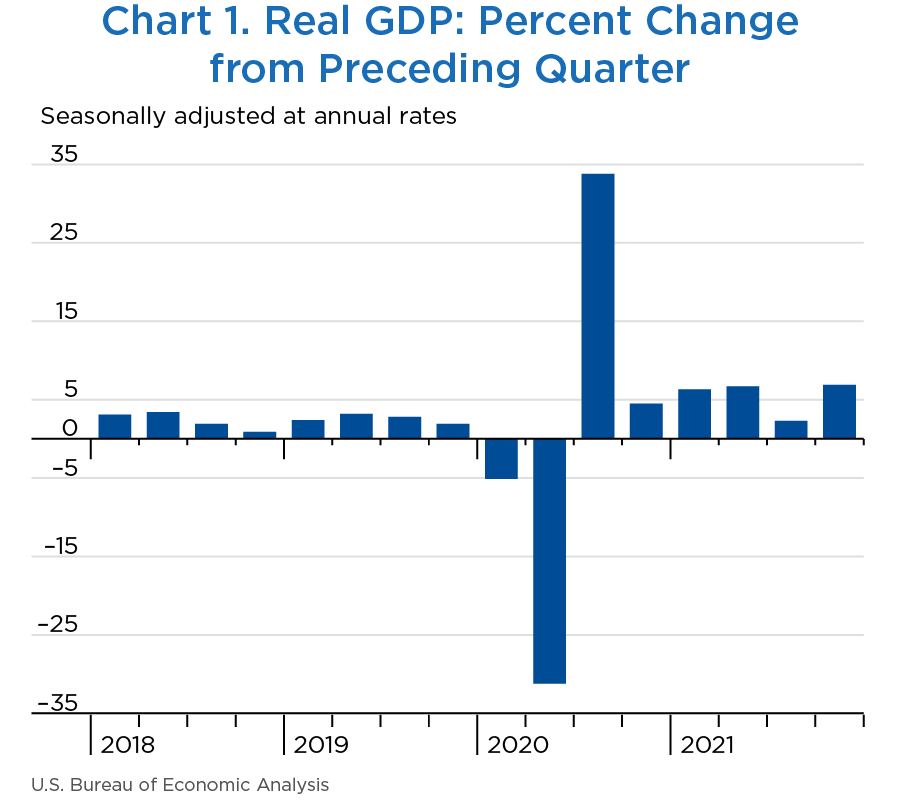
Real gross domestic product (GDP) increased at an annual rate of 6.9 percent in the fourth quarter of 2021, according to the third estimates of the National Income and Product Accounts (NIPAs) (chart 1 and table 1).1 With the third estimate, real GDP growth was revised down 0.1 percentage point from the second estimate issued last month. In the third quarter, real GDP increased 2.3 percent.
In 2021 (from the 2020 annual level to the 2021 annual level), real GDP increased 5.7 percent after decreasing 3.4 percent in 2020 (see “Real GDP, 2021”).
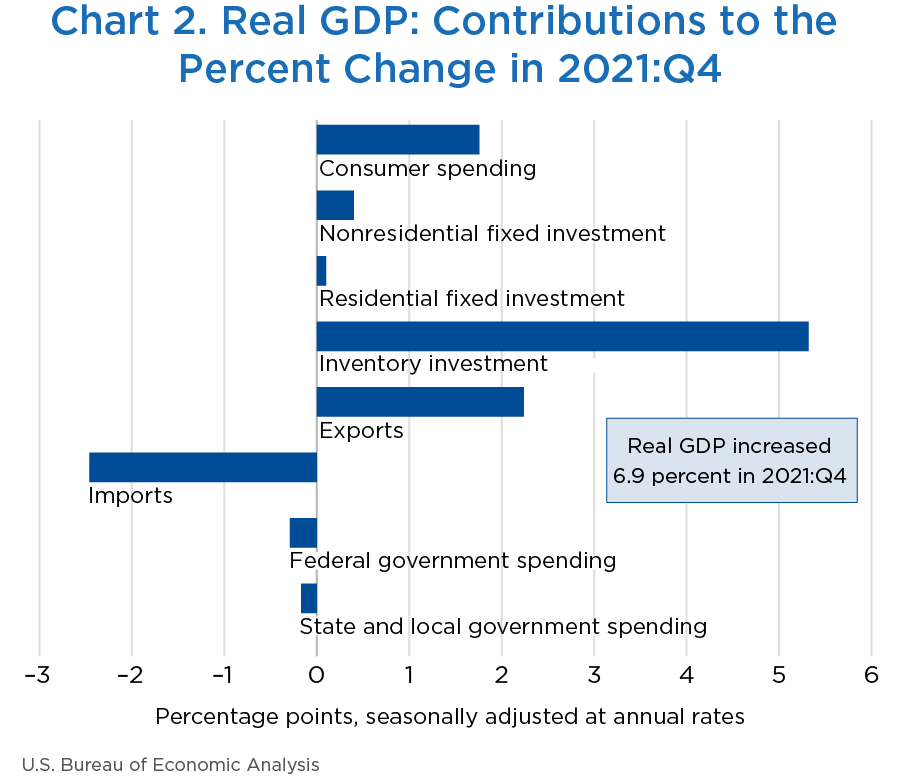
The increase in real GDP in the fourth quarter reflected increases in private inventory investment, exports, consumer spending, and nonresidential fixed investment that were partly offset by decreases in both federal and state and local government spending.2 Imports, which are a subtraction in the calculation of GDP, increased (chart 2 and table 1).
- The increase in private inventory investment was led by retail and wholesale trade industries. Within retail, inventory investment by motor vehicle dealers was the leading contributor.
- The increase in exports reflected increases in both goods and services. The increase in exports of goods was widespread, and the leading contributors were consumer goods; foods, feeds, and beverages; and industrial supplies and materials. The increase in exports of services was led by travel.
- The increase in consumer spending primarily reflected an increase in services, led by health care, financial services and insurance, and recreation services.
- The increase in nonresidential fixed investment primarily reflected an increase in intellectual property products that was partly offset by a decrease in structures.
- The decrease in federal government spending primarily reflected a decrease in defense spending on intermediate goods and services.
- The decrease in state and local government spending reflected a decrease in gross investment (led by new educational structures).
- The increase in imports primarily reflected an increase in goods (led by nonfood and nonautomotive consumer goods as well as capital goods).
Real GDP accelerated in the fourth quarter, increasing 6.9 percent after increasing 2.3 percent in the third quarter. The acceleration in real GDP primarily reflected an acceleration in private inventory investment, upturns in exports and in residential fixed investment, and an acceleration in consumer spending that were partly offset by a downturn in state and local government spending. Imports accelerated.
Real gross domestic income, which is the sum of incomes earned and costs incurred in the production of GDP, increased 5.1 percent in the fourth quarter after increasing 6.4 percent in the third quarter.
| Line | Series | Share of current-dollar GDP (percent) | Change from preceding period (percent) | Contribution to percent change in real GDP (percentage points) | ||||||
|---|---|---|---|---|---|---|---|---|---|---|
| 2021 | 2021 | 2021 | ||||||||
| Q4 | Q1 | Q2 | Q3 | Q4 | Q1 | Q2 | Q3 | Q4 | ||
| 1 | Gross domestic product (GDP)1 | 100.0 | 6.3 | 6.7 | 2.3 | 6.9 | 6.3 | 6.7 | 2.3 | 6.9 |
| 2 | Personal consumption expenditures | 68.0 | 11.4 | 12.0 | 2.0 | 2.5 | 7.44 | 7.92 | 1.35 | 1.76 |
| 3 | Goods | 23.5 | 27.4 | 13.0 | −8.8 | 1.1 | 5.69 | 2.99 | −2.21 | 0.28 |
| 4 | Durable goods | 8.6 | 50.0 | 11.6 | −24.6 | 2.5 | 3.50 | 1.01 | −2.52 | 0.22 |
| 5 | Nondurable goods | 15.0 | 15.9 | 13.9 | 2.0 | 0.4 | 2.19 | 1.98 | 0.30 | 0.06 |
| 6 | Services | 44.4 | 3.9 | 11.5 | 8.2 | 3.3 | 1.75 | 4.93 | 3.57 | 1.48 |
| 7 | Gross private domestic investment | 18.9 | −2.3 | −3.9 | 12.4 | 36.7 | −0.37 | −0.65 | 2.05 | 5.82 |
| 8 | Fixed investment | 17.8 | 13.0 | 3.3 | −0.9 | 2.7 | 2.25 | 0.61 | −0.16 | 0.50 |
| 9 | Nonresidential | 13.1 | 12.9 | 9.2 | 1.7 | 2.9 | 1.65 | 1.21 | 0.22 | 0.40 |
| 10 | Structures | 2.5 | 5.4 | −3.0 | −4.1 | −8.3 | 0.14 | −0.08 | −0.11 | −0.22 |
| 11 | Equipment | 5.4 | 14.1 | 12.1 | −2.3 | 2.8 | 0.75 | 0.66 | −0.13 | 0.17 |
| 12 | Intellectual property products | 5.2 | 15.6 | 12.5 | 9.1 | 8.9 | 0.76 | 0.62 | 0.46 | 0.45 |
| 13 | Residential | 4.7 | 13.3 | −11.7 | −7.7 | 2.2 | 0.60 | −0.60 | −0.38 | 0.10 |
| 14 | Change in private inventories | 1.0 | --- | --- | --- | --- | −2.62 | −1.26 | 2.20 | 5.32 |
| 15 | Net exports of goods and services | −4.0 | --- | --- | --- | --- | −1.56 | −0.18 | −1.26 | −0.23 |
| 16 | Exports | 11.1 | −2.9 | 7.6 | −5.3 | 22.4 | −0.30 | 0.80 | −0.59 | 2.24 |
| 17 | Goods | 7.8 | −1.4 | 6.4 | −5.0 | 23.4 | −0.10 | 0.48 | −0.39 | 1.64 |
| 18 | Services | 3.2 | −6.0 | 10.4 | −5.9 | 19.9 | −0.20 | 0.32 | −0.19 | 0.59 |
| 19 | Imports | 15.1 | 9.3 | 7.1 | 4.7 | 17.9 | −1.26 | −0.99 | −0.68 | −2.46 |
| 20 | Goods | 12.6 | 10.6 | 4.3 | −0.3 | 18.9 | −1.21 | −0.51 | 0.04 | −2.16 |
| 21 | Services | 2.5 | 2.2 | 23.6 | 35.0 | 13.1 | −0.05 | −0.48 | −0.72 | −0.31 |
| 22 | Government consumption expenditures and gross investment | 17.2 | 4.2 | −2.0 | 0.9 | −2.6 | 0.77 | −0.36 | 0.17 | −0.46 |
| 23 | Federal | 6.5 | 11.3 | −5.3 | −5.1 | −4.3 | 0.78 | −0.38 | −0.35 | −0.29 |
| 24 | National defense | 3.8 | −5.8 | −1.1 | −1.7 | −6.0 | −0.25 | −0.04 | −0.07 | −0.24 |
| 25 | Nondefense | 2.7 | 40.8 | −10.7 | −9.5 | −2.0 | 1.02 | −0.34 | −0.29 | −0.05 |
| 26 | State and local | 10.7 | −0.1 | 0.2 | 4.9 | −1.6 | −0.01 | 0.02 | 0.52 | −0.17 |
| Addenda: | ||||||||||
| 27 | Gross domestic income (GDI)2 | --- | 6.3 | 4.3 | 6.4 | 5.1 | --- | --- | --- | --- |
| 28 | Average of GDP and GDI | --- | 6.3 | 5.5 | 4.3 | 6.0 | --- | --- | --- | --- |
| 29 | Final sales of domestic product | --- | 9.1 | 8.1 | 0.1 | 1.5 | --- | --- | --- | --- |
| 30 | Goods | 32.4 | 10.8 | 9.8 | 0.1 | 19.0 | 3.31 | 3.05 | 0.05 | 5.70 |
| 31 | Services | 59.0 | 4.2 | 7.9 | 4.7 | 2.4 | 2.52 | 4.62 | 2.77 | 1.44 |
| 32 | Structures | 8.7 | 5.0 | −10.0 | −5.8 | −2.9 | 0.45 | −0.94 | −0.52 | −0.25 |
- The GDP estimates under the contribution columns are also percent changes.
- GDI is deflated by the implicit price deflator for GDP.
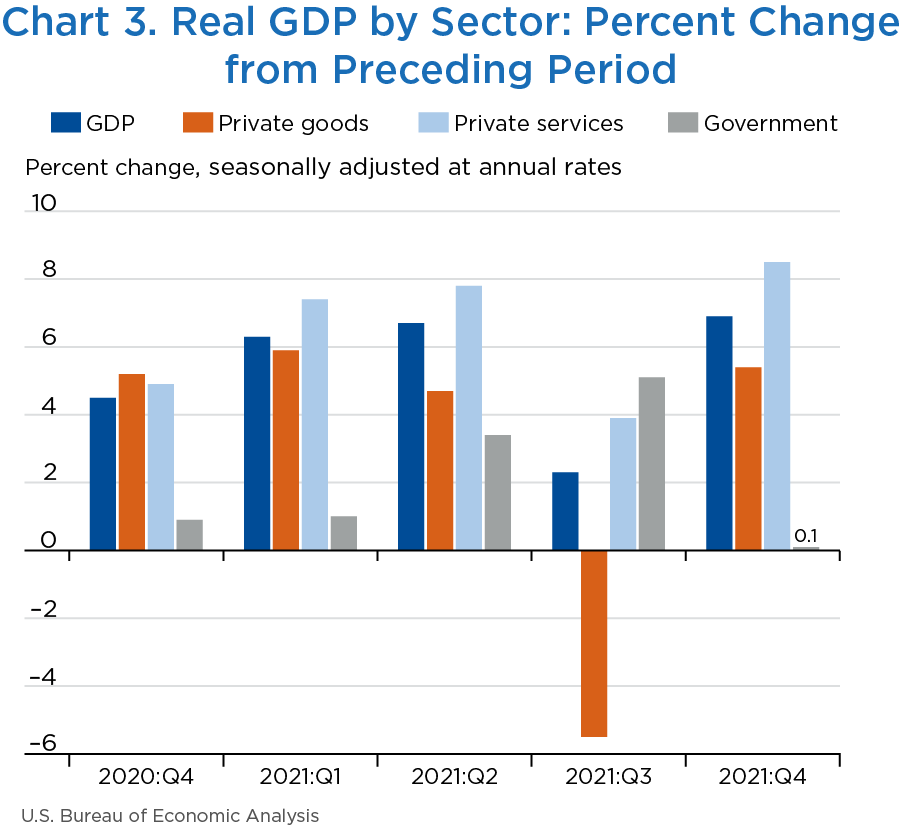
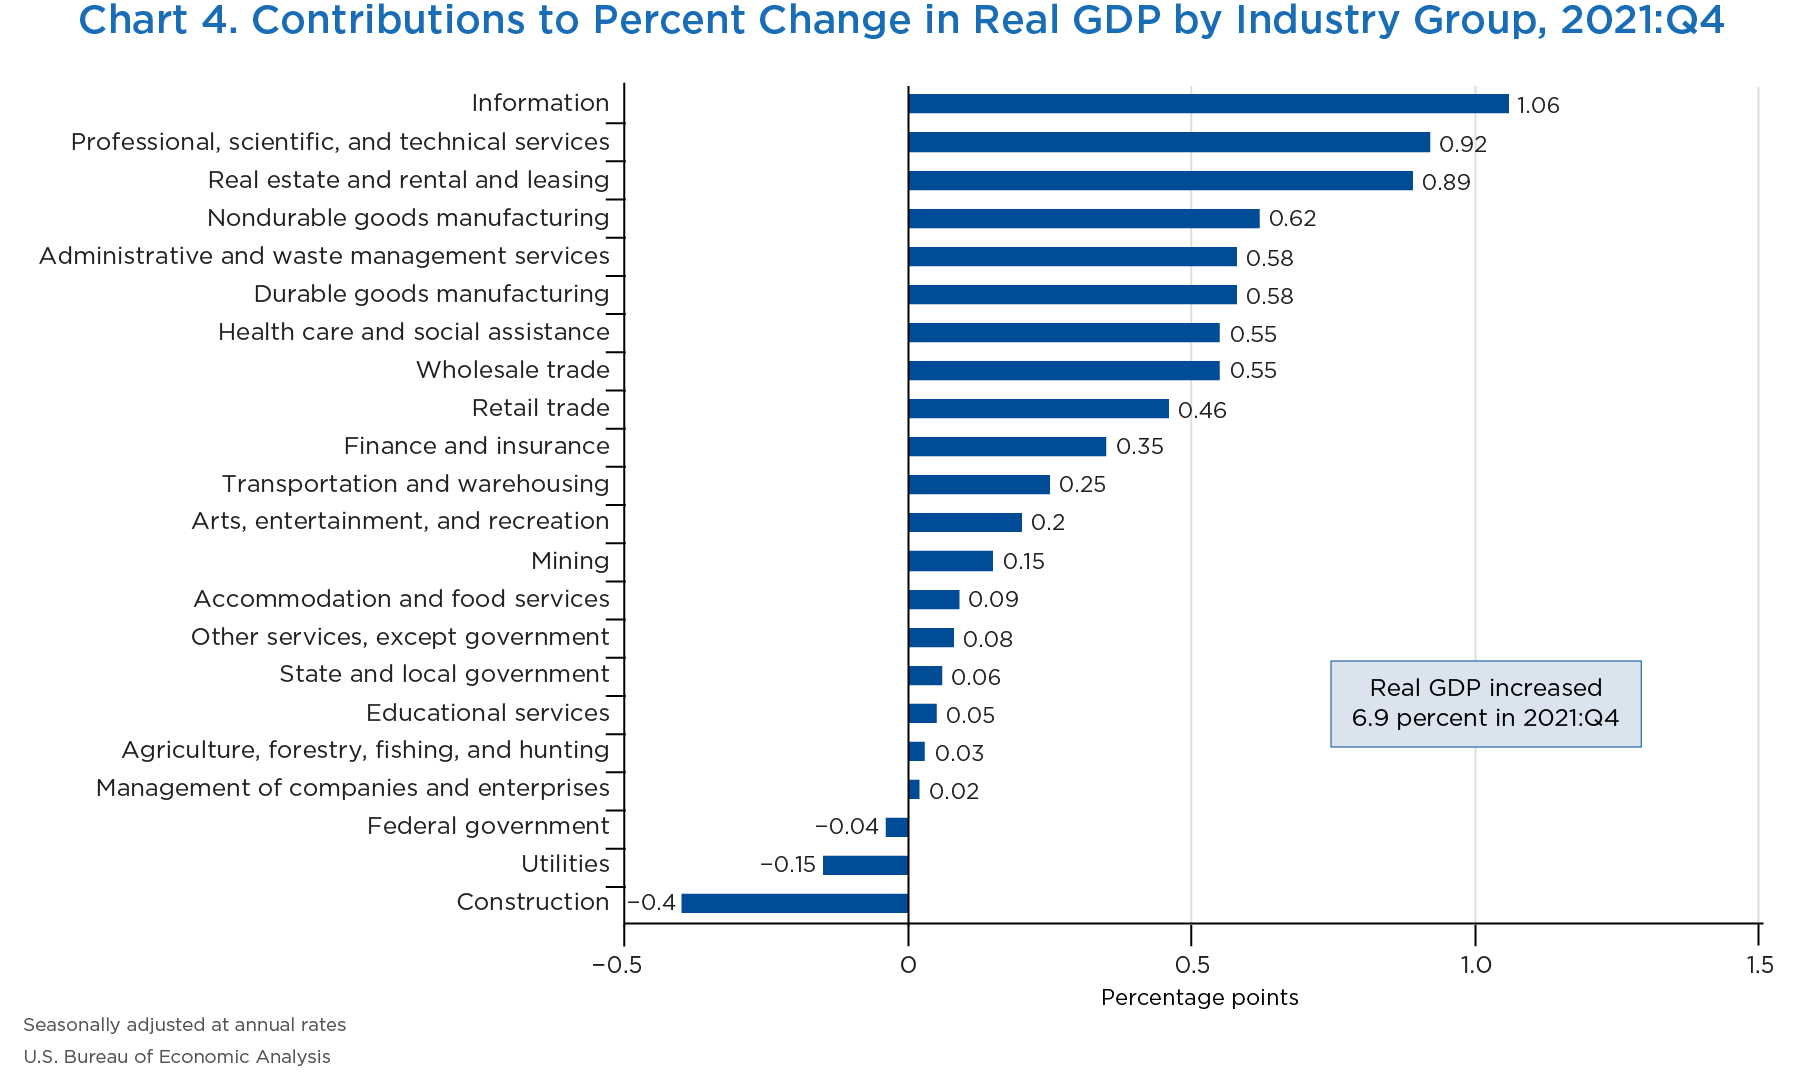
The third estimate of GDP includes estimates of GDP by industry, or value added—a measure of an industry's contribution to GDP. In the fourth quarter, private goods-producing industries increased 5.4 percent, private services-producing industries increased 8.5 percent, and government increased 0.1 percent (chart 3 and table 2). Overall, 19 of 22 industry groups contributed to the fourth-quarter increase in real GDP (chart 4).
- Within private goods-producing industries, the increase primarily reflected increases in nondurable goods (led by chemical products as well as food and beverage and tobacco products) and durable goods (led by motor vehicles, bodies and trailers, and parts) that were partly offset by a decrease in construction.
[Click chart to expand]
- Within private services-producing industries, the increase primarily reflected increases in information; professional, scientific, and technical services; real estate and rental and leasing (led by real estate); administrative and waste management services; health care and social assistance (led by ambulatory health care services); and wholesale trade. Partly offsetting these increases was a decrease in utilities.
- The increase in the government sector reflected an increase in state and local government that was partly offset by a decrease in federal government.
[Click chart to expand]
| Line | Series | Share of current-dollar GDP (percent) | Change from preceding period (percent) | Contribution to percent change in real GDP (percentage points) | ||||||
|---|---|---|---|---|---|---|---|---|---|---|
| 2021 | 2021 | 2021 | ||||||||
| Q4 | Q1 | Q2 | Q3 | Q4 | Q1 | Q2 | Q3 | Q4 | ||
| 1 | Gross domestic product (GDP)1 | 100.0 | 6.3 | 6.7 | 2.3 | 6.9 | 4.2 | 6.7 | 2.3 | 6.9 |
| 2 | Private industries | 88.2 | 7.1 | 7.1 | 1.9 | 7.9 | 6.18 | 6.26 | 1.70 | 6.90 |
| 3 | Agriculture, forestry, fishing, and hunting | 1.1 | −13.9 | −13.1 | −9.0 | 2.4 | −0.14 | −0.14 | −0.11 | 0.03 |
| 4 | Mining | 1.4 | −3.4 | 7.3 | −7.9 | 12.0 | −0.03 | 0.08 | −0.10 | 0.15 |
| 5 | Utilities | 1.7 | −8.5 | 3.8 | −16.1 | −8.6 | −0.15 | 0.06 | −0.29 | −0.15 |
| 6 | Construction | 4.1 | 5.9 | 6.6 | −13.9 | −9.4 | 0.25 | 0.28 | −0.62 | −0.40 |
| 7 | Manufacturing | 11.3 | 8.7 | 5.5 | −1.5 | 10.9 | 0.95 | 0.63 | −0.17 | 1.20 |
| 8 | Durable goods | 6.0 | 13.0 | 4.3 | −2.5 | 9.7 | 0.77 | 0.27 | −0.15 | 0.58 |
| 9 | Nondurable goods | 5.3 | 3.5 | 7.0 | −0.4 | 12.2 | 0.18 | 0.35 | −0.02 | 0.62 |
| 10 | Wholesale trade | 6.0 | 3.4 | 3.7 | −8.1 | 9.4 | 0.20 | 0.23 | −0.51 | 0.55 |
| 11 | Retail trade | 6.0 | 17.0 | −14.7 | −14.0 | 7.6 | 0.96 | −0.97 | −0.91 | 0.46 |
| 12 | Transporation and warehousing | 2.9 | 8.9 | −9.7 | 12.2 | 8.8 | 0.24 | −0.27 | 0.32 | 0.25 |
| 13 | Information | 5.7 | 14.7 | 25.2 | 8.0 | 20.1 | 0.79 | 1.30 | 0.44 | 1.06 |
| 14 | Finance, insurance, real estate, rental, and leasing | 20.9 | 6.1 | 4.3 | 4.4 | 5.9 | 1.32 | 0.93 | 0.92 | 1.24 |
| 15 | Finance and insurance | 8.3 | 7.4 | 3.4 | 7.8 | 4.1 | 0.64 | 0.30 | 0.64 | 0.35 |
| 16 | Real estate and rental and leasing | 12.6 | 5.2 | 4.9 | 2.2 | 7.1 | 0.68 | 0.63 | 0.28 | 0.89 |
| 17 | Professional and business services | 13.0 | 12.4 | 11.8 | 12.6 | 12.1 | 1.55 | 1.48 | 1.54 | 1.52 |
| 18 | Professional, scientific, and technical services | 7.8 | 10.0 | 15.3 | 12.3 | 12.3 | 0.76 | 1.13 | 0.90 | 0.92 |
| 19 | Management of companies and enterprises | 1.8 | 8.0 | 2.2 | 7.9 | 0.9 | 0.15 | 0.04 | 0.15 | 0.02 |
| 20 | Administrative and waste management services | 3.4 | 21.4 | 9.7 | 16.0 | 18.6 | 0.64 | 0.31 | 0.49 | 0.58 |
| 21 | Educational services, health care, and social assistance | 8.3 | −1.1 | 6.1 | 3.3 | 7.2 | −0.09 | 0.52 | 0.28 | 0.60 |
| 22 | Educational services | 1.1 | 8.1 | 9.2 | 8.4 | 4.4 | 0.09 | 0.10 | 0.09 | 0.05 |
| 23 | Health care and social assistance | 7.2 | −2.5 | 5.7 | 2.6 | 7.7 | −0.18 | 0.42 | 0.19 | 0.55 |
| 24 | Arts, entertainment, recreation, accommodation, and food services | 3.9 | 17.0 | 68.4 | 23.6 | 7.7 | 0.52 | 1.83 | 0.79 | 0.29 |
| 25 | Arts, entertainment, and recreation | 0.9 | 36.3 | 16.0 | 43.1 | 24.1 | 0.25 | 0.12 | 0.31 | 0.20 |
| 26 | Accommodation and food services | 3.0 | 11.4 | 88.7 | 18.4 | 3.1 | 0.27 | 1.70 | 0.49 | 0.09 |
| 27 | Other services, except government | 1.9 | −8.8 | 17.5 | 6.4 | 4.2 | −0.18 | 0.32 | 0.12 | 0.08 |
| 28 | Government | 11.8 | 1.0 | 3.4 | 5.1 | 0.1 | 0.12 | 0.42 | 0.60 | 0.01 |
| 29 | Federal | 3.7 | −0.4 | 0.5 | 0.3 | −1.2 | −0.01 | 0.02 | 0.01 | −0.04 |
| 30 | State and local | 8.1 | 1.6 | 4.8 | 7.4 | 0.7 | 0.14 | 0.40 | 0.59 | 0.06 |
| Addenda: | ||||||||||
| 31 | Private goods-producing industries2 | 17.9 | 5.9 | 4.7 | −5.5 | 5.4 | 1.03 | 0.84 | −1.00 | 0.98 |
| 32 | Private services-producing industries3 | 70.3 | 7.4 | 7.8 | 3.9 | 8.5 | 5.16 | 5.42 | 2.70 | 5.91 |
- The GDP estimates under the contribution columns are also percent changes.
- Consists of agriculture, forestry, fishing, and hunting; mining; construction; and manufacturing.
- Consists of utilities; wholesale trade; retail trade; transportation and warehousing; information; finance, insurance, real estate, rental, and leasing; professional and business services; educational services, health care, and social assistance; arts, entertainment, recreation, accommodation, and food services; and other services, except government.
Note. Percent changes are from these GDP by industry tables: “Value Added by Industry as a Percentage of Gross Domestic Product,” “Percent Changes in Chain-Type Quantity Indexes for Value Added by Industry,” and “Contributions to Percent Change in Real Gross Domestic Product by Industry.”
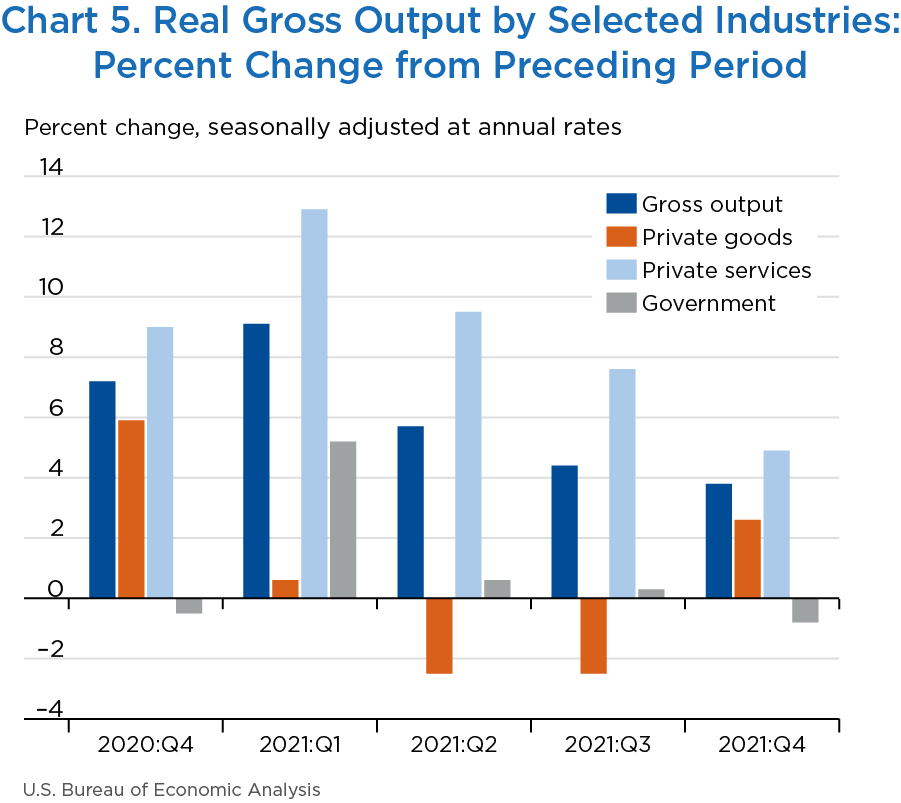
Real gross output—principally a measure of an industry’s sales or receipts, which includes sales to final users in the economy (GDP) and sales to other industries (intermediate inputs)—increased 3.8 percent in the fourth quarter (chart 5 and table 3). An increase of 4.9 percent for private services-producing industries and an increase of 2.6 percent for private goods-producing industries were partly offset by a decrease of 0.8 percent for government. Overall, 15 of 22 industry groups contributed to the increase in real gross output.
[Click chart to expand]
| Line | Series | Change from preceding period (percent) | |||
|---|---|---|---|---|---|
| 2021 | |||||
| Q1 | Q2 | Q3 | Q4 | ||
| 1 | All industries | 9.1 | 5.7 | 4.4 | 3.8 |
| 2 | Private industries | 9.6 | 6.3 | 4.9 | 4.3 |
| 3 | Agriculture, forestry, fishing, and hunting | −5.5 | −4.1 | −3.6 | −1.1 |
| 4 | Mining | 4.1 | 13.7 | −0.1 | 6.6 |
| 5 | Utilities | 7.2 | 6.9 | −0.9 | −6.9 |
| 6 | Construction | 5.7 | −8.3 | −8.2 | −6.5 |
| 7 | Manufacturing | −0.7 | −1.7 | −0.9 | 5.4 |
| 8 | Durable goods | 3.2 | −2.1 | −1.7 | 8.2 |
| 9 | Nondurable goods | −4.7 | −1.3 | −0.2 | 2.7 |
| 10 | Wholesale trade | 10.9 | 9.7 | 0.2 | 8.7 |
| 11 | Retail trade | 28.8 | −4.4 | −11.5 | 2.5 |
| 12 | Transporation and warehousing | 20.2 | 4.3 | 19.7 | 15.1 |
| 13 | Information | 19.9 | 19.4 | 12.6 | 9.4 |
| 14 | Finance, insurance, real estate, rental, and leasing | 10.5 | 1.5 | 6.7 | 2.5 |
| 15 | Finance and insurance | 20.0 | −1.2 | 10.2 | −0.4 |
| 16 | Real estate and rental and leasing | 3.3 | 3.7 | 3.9 | 5.0 |
| 17 | Professional and business services | 14.5 | 9.2 | 13.1 | 7.4 |
| 18 | Professional, scientific, and technical services | 14.4 | 9.4 | 11.3 | 6.5 |
| 19 | Management of companies and enterprises | 2.6 | −0.5 | 9.2 | −4.2 |
| 20 | Administrative and waste management services | 22.3 | 14.3 | 19.0 | 15.6 |
| 21 | Educational services, health care, and social assistance | −4.1 | 9.9 | 4.1 | 3.9 |
| 22 | Educational services | 8.0 | 15.4 | 6.7 | 4.6 |
| 23 | Health care and social assistance | −5.6 | 9.2 | 3.8 | 3.8 |
| 24 | Arts, entertainment, recreation, accommodation, and food services | 41.1 | 81.4 | 36.9 | 0.8 |
| 25 | Arts, entertainment, and recreation | 76.4 | 25.3 | 64.8 | 9.0 |
| 26 | Accommodation and food services | 32.8 | 99.8 | 30.6 | −1.2 |
| 27 | Other services, except government | −4.8 | 20.1 | 3.5 | 2.0 |
| 28 | Government | 5.2 | 0.6 | 0.3 | −0.8 |
| 29 | Federal | 15.5 | −6.4 | −8.1 | −3.5 |
| 30 | State and local | 0.6 | 4.1 | 4.3 | 0.4 |
| Addenda: | |||||
| 31 | Private goods-producing industries1 | 0.6 | −2.5 | −2.5 | 2.6 |
| 32 | Private services-producing industries2 | 12.9 | 9.5 | 7.6 | 4.9 |
- Consists of agriculture, forestry, fishing and hunting; mining; construction; and manufacturing.
- Consists of utilities; wholesale trade; retail trade; transportation and warehousing; information; finance, insurance, real estate, rental, and leasing; professional and business services; educational services, health care, and social assistance; arts, entertainment, recreation, accommodation, and food services; and other services, except government.
Note. Percent changes are from the table Percent Changes in Chain-Type Quantity Indexes for Gross Output by Industry which is available through BEA's Interactive Data Application.
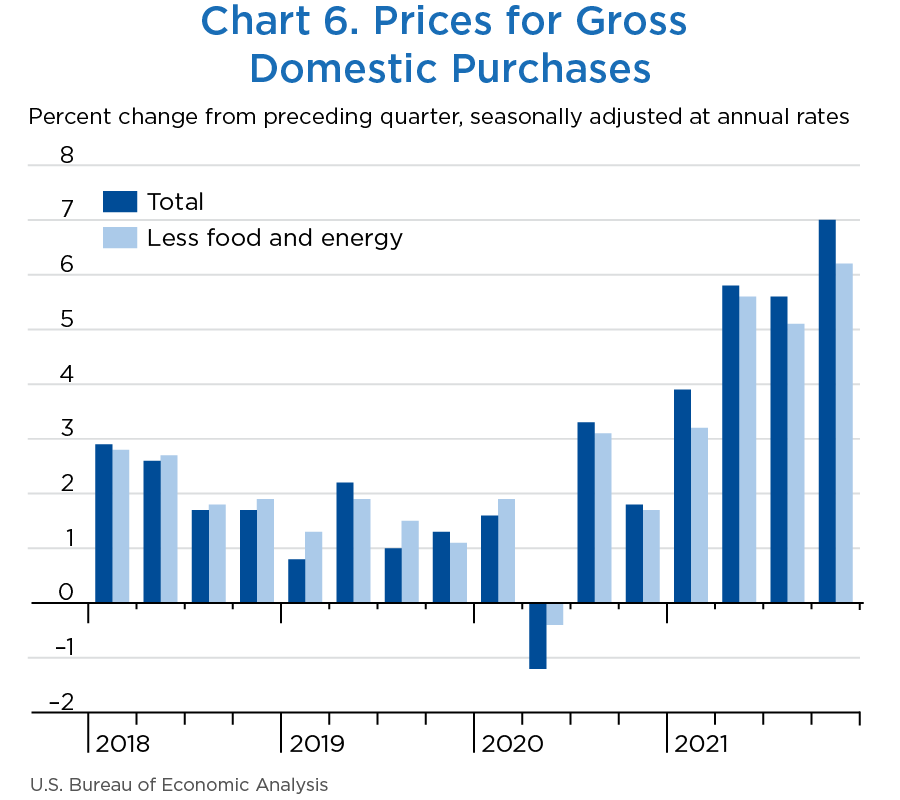
Prices for gross domestic purchases—goods and services purchased by U.S. residents—increased 7.0 percent in the fourth quarter after increasing 5.6 percent in the third quarter (table 4 and chart 6). The increase was the largest since the second quarter of 1981. Price increases were widespread across all subcomponents of gross domestic purchases, led by increases in the prices paid by consumers. The largest contributors to the increase were housing and utilities, motor vehicles and parts, and gasoline and other energy goods.
Food prices increased 9.0 percent in the fourth quarter after increasing 7.9 percent in the third quarter. Prices for energy goods and services increased 34.0 percent after increasing 19.4 percent. Gross domestic purchases prices excluding food and energy increased 6.2 percent after increasing 5.1 percent.
[Click chart to expand]
Consumer prices excluding food and energy, a measure of the “core” rate of inflation, increased 5.0 percent in the fourth quarter after increasing 4.6 percent in the third quarter.
| Line | Series | Change from preceding period (percent) | Contribution to percent change in gross domestic purchases prices (percentage points) | ||||||
|---|---|---|---|---|---|---|---|---|---|
| 2021 | 2021 | ||||||||
| Q1 | Q2 | Q3 | Q4 | Q1 | Q2 | Q3 | Q4 | ||
| 1 | Gross domestic purchases1 | 3.9 | 5.8 | 5.6 | 7.0 | 3.9 | 5.8 | 5.6 | 7.0 |
| 2 | Personal consumption expenditures | 3.8 | 6.5 | 5.3 | 6.4 | 2.51 | 4.23 | 3.54 | 4.19 |
| 3 | Goods | 5.9 | 9.3 | 7.3 | 10.2 | 1.29 | 2.11 | 1.67 | 2.27 |
| 4 | Durable goods | 2.3 | 16.8 | 9.7 | 10.8 | 0.19 | 1.38 | 0.81 | 0.88 |
| 5 | Nondurable goods | 8.0 | 5.0 | 5.9 | 9.8 | 1.10 | 0.73 | 0.86 | 1.39 |
| 6 | Services | 2.8 | 5.0 | 4.3 | 4.4 | 1.21 | 2.12 | 1.87 | 1.92 |
| 7 | Gross private domestic investment | 2.8 | 2.9 | 6.1 | 8.8 | 0.50 | 0.52 | 1.03 | 1.53 |
| 8 | Fixed investment | 3.7 | 4.5 | 7.0 | 8.9 | 0.64 | 0.80 | 1.20 | 1.51 |
| 9 | Nonresidential | 0.8 | 0.9 | 4.3 | 7.8 | 0.10 | 0.13 | 0.56 | 0.99 |
| 10 | Structures | 3.9 | 8.9 | 11.1 | 24.4 | 0.10 | 0.21 | 0.26 | 0.54 |
| 11 | Equipment | 2.2 | −3.2 | 4.6 | 6.9 | 0.12 | −0.16 | 0.25 | 0.37 |
| 12 | Intellectual property products | −2.3 | 1.5 | 0.9 | 1.6 | −0.12 | 0.08 | 0.05 | 0.08 |
| 13 | Residential | 12.4 | 15.3 | 14.8 | 11.9 | 0.54 | 0.67 | 0.64 | 0.52 |
| 14 | Change in private inventories | --- | --- | --- | --- | −0.14 | −0.28 | −0.17 | 0.02 |
| 15 | Government consumption expenditures and gross investment | 5.4 | 6.1 | 6.1 | 7.6 | 0.93 | 1.04 | 1.02 | 1.27 |
| 16 | Federal | 4.0 | 4.1 | 5.0 | 5.7 | 0.27 | 0.28 | 0.33 | 0.36 |
| 17 | National defense | 4.4 | 4.3 | 4.9 | 5.5 | 0.18 | 0.17 | 0.18 | 0.21 |
| 18 | Nondefense | 3.3 | 3.9 | 5.2 | 5.8 | 0.09 | 0.11 | 0.14 | 0.16 |
| 19 | State and local | 6.3 | 7.3 | 6.7 | 8.9 | 0.66 | 0.76 | 0.70 | 0.91 |
| Addenda: | |||||||||
| Gross domestic purchases: | |||||||||
| 20 | Food | −0.1 | 1.6 | 7.9 | 9.0 | 0.00 | 0.09 | 0.40 | 0.46 |
| 21 | Energy goods and services | 47.8 | 21.2 | 19.4 | 34.0 | 0.91 | 0.49 | 0.48 | 0.82 |
| 22 | Excluding food and energy | 3.2 | 5.6 | 5.1 | 6.2 | 3.02 | 5.20 | 4.72 | 5.72 |
| Personal consumption expenditures: | |||||||||
| 23 | Food and beverages purchased for off-premises consumption | 0.7 | 4.1 | 7.7 | 8.7 | --- | --- | --- | --- |
| 24 | Energy goods and services | 47.7 | 20.4 | 18.9 | 34.2 | --- | --- | --- | --- |
| 25 | Excluding food and energy | 2.7 | 6.1 | 4.6 | 5.0 | --- | --- | --- | --- |
| 26 | Gross domestic product | 4.3 | 6.1 | 6.0 | 7.1 | --- | --- | --- | --- |
| 27 | Exports of goods and services | 21.0 | 19.4 | 9.7 | 6.4 | --- | --- | --- | --- |
| 28 | Imports of goods and services | 13.3 | 13.4 | 6.1 | 5.6 | --- | --- | --- | --- |
- The estimated prices for gross domestic purchases under the contribution columns are also percent changes.
The increase in fourth-quarter real GDP was revised down 0.1 percentage point from the “second” estimate (table 5). The updated estimates primarily reflected downward revisions to consumer spending, exports, and nonresidential fixed investment that were partly offset by upward revisions to private inventory investment and residential fixed investment. Imports were revised up.
- Within consumer spending, both services and goods were revised down.
- For services, the revision primarily reflected downward revisions to health care (led by outpatient services) and transportation (mainly motor vehicles services, including maintenance and repair).
- For goods, the leading contributor to the downward revision was food and beverages purchased for off-premises consumption.
- For both exports and imports, the revised estimates primarily reflected updated data from BEA’s International Transactions Accounts (ITAs).
- Within exports, a downward revision to “other” business services (which includes professional and management consulting services; financial services; and telecommunications, computer, and information services) was partly offset by an upward revision to charges for the use of intellectual property.
- Within imports, the leading contributor to the upward revision was industrial supplies and materials, reflecting upward revisions to nondurable goods (notably, petroleum) as well as durable goods.
- The revision to nonresidential fixed investment reflected a downward revision to intellectual property products led by research and development.
- The revision to private inventory investment reflected an upward revision to nonfarm inventories, led by retail trade (notably, general merchandise stores), “other” industries (specifically, information), and wholesale trade (led by durable goods).
- The upward revision to residential fixed investment was led by single-family structures.
| Line | Series | Change from preceding period (percent) | Contribution to percent change in real GDP (percentage points) | ||||
|---|---|---|---|---|---|---|---|
| Second estimate | Third estimate | Third estimate minus second estimate | Second estimate | Third estimate | Third estimate minus second estimate | ||
| 1 | Gross domestic product (GDP)1 | 3.5 | 3.4 | −0.1 | 7.0 | 6.9 | −0.1 |
| 2 | Personal consumption expenditures | 2.3 | 2.2 | −0.1 | 2.13 | 1.76 | −0.37 |
| 3 | Goods | 2.8 | 2.7 | −0.1 | 0.36 | 0.28 | −0.08 |
| 4 | Durable goods | 3.3 | 3.2 | −0.1 | 0.24 | 0.22 | −0.02 |
| 5 | Nondurable goods | 2.6 | 2.5 | −0.1 | 0.13 | 0.06 | −0.07 |
| 6 | Services | 2.0 | 1.9 | −0.1 | 1.76 | 1.48 | −0.28 |
| 7 | Gross private domestic investment | 9.8 | 10.4 | 0.6 | 5.38 | 5.82 | 0.44 |
| 8 | Fixed investment | 2.8 | 2.8 | 0.0 | 0.48 | 0.50 | 0.02 |
| 9 | Nonresidential | 2.7 | 2.6 | −0.1 | 0.43 | 0.40 | −0.03 |
| 10 | Structures | 3.0 | 3.3 | 0.3 | −0.25 | −0.22 | 0.03 |
| 11 | Equipment | 2.3 | 2.4 | 0.1 | 0.14 | 0.17 | 0.03 |
| 12 | Intellectual property products | 2.9 | 2.6 | −0.3 | 0.53 | 0.45 | −0.08 |
| 13 | Residential | 3.2 | 3.4 | 0.2 | 0.05 | 0.10 | 0.05 |
| 14 | Change in private inventories | --- | --- | --- | 4.90 | 5.32 | 0.42 |
| 15 | Net exports of goods and services | --- | --- | --- | −0.07 | −0.23 | −0.16 |
| 16 | Exports | 7.1 | 6.8 | −0.3 | 2.35 | 2.24 | −0.11 |
| 17 | Goods | 7.2 | 7.2 | 0.0 | 1.63 | 1.64 | 0.01 |
| 18 | Services | 6.9 | 5.8 | −1.1 | 0.72 | 0.59 | −0.13 |
| 19 | Imports | 5.6 | 5.6 | 0.0 | −2.42 | −2.46 | −0.04 |
| 20 | Goods | 5.8 | 5.9 | 0.1 | −2.11 | −2.16 | −0.05 |
| 21 | Services | 4.2 | 4.2 | 0.0 | −0.31 | −0.31 | 0.00 |
| 22 | Government consumption expenditures and gross investment | 1.2 | 1.2 | 0.0 | −0.45 | −0.46 | −0.01 |
| 23 | Federal | 0.3 | 0.3 | 0.0 | −0.30 | −0.29 | 0.01 |
| 24 | National defense | −0.2 | −0.2 | 0.0 | −0.24 | −0.24 | 0.00 |
| 25 | Nondefense | 0.9 | 0.9 | 0.0 | −0.06 | −0.05 | 0.01 |
| 26 | State and local | 1.8 | 1.7 | −0.1 | −0.15 | −0.17 | −0.02 |
| Addenda: | |||||||
| 27 | Final sales of domestic product | 2.2 | 2.1 | −0.1 | --- | --- | --- |
| 28 | Gross domestic income (GDI)2 | --- | 1.2 | --- | --- | --- | --- |
| 29 | Average of GDP and GDI | --- | 1.5 | --- | --- | --- | --- |
| 30 | Gross domestic purchases price index | 1.7 | 1.7 | 0.0 | --- | --- | --- |
| 31 | GDP price index | 1.7 | 1.7 | 0.0 | --- | --- | --- |
- The GDP estimates under the contribution columns are also percent changes.
- GDI is deflated by the implicit price deflator for GDP. For Q4, not published in second estimate.
Measured in current dollars, profits from current production (corporate profits with the inventory valuation adjustment (IVA) and the capital consumption adjustment (CCAdj)) increased $20.4 billion, or 0.7 percent at a quarterly rate, in the fourth quarter after increasing $96.9 billion, or 3.4 percent, in the third quarter (table 6). Profits of domestic financial corporations decreased $1.3 billion, profits of domestic nonfinancial corporations increased $5.0 billion, and rest-of-the-world profits increased $16.8 billion.
| Line | Series | Billions of dollars (annual rate) | Percent change from preceding quarter (quarterly rate) | |||||||
|---|---|---|---|---|---|---|---|---|---|---|
| Level | Change from preceding quarter | |||||||||
| 2021 | 2021 | 2021 | ||||||||
| Q4 | Q1 | Q2 | Q3 | Q4 | Q1 | Q2 | Q3 | Q4 | ||
| Current production measures: | ||||||||||
| 1 | Corporate profits with IVA and CCAdj | 2,936.5 | 123.9 | 267.8 | 96.9 | 20.4 | 5.1 | 10.5 | 3.4 | 0.7 |
| 2 | Domestic industries | 2,408.5 | 134.5 | 274.0 | 45.8 | 3.7 | 6.9 | 13.1 | 1.9 | 0.2 |
| 3 | Financial | 550.6 | 1.3 | 52.8 | 14.2 | −1.3 | 0.3 | 10.9 | 2.6 | −0.2 |
| 4 | Nonfinancial | 1,857.9 | 133.2 | 221.3 | 31.6 | 5.0 | 9.1 | 13.8 | 1.7 | 0.3 |
| 5 | Rest of the world | 528.0 | −10.6 | −6.2 | 51.1 | 16.8 | −2.2 | −1.3 | 11.1 | 3.3 |
| 6 | Receipts from the rest of the world | 970.5 | 34.2 | 27.4 | 65.2 | 12.6 | 4.1 | 3.2 | 7.3 | 1.3 |
| 7 | Less: Payments to the rest of the world | 442.5 | 44.8 | 33.6 | 14.1 | −4.1 | 12.7 | 8.4 | 3.3 | −0.9 |
| 9 | Less: Taxes on corporate income | 409.1 | 28.1 | 34.9 | 14.7 | 15.8 | 8.9 | 10.1 | 3.9 | 4.0 |
| 10 | Equals: Profits after tax | 2,527.4 | 95.8 | 232.9 | 82.1 | 4.7 | 4.5 | 10.5 | 3.4 | 0.2 |
| 11 | Net dividends | 1,465.1 | −37.8 | 51.4 | 27.7 | 26.4 | −2.7 | 3.8 | 2.0 | 1.8 |
| 12 | Undistributed profits from current production | 1,062.3 | 133.6 | 181.5 | 54.5 | −21.8 | 18.7 | 21.4 | 5.3 | −2.0 |
| 13 | Net cash flow with IVA | 3,230.4 | 154.5 | 224.7 | 56.5 | 95.3 | 5.7 | 7.9 | 1.8 | 3.0 |
- CCAdj
- Capital consumption adjustment
- IVA
- Inventory valuation adjustment
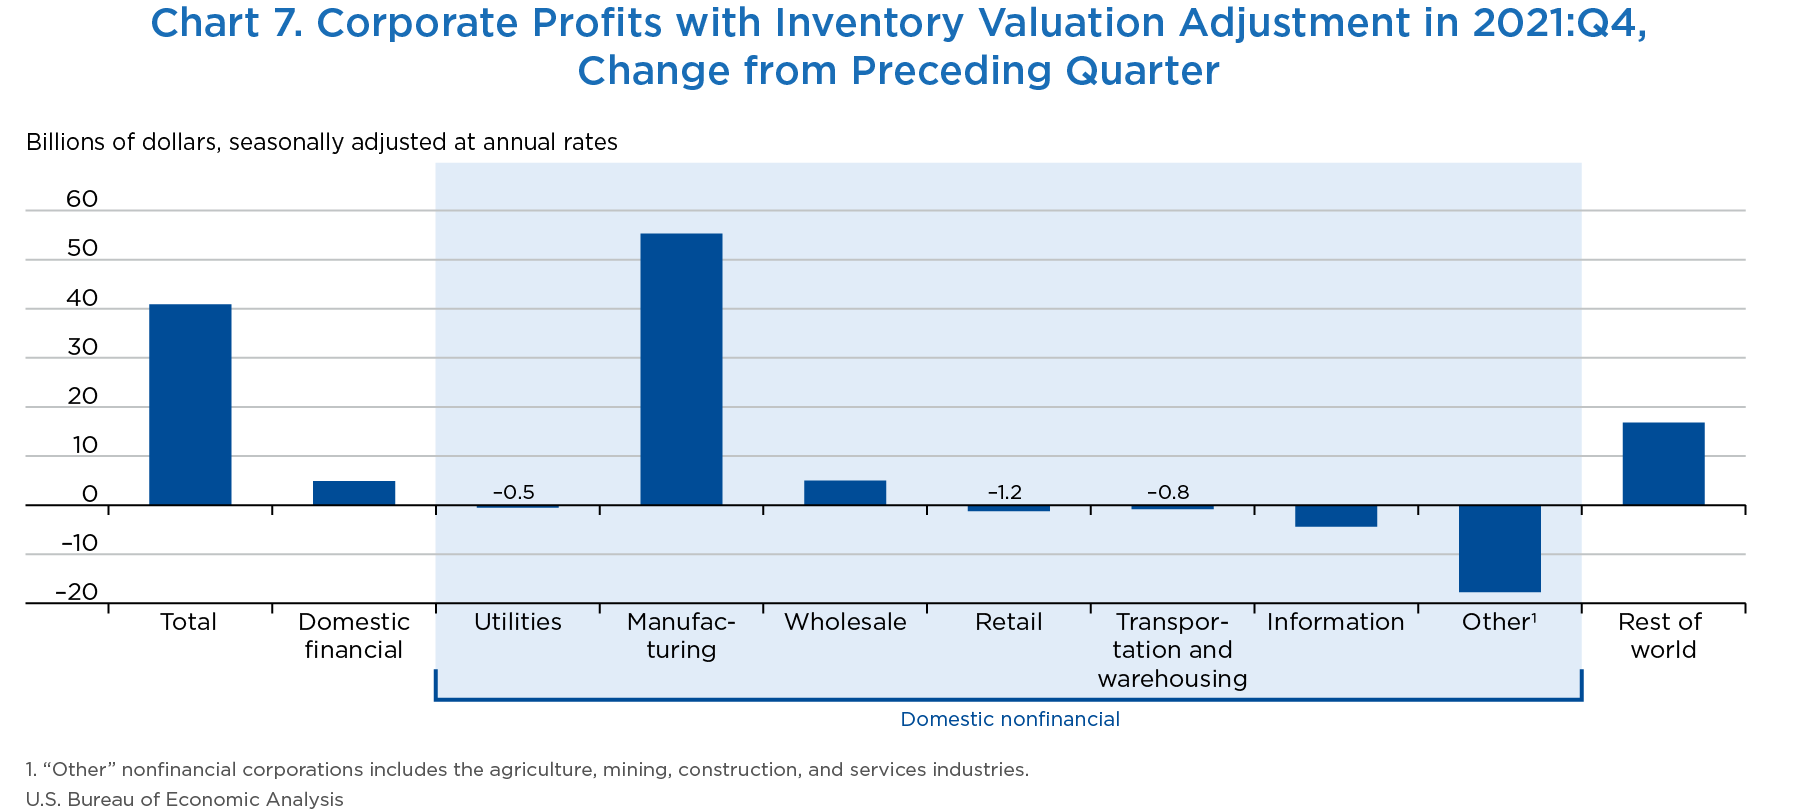
Industry profits (corporate profits by industry with IVA) increased $57.7 billion, or 2.0 percent at a quarterly rate, in the fourth quarter of 2021 after increasing $126.1 billion, or 4.6 percent, in the third quarter (table 7 and chart 7). Domestic profits increased $40.9 billion in the fourth quarter and primarily reflected an increase in manufacturing that was offset by a decrease in “other” nonfinancial industries. Rest-of-the-world profits increased $16.8 billion.
Profits after tax (without IVA and CCAdj)—BEA's profits measure that is conceptually most like the profits for companies in the Standard & Poor's 500 Index—decreased $21.3 billion in the fourth quarter.
[Click chart to expand]
| Line | Series | Billions of dollars (annual rate) | Percent change from preceding quarter (quarterly rate) | |||||||
|---|---|---|---|---|---|---|---|---|---|---|
| Level | Change from preceding quarter | |||||||||
| 2021 | 2021 | 2021 | ||||||||
| Q4 | Q1 | Q2 | Q3 | Q4 | Q1 | Q2 | Q3 | Q4 | ||
| Industry profits: | ||||||||||
| 1 | Corporate profits with IVA | 2,931.6 | 104.7 | 285.9 | 126.1 | 57.7 | 4.4 | 11.6 | 4.6 | 2.0 |
| 2 | Domestic industries | 2,403.5 | 115.3 | 292.1 | 75.0 | 40.9 | 6.1 | 14.6 | 3.3 | 1.7 |
| 3 | Financial | 602.3 | −1.1 | 57.0 | 20.6 | 4.9 | −0.2 | 11.0 | 3.6 | 0.8 |
| 4 | Nonfinancial | 1,801.2 | 116.4 | 235.1 | 54.4 | 36.1 | 8.6 | 15.9 | 3.2 | 2.0 |
| 5 | Utilities | 19.9 | 1.3 | −9.1 | 8.5 | −0.5 | 6.6 | −43.4 | 71.8 | −2.2 |
| 6 | Manufacturing | 555.6 | 36.6 | 48.6 | 49.9 | 55.3 | 10.0 | 12.1 | 11.1 | 11.0 |
| 7 | Wholesale trade | 160.4 | −23.6 | 25.0 | 17.8 | 5.0 | −17.3 | 22.2 | 12.9 | 3.2 |
| 8 | Retail trade | 269.1 | 37.3 | 27.4 | −37.4 | −1.2 | 15.3 | 9.8 | −12.1 | −0.4 |
| 9 | Transportation and warehousing | 46.7 | 9.7 | 29.8 | −17.0 | −0.8 | 39.1 | 86.4 | −26.3 | −1.6 |
| 10 | Information | 172.4 | 3.3 | 14.5 | 1.3 | −4.4 | 2.1 | 9.0 | 0.7 | −2.5 |
| 11 | Other nonfinancial | 577.1 | 51.9 | 98.8 | 31.3 | −17.4 | 12.6 | 21.3 | 5.6 | −2.9 |
| 12 | Rest of the world | 528.0 | −10.6 | −6.2 | 51.1 | 16.8 | −2.2 | −1.3 | 11.1 | 3.3 |
| Addenda: | ||||||||||
| 13 | Profits before tax (without IVA and CCAdj) | 3,109.4 | 231.2 | 357.7 | 45.9 | −5.5 | 9.3 | 13.2 | 1.5 | −0.2 |
| 14 | Profits after tax (without IVA and CCAdj) | 2,700.3 | 203.1 | 322.8 | 31.2 | −21.3 | 9.4 | 13.6 | 1.2 | −0.8 |
| 15 | IVA | −177.9 | −126.5 | −71.8 | 80.2 | 63.2 | --- | --- | --- | --- |
| 16 | CCAdj | 5.0 | 19.2 | −18.1 | −29.2 | −37.2 | --- | --- | --- | --- |
- CCAdj
- Capital consumption adjustment
- IVA
- Inventory valuation adjustment
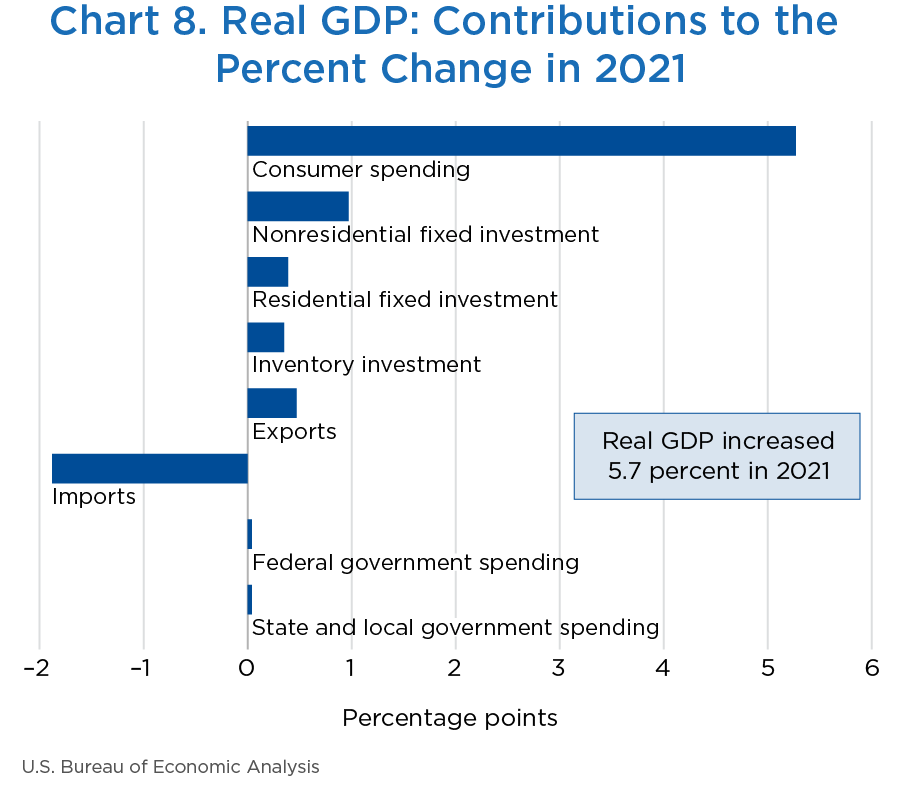
Real GDP increased 5.7 percent in 2021 (from the 2020 annual level to the 2021 annual level), in contrast to a decrease of 3.4 percent in 2020 (table 8). The increase in real GDP in 2021 reflected increases in all major subcomponents, led by consumer spending, nonresidential fixed investment, exports, residential fixed investment, and private inventory investment. Imports increased (chart 8 and table 8).
- The increase in consumer spending reflected increases in both goods and services.
- Within goods, increases were widespread, led by “other” nondurable goods (mainly recreational items and pharmaceuticals), clothing and footwear, and durable recreational goods and vehicles.
[Click chart to expand]
- Within services, the leading contributors were food services and accommodations as well as health care.
- The increase in nonresidential fixed investment reflected increases in equipment (led by information processing equipment) and in intellectual property products (led by software as well as research and development) that were partly offset by a decrease in structures (widespread across most categories).
- The increase in exports reflected an increase in goods (mainly nonautomotive capital goods and consumer goods except food and automotive) that was partly offset by a decrease in services (led by travel as well as royalties and license fees).
- The increase in residential fixed investment mainly reflected an increase in new single-family construction.
- The increase in private inventory investment primarily reflected an increase in wholesale trade (mainly in durable-goods industries).
Real gross domestic income (GDI) increased 7.2 percent in 2021, in contrast to a decrease of 2.9 percent in 2020. The average of real GDP and real GDI increased 6.4 percent in 2021, in contrast to a decrease of 3.2 percent in 2020.
| Line | Series | Share of current-dollar GDP (percent) | Change from preceding period (percent) | Contribution to percent change in real GDP (percentage points) | ||
|---|---|---|---|---|---|---|
| 2021 | 2020 | 2021 | 2020 | 2021 | ||
| 1 | Gross domestic product1 | 100.0 | −3.4 | 5.7 | −3.4 | 5.7 |
| 2 | Personal consumption expenditures | 68.5 | −3.8 | 7.9 | −2.55 | 5.27 |
| 3 | Goods | 23.8 | 4.6 | 12.2 | 0.96 | 2.69 |
| 4 | Durable goods | 8.8 | 7.7 | 18.1 | 0.54 | 1.39 |
| 5 | Nondurable goods | 15.0 | 3.1 | 9.1 | 0.42 | 1.31 |
| 6 | Services | 44.6 | −7.5 | 5.8 | −3.52 | 2.58 |
| 7 | Gross private domestic investment | 17.9 | −5.5 | 9.8 | −0.99 | 1.72 |
| 8 | Fixed investment | 18.0 | −2.7 | 7.8 | −0.47 | 1.37 |
| 9 | Nonresidential | 13.3 | −5.3 | 7.4 | −0.73 | 0.97 |
| 10 | Structures | 2.5 | −12.5 | −8.0 | −0.39 | −0.23 |
| 11 | Equipment | 5.5 | −8.3 | 13.1 | −0.48 | 0.69 |
| 12 | Intellectual property products | 5.2 | 2.8 | 10.0 | 0.14 | 0.51 |
| 13 | Residential | 4.7 | 6.8 | 9.2 | 0.26 | 0.39 |
| 14 | Change in private inventories | −0.1 | .... | .... | −0.52 | 0.35 |
| 15 | Net exports of goods and services | −4.0 | .... | .... | −0.29 | −1.40 |
| 16 | Exports | 10.8 | −13.6 | 4.5 | −1.57 | 0.47 |
| 17 | Goods | 7.6 | −10.2 | 7.6 | −0.76 | 0.52 |
| 18 | Services | 3.2 | −19.8 | −1.5 | −0.81 | −0.05 |
| 19 | Imports | 14.8 | −8.9 | 14.0 | 1.28 | −1.88 |
| 20 | Goods | 12.4 | −5.6 | 14.6 | 0.65 | −1.61 |
| 21 | Services | 2.4 | −22.6 | 11.5 | 0.63 | −0.26 |
| 22 | Government consumption expenditures and gross investment | 17.6 | 2.5 | 0.5 | 0.43 | 0.09 |
| 23 | Federal | 6.8 | 5.0 | 0.6 | 0.33 | 0.04 |
| 24 | National defense | 3.9 | 2.9 | −0.9 | 0.11 | −0.04 |
| 25 | Nondefense | 2.9 | 8.1 | 2.8 | 0.21 | 0.08 |
| 26 | State and local | 10.8 | 0.9 | 0.4 | 0.10 | 0.04 |
| Addenda: | ||||||
| 27 | Gross domestic income (GDI)2 | ...... | −2.9 | 7.2 | ...... | ...... |
| 28 | Average of GDP and GDI | ...... | −3.2 | 6.4 | ...... | ...... |
- The GDP estimates under the contribution columns are also percent changes.
- GDI is deflated by the implicit price deflator for GDP.
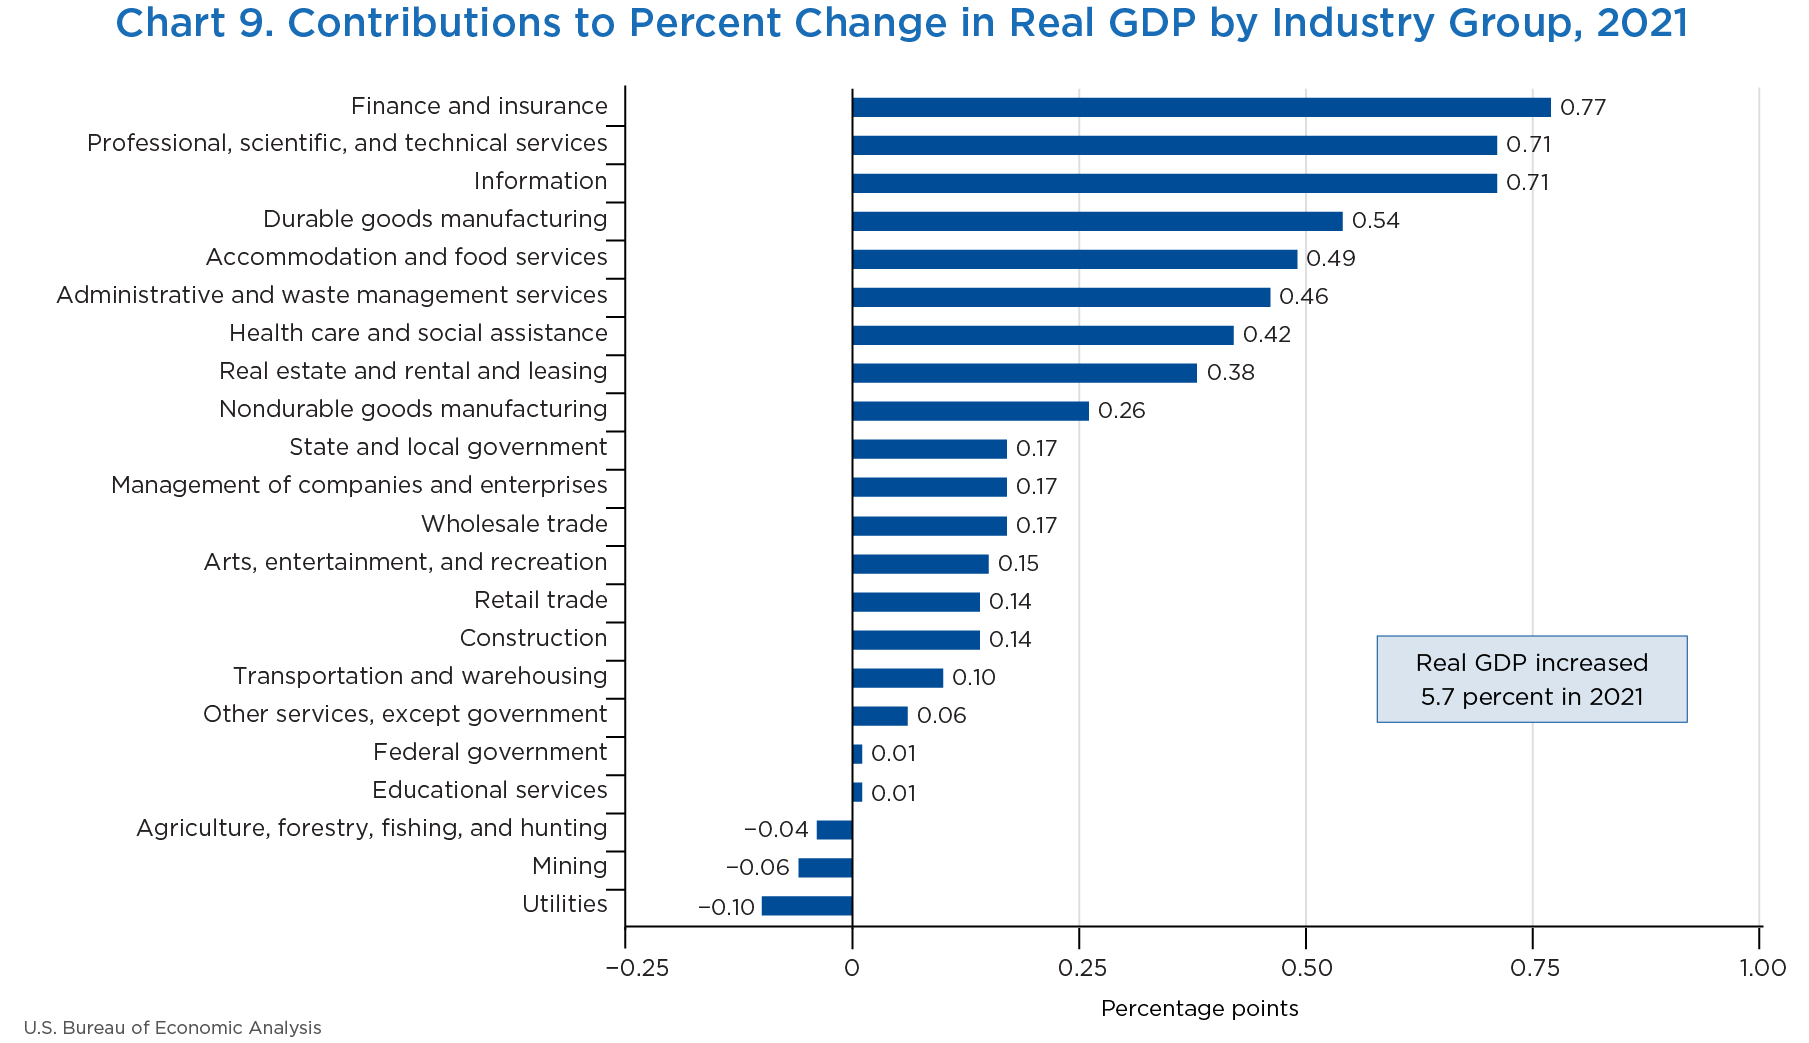
In 2021, private services-producing industries led the increase in GDP, increasing 6.6 percent. Private goods-producing industries increased 5.1 percent, and the government sector increased 1.5 percent (table 9). Overall, 19 of 22 industry groups contributed to the increase in real GDP for 2021 (chart 9).
- Within private goods-producing industries, the leading contributor to the increase was durable-goods manufacturing (led by motor vehicles, bodies and trailers, and parts as well as computer and electronic products).
- Increases within the private services-producing industries were widespread; the leading contributors to the increase were finance and insurance (led by Federal Reserve banks, credit intermediation, and related activities); professional, scientific, and technical services; information (led by data processing, internet publishing, and other information services); accommodation and food services (led by food services and drinking places); and administrative and waste management services.
- The increase in government reflected increases in both state and local government and federal government.
[Click chart to expand]
| Line | Series | Share of current-dollar GDP (percent) | Change from preceding period (percent) | Contribution to percent change in real GDP (percentage points) | ||
|---|---|---|---|---|---|---|
| 2021 | 2020 | 2021 | 2020 | 2021 | ||
| 1 | Gross domestic product | 100.0 | −3.4 | 5.7 | −3.4 | 5.7 |
| 2 | Private industries | 87.9 | −3.8 | 6.3 | −3.30 | 5.47 |
| 3 | Agriculture, forestry, fishing, and hunting | 1.1 | 14.0 | −4.7 | 0.10 | −0.04 |
| 4 | Mining | 1.2 | −10.2 | −5.7 | −0.12 | −0.06 |
| 5 | Utilities | 1.7 | 4.2 | −5.6 | 0.06 | −0.10 |
| 6 | Construction | 4.2 | −3.6 | 3.2 | −0.15 | 0.14 |
| 7 | Manufacturing | 11.1 | −3.0 | 7.6 | −0.32 | 0.80 |
| 8 | Durable goods | 6.0 | −4.9 | 9.1 | −0.30 | 0.54 |
| 9 | Nondurable goods | 5.1 | −0.4 | 5.6 | −0.02 | 0.26 |
| 10 | Wholesale trade | 6.0 | −1.9 | 2.8 | −0.11 | 0.17 |
| 11 | Retail trade | 6.0 | −2.9 | 2.1 | −0.16 | 0.14 |
| 12 | Transporation and warehousing | 2.8 | −13.4 | 2.7 | −0.42 | 0.10 |
| 13 | Information | 5.7 | 3.5 | 13.2 | 0.18 | 0.71 |
| 14 | Finance, insurance, real estate, rental, and leasing | 21.2 | 0.3 | 5.4 | 0.06 | 1.16 |
| 15 | Finance and insurance | 8.5 | 3.0 | 9.4 | 0.24 | 0.77 |
| 16 | Real estate and rental and leasing | 12.8 | −1.3 | 2.9 | −0.18 | 0.38 |
| 17 | Professional and business services | 12.9 | −2.4 | 10.7 | −0.30 | 1.34 |
| 18 | Professional, scientific, and technical services | 7.7 | −1.9 | 9.3 | −0.15 | 0.71 |
| 19 | Management of companies and enterprises | 1.9 | 1.5 | 8.9 | 0.03 | 0.17 |
| 20 | Administrative and waste management services | 3.3 | −5.7 | 15.2 | −0.18 | 0.46 |
| 21 | Educational services, health care, and social assistance | 8.4 | −6.4 | 5.0 | −0.56 | 0.43 |
| 22 | Educational services | 1.1 | −11.3 | 0.5 | −0.15 | 0.01 |
| 23 | Health care and social assistance | 7.3 | −5.5 | 5.8 | −0.41 | 0.42 |
| 24 | Arts, entertainment, recreation, accommodation, and food services | 3.7 | −29.8 | 19.9 | −1.29 | 0.64 |
| 25 | Arts, entertainment, and recreation | 0.9 | −35.4 | 19.8 | −0.41 | 0.15 |
| 26 | Accommodation and food services | 2.8 | −27.8 | 19.9 | −0.89 | 0.49 |
| 27 | Other services, except government | 1.9 | −12.4 | 2.9 | −0.27 | 0.06 |
| 28 | Government | 12.1 | −0.9 | 1.5 | −0.12 | 0.19 |
| 29 | Federal | 3.8 | 2.8 | 0.3 | 0.11 | 0.01 |
| 30 | State and local | 8.2 | −2.6 | 2.0 | −0.22 | 0.17 |
| Addenda: | ||||||
| 31 | Private goods-producing industries1 | 17.6 | −2.9 | 5.1 | −0.49 | 0.83 |
| 32 | Private services-producing industries2 | 70.3 | −4.0 | 6.6 | −2.81 | 4.64 |
- Consists of agriculture, forestry, fishing and hunting; mining; construction; and manufacturing.
- Consists of utilities; wholesale trade; retail trade; transportation and warehousing; information; finance, insurance, real estate, rental, and leasing; professional and business services; educational services, health care, and social assistance; arts, entertainment, recreation, accommodation, and food services; and other services, except government.
Note. Percent changes are from these GDP by industry tables: “Value Added by Industry as a Percentage of Gross Domestic Product,” “Percent Changes in Chain-Type Quantity Indexes for Value Added by Industry,” and “Contributions to Percent Change in Real Gross Domestic Product by Industry.”
- “Real” estimates are in chained (2012) dollars, and price indexes are chain-type measures. Each GDP estimate for a quarter (advance, second, and third) incorporates increasingly comprehensive and improved source data; for more information, see “The Revisions to GDP, GDI, and Their Major Components” in the January 2018 Survey of Current Business. Quarterly estimates are expressed at seasonally adjusted annual rates, which reflect a rate of activity for a quarter as if it were maintained for a year.
- In this article, “consumer spending” refers to “personal consumption expenditures,” “inventory investment” refers to “change in private inventories,” and “government spending” refers to “government consumption expenditures and gross investment.”