
U.S. International Transactions
Fourth Quarter and Year 2021
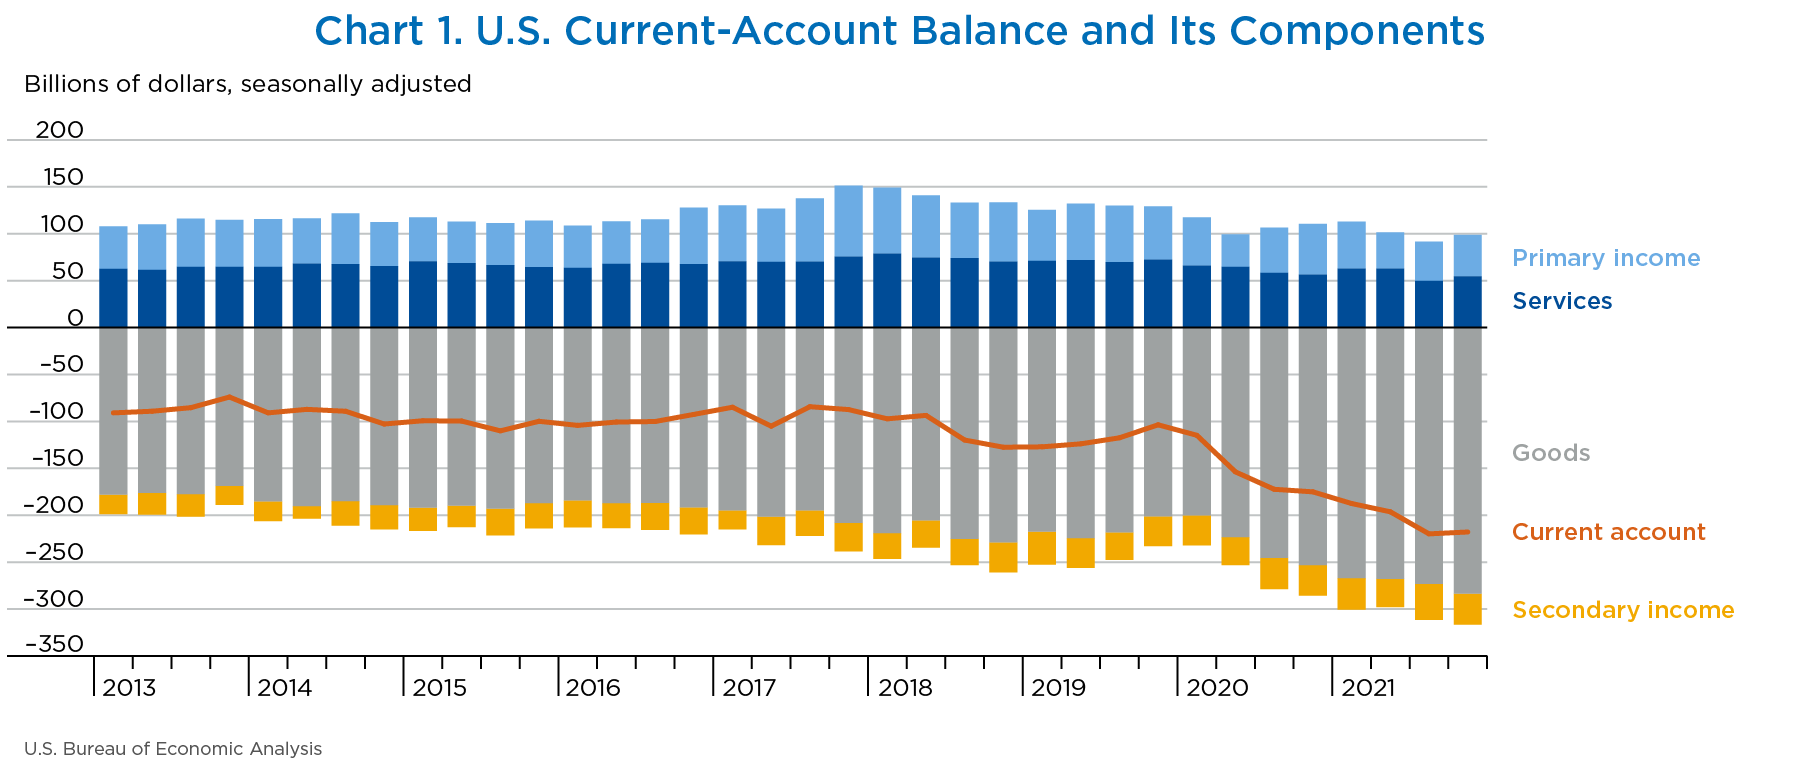
The U.S. current-account deficit, which reflects the combined balances on trade in goods and services and income flows between U.S. residents and residents of other countries, narrowed by $2.0 billion, or 0.9 percent, to $217.9 billion in the fourth quarter of 2021 (chart 1 and table A). The revised third-quarter deficit was $219.9 billion.
The deficit was 3.6 percent of current-dollar gross domestic product (GDP), down from 3.8 percent in the third quarter.
The $2.0 billion narrowing of the current-account deficit in the fourth quarter reflected a reduced deficit on secondary income and expanded surpluses on services and on primary income that were mostly offset by an expanded deficit on goods.
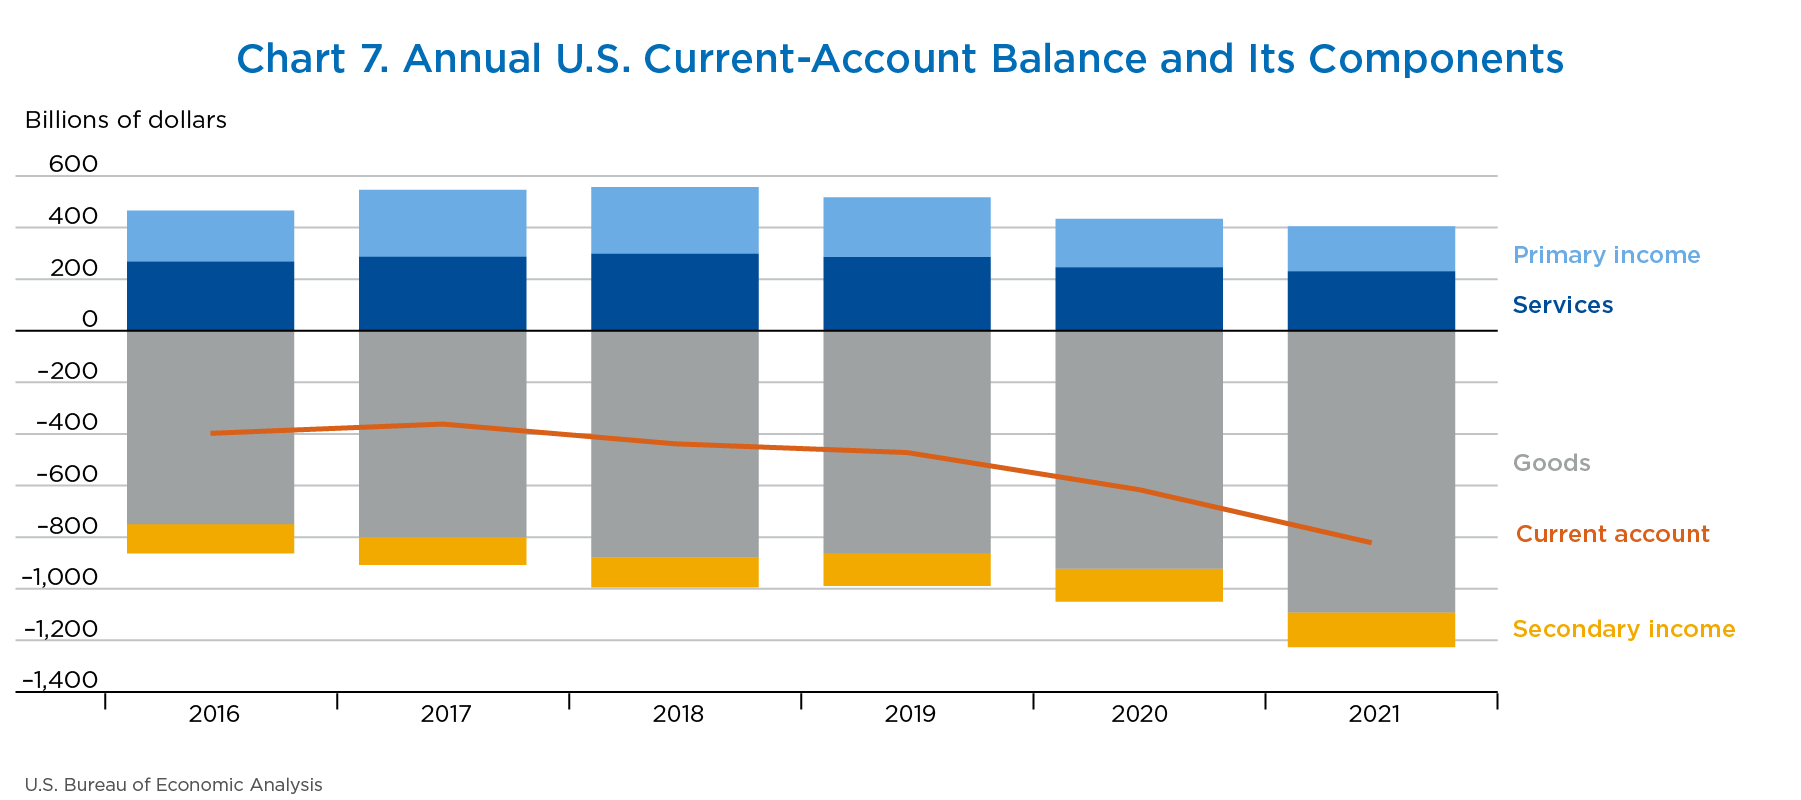
The U.S. current-account deficit widened by $205.5 billion, or 33.4 percent, to $821.6 billion in 2021. The deficit was 3.6 percent of current-dollar GDP, up from 2.9 percent in 2020.
[Click chart to expand]
| Series | 2021 | Change 2021:Q3 to 2021:Q4 | |||
|---|---|---|---|---|---|
| Q1 r | Q2 r | Q3 r | Q4 p | ||
| Current account | |||||
| Exports of goods and services and income receipts (credits) | 895,916 | 933,830 | 958,119 | 1,005,864 | 47,745 |
| Exports of goods and services | 590,517 | 628,387 | 635,891 | 678,161 | 42,270 |
| Goods | 408,929 | 437,351 | 441,930 | 473,499 | 31,569 |
| Services | 181,588 | 191,036 | 193,960 | 204,662 | 10,702 |
| Primary income receipts | 262,893 | 263,965 | 279,724 | 284,207 | 4,483 |
| Secondary income (current transfer) receipts | 42,507 | 41,478 | 42,505 | 43,496 | 991 |
| Imports of goods and services and income payments (debits) | 1,083,446 | 1,130,183 | 1,177,991 | 1,223,744 | 45,753 |
| Imports of goods and services | 794,583 | 833,341 | 859,283 | 907,131 | 47,848 |
| Goods | 675,950 | 705,098 | 715,100 | 756,945 | 41,845 |
| Services | 118,634 | 128,243 | 144,183 | 150,186 | 6,003 |
| Primary income payments | 212,837 | 225,281 | 237,802 | 239,961 | 2,159 |
| Secondary income (current transfer) payments | 76,025 | 71,560 | 80,906 | 76,652 | −4,254 |
| Capital account | |||||
| Capital transfer receipts and other credits | 23 | 8 | 3,813 | 7 | −3,806 |
| Capital transfer payments and other debits | 2,765 | 870 | 809 | 1,851 | 1,042 |
| Financial account | |||||
| Net U.S. acquisition of financial assets excluding financial derivatives (net increase in assets / financial outflow (+)) | 406,909 | 244,195 | 448,596 | 113,623 | −334,973 |
| Direct investment assets | 88,017 | 172,251 | 100,025 | 140,996 | 40,971 |
| Portfolio investment assets | 294,204 | 126,195 | 274,682 | −90,945 | −365,627 |
| Other investment assets | 26,788 | −54,728 | −38,714 | 60,559 | 99,273 |
| Reserve assets | −2,100 | 477 | 112,603 | 3,013 | −109,590 |
| Net U.S. incurrence of liabilities excluding financial derivatives (net increase in liabilities / financial inflow (+)) | 575,402 | 446,846 | 612,132 | 224,377 | −387,755 |
| Direct investment liabilities | 71,560 | 87,537 | 170,282 | 120,229 | −50,053 |
| Portfolio investment liabilities | 323,752 | 198,105 | 127,777 | −66,394 | −194,171 |
| Other investment liabilities | 180,090 | 161,204 | 314,073 | 170,543 | −143,530 |
| Financial derivatives other than reserves, net transactions | −2,216 | −8,612 | −7,980 | −22,861 | −14,881 |
| Statistical discrepancy | |||||
| Statistical discrepancy1 | 19,563 | −14,046 | 45,352 | 86,109 | 40,757 |
| Balances | |||||
| Balance on current account | −187,529 | −196,353 | −219,872 | −217,880 | 1,992 |
| Balance on goods and services | −204,067 | −204,954 | −223,392 | −228,970 | −5,578 |
| Balance on goods | −267,021 | −267,747 | −273,170 | −283,446 | −10,276 |
| Balance on services | 62,954 | 62,793 | 49,778 | 54,476 | 4,698 |
| Balance on primary income | 50,056 | 38,684 | 41,922 | 44,246 | 2,324 |
| Balance on secondary income | −33,518 | −30,083 | −38,401 | −33,156 | 5,245 |
| Balance on capital account | −2,743 | −863 | 3,004 | −1,844 | −4,848 |
| Net lending (+) or net borrowing (−) from current- and capital-account transactions2 | −190,272 | −197,216 | −216,868 | −219,724 | −2,856 |
| Net lending (+) or net borrowing (−) from financial-account transactions3 | −170,709 | −211,262 | −171,516 | −133,616 | 37,900 |
- p
- Preliminary
- r
- Revised
- n.a.
- Not available
- The statistical discrepancy is the difference between net acquisition of financial assets and net incurrence of liabilities in the financial account (including financial derivatives) less the difference between total credits and total debits recorded in the current and capital accounts.
- Sum of current- and capital-account balances.
- Sum of net U.S. acquisition of financial assets and net transactions in financial derivatives less net U.S. incurrence of liabilities.
Note. The statistics are presented in table 1.2 on BEA's website.
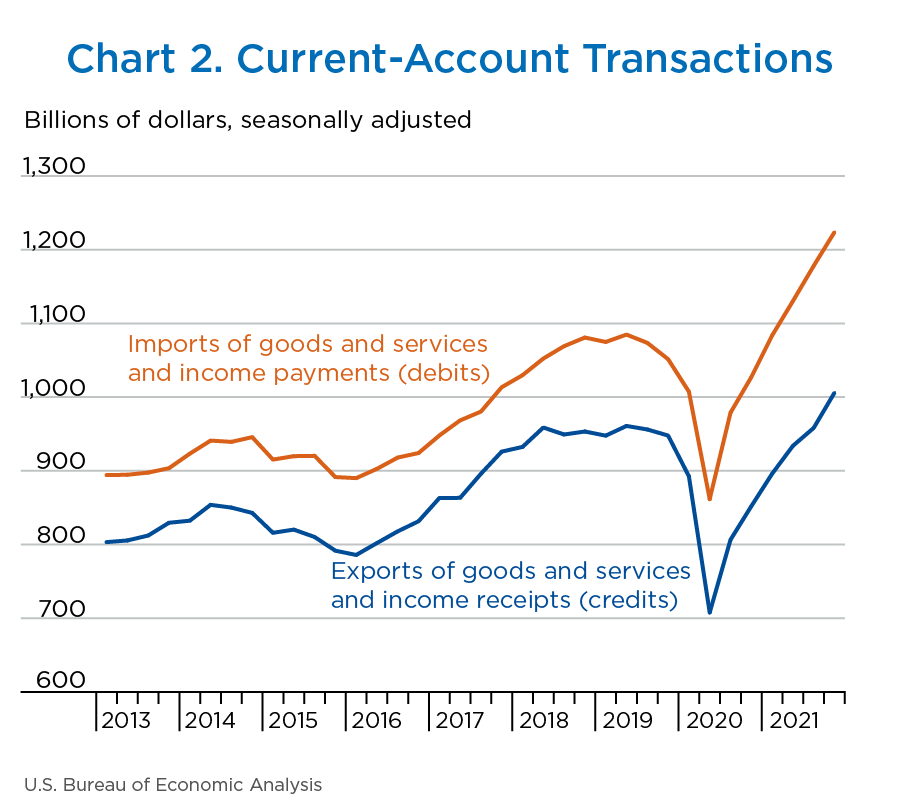
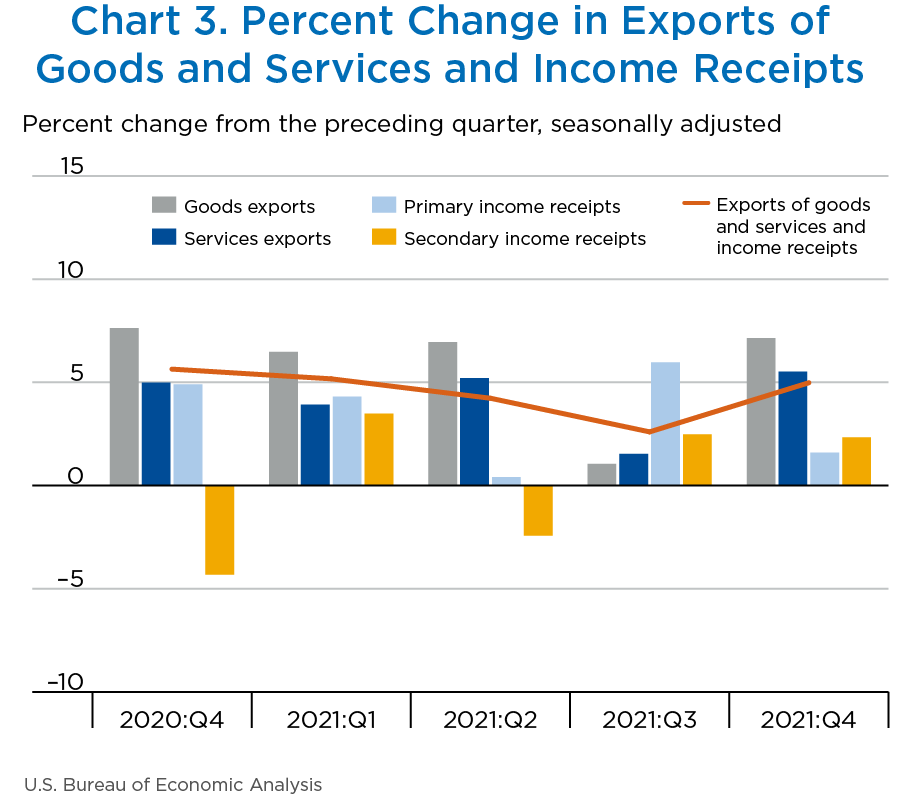
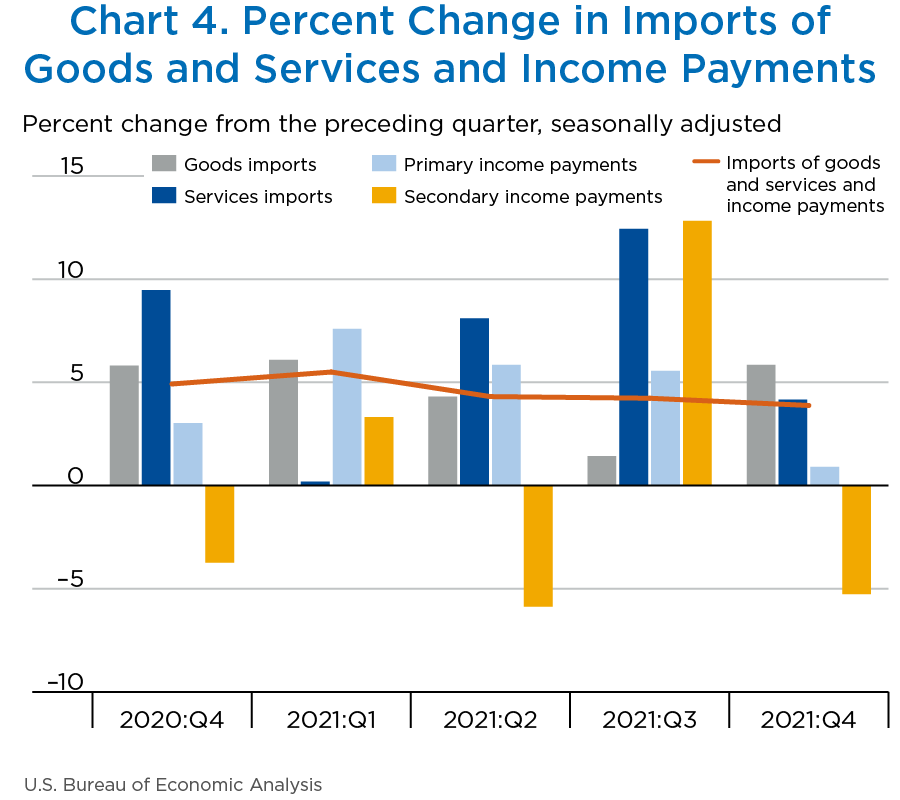
Exports of goods and services to, and income received from, foreign residents increased $47.7 billion to $1.01 trillion in the fourth quarter (charts 2 and 3 and table B). Imports of goods and services from, and income paid to, foreign residents increased $45.8 billion to $1.22 trillion (charts 2 and 4 and table C).
[Click chart to expand]
Trade in goods
Exports of goods increased $31.6 billion to $473.5 billion, and imports of goods increased $41.8 billion to $756.9 billion. The increases in both exports and imports reflected increases in all major categories, led by industrial supplies and materials and consumer goods.
Trade in services
Exports of services increased $10.7 billion to $204.7 billion, mostly reflecting increases in travel, primarily other personal travel, in transport, primarily air passenger transport, and in charges for the use of intellectual property, primarily licenses for the use of outcomes of research and development (such as patents and trade secrets). Imports of services increased $6.0 billion to $150.2 billion, mostly reflecting increases in transport, primarily sea freight transport, and in travel, primarily other personal travel.
Primary income
Receipts of primary income increased $4.5 billion to $284.2 billion, mainly reflecting an increase in portfolio investment income, mostly equity securities. Payments of primary income increased $2.2 billion to $240.0 billion, reflecting an increase in portfolio investment income, mostly interest on long-term debt securities, that was partly offset by a decrease in direct investment income, mainly earnings.
Secondary income
Receipts of secondary income increased $1.0 billion to $43.5 billion, mostly reflecting an increase in general government transfers, primarily fines and penalties and taxes on income and wealth. Payments of secondary income decreased $4.3 billion to $76.7 billion, mainly reflecting a decrease in general government transfers, primarily international cooperation.
[Click chart to expand]
[Click chart to expand]
| Series | 2021 | Change 2021:III to 2021:IV | |||
|---|---|---|---|---|---|
| I r | II r | III r | IV p | ||
| Exports of goods and services and income receipts | 895,916 | 933,830 | 958,119 | 1,005,864 | 47,745 |
| Exports of goods | 408,929 | 437,351 | 441,930 | 473,499 | 31,569 |
| General merchandise | 398,842 | 429,104 | 434,597 | 466,786 | 32,189 |
| Foods, feeds, and beverages | 41,766 | 41,544 | 38,114 | 43,791 | 5,677 |
| Industrial supplies and materials | 134,564 | 152,783 | 158,568 | 169,582 | 11,014 |
| Energy products | 52,043 | 63,495 | 68,669 | 78,595 | 9,926 |
| Of which: Petroleum and products | 40,073 | 51,745 | 53,685 | 61,314 | 7,629 |
| Nonenergy products | 82,521 | 89,288 | 89,899 | 90,987 | 1,088 |
| Capital goods except automotive | 122,395 | 131,881 | 130,933 | 134,574 | 3,641 |
| Automotive vehicles, parts, and engines | 37,175 | 34,637 | 34,144 | 37,647 | 3,503 |
| Consumer goods except food and automotive | 47,908 | 52,499 | 57,262 | 63,889 | 6,627 |
| Other general merchandise | 15,035 | 15,760 | 15,574 | 17,302 | 1,728 |
| Net exports of goods under merchanting | 253 | 254 | 277 | 202 | −75 |
| Nonmonetary gold | 9,833 | 7,993 | 7,057 | 6,511 | −546 |
| Exports of services1 | 181,588 | 191,036 | 193,960 | 204,662 | 10,702 |
| Manufacturing services on physical inputs owned by others | n.a. | n.a. | n.a. | n.a. | n.a. |
| Maintenance and repair services n.i.e. | 2,947 | 2,980 | 3,128 | 2,993 | −135 |
| Transport | 14,342 | 15,905 | 16,609 | 18,188 | 1,579 |
| Travel (for all purposes including education) | 13,303 | 16,099 | 16,506 | 22,851 | 6,345 |
| Business | 2,477 | 2,865 | 3,135 | 4,388 | 1,253 |
| Personal | 10,826 | 13,234 | 13,371 | 18,462 | 5,091 |
| Construction | 651 | 650 | 792 | 705 | −87 |
| Insurance services | 5,291 | 5,309 | 5,914 | 6,158 | 244 |
| Financial services | 39,435 | 40,461 | 41,861 | 42,331 | 470 |
| Charges for the use of intellectual property n.i.e. | 30,119 | 31,379 | 30,945 | 32,385 | 1,440 |
| Telecommunications, computer, and information services | 14,691 | 14,946 | 14,418 | 14,087 | −331 |
| Other business services | 49,494 | 51,562 | 52,298 | 53,188 | 890 |
| Personal, cultural, and recreational services | 5,475 | 5,924 | 5,731 | 5,835 | 104 |
| Government goods and services n.i.e. | 5,841 | 5,822 | 5,759 | 5,943 | 184 |
| Primary income receipts | 262,893 | 263,965 | 279,724 | 284,207 | 4,483 |
| Investment income | 261,251 | 262,295 | 278,038 | 282,507 | 4,469 |
| Direct investment income | 150,847 | 149,691 | 156,949 | 156,422 | −527 |
| Income on equity | 146,917 | 145,849 | 153,296 | 152,839 | −457 |
| Dividends and withdrawals | 72,942 | 49,116 | 68,288 | 28,611 | −39,677 |
| Reinvested earnings | 73,974 | 96,733 | 85,008 | 124,228 | 39,220 |
| Interest | 3,931 | 3,842 | 3,653 | 3,583 | −70 |
| Portfolio investment income | 95,851 | 98,342 | 106,669 | 111,873 | 5,204 |
| Income on equity and investment fund shares | 62,311 | 64,876 | 71,230 | 74,850 | 3,620 |
| Interest on debt securities | 33,540 | 33,466 | 35,439 | 37,023 | 1,584 |
| Other investment income | 14,487 | 14,215 | 14,650 | 14,178 | −472 |
| Reserve asset income | 65 | 47 | −231 | 35 | 266 |
| Compensation of employees | 1,642 | 1,669 | 1,686 | 1,701 | 15 |
| Secondary income (current transfer) receipts2 | 42,507 | 41,478 | 42,505 | 43,496 | 991 |
- p
- Preliminary
- r
- Revised
- n.a.
- Not available
- n.i.e.
- Not included elsewhere
- See also International Services table 2.1.
- Secondary income (current transfer) receipts include U.S. government and private transfers, such as fines and penalties, withholding taxes, insurance-related transfers, and other current transfers.
| Series | 2021 | Change 2021:III to 2021:IV | |||
|---|---|---|---|---|---|
| I r | II r | III r | IV p | ||
| Imports of goods and services and income payments | 1,083,446 | 1,130,183 | 1,177,991 | 1,223,744 | 45,753 |
| Imports of goods | 675,950 | 705,098 | 715,100 | 756,945 | 41,845 |
| General merchandise | 669,073 | 698,531 | 709,794 | 749,949 | 40,155 |
| Foods, feeds, and beverages | 41,237 | 46,217 | 47,475 | 48,372 | 897 |
| Industrial supplies and materials | 136,164 | 156,697 | 169,230 | 178,671 | 9,441 |
| Energy products | 46,957 | 56,690 | 63,352 | 68,071 | 4,719 |
| Of which: Petroleum and products | 42,865 | 52,384 | 57,815 | 62,630 | 4,815 |
| Nonenergy products | 89,207 | 100,007 | 105,878 | 110,600 | 4,722 |
| Capital goods except automotive | 183,709 | 190,595 | 192,816 | 199,183 | 6,367 |
| Automotive vehicles, parts, and engines | 90,561 | 87,133 | 83,537 | 86,992 | 3,455 |
| Consumer goods except food and automotive | 189,883 | 189,261 | 185,923 | 202,496 | 16,573 |
| Other general merchandise | 27,519 | 28,629 | 30,812 | 34,234 | 3,422 |
| Nonmonetary gold | 6,877 | 6,568 | 5,307 | 6,996 | 1,689 |
| Imports of services1 | 118,634 | 128,243 | 144,183 | 150,186 | 6,003 |
| Manufacturing services on physical inputs owned by others | n.a. | n.a. | n.a. | n.a. | n.a. |
| Maintenance and repair services n.i.e. | 1,931 | 1,978 | 1,888 | 1,717 | −171 |
| Transport | 19,866 | 24,600 | 28,765 | 31,576 | 2,811 |
| Travel (for all purposes including education) | 7,861 | 11,939 | 17,828 | 20,313 | 2,485 |
| Business | 1,132 | 1,659 | 2,423 | 2,912 | 489 |
| Personal | 6,729 | 10,280 | 15,404 | 17,401 | 1,997 |
| Construction | 334 | 304 | 284 | 340 | 56 |
| Insurance services | 14,059 | 13,934 | 14,718 | 14,947 | 229 |
| Financial services | 10,499 | 10,644 | 11,756 | 12,066 | 310 |
| Charges for the use of intellectual property n.i.e. | 11,782 | 11,000 | 12,530 | 11,537 | −993 |
| Telecommunications, computer, and information services | 9,979 | 10,136 | 10,208 | 11,035 | 827 |
| Other business services | 29,682 | 30,591 | 33,158 | 33,349 | 191 |
| Personal, cultural, and recreational services | 6,416 | 6,800 | 6,722 | 7,014 | 292 |
| Government goods and services n.i.e. | 6,225 | 6,317 | 6,325 | 6,293 | −32 |
| Primary income payments | 212,837 | 225,281 | 237,802 | 239,961 | 2,159 |
| Investment income | 208,993 | 221,454 | 233,641 | 235,899 | 2,258 |
| Direct investment income | 64,203 | 77,261 | 82,508 | 80,350 | −2,158 |
| Portfolio investment income | 127,727 | 127,413 | 133,039 | 137,527 | 4,488 |
| Income on equity and investment fund shares | 46,463 | 45,731 | 47,212 | 48,333 | 1,121 |
| Interest on debt securities | 81,264 | 81,682 | 85,827 | 89,194 | 3,367 |
| Other investment income | 17,063 | 16,779 | 18,093 | 18,022 | −71 |
| Compensation of employees | 3,845 | 3,827 | 4,161 | 4,062 | −99 |
| Secondary income (current transfer) payments2 | 76,025 | 71,560 | 80,906 | 76,652 | −4,254 |
| Supplemental detail on insurance transactions: | |||||
| Premiums paid | 36,533 | 35,884 | 38,416 | 39,099 | 683 |
| Losses recovered | 25,266 | 25,549 | 29,427 | 25,670 | −3,757 |
- p
- Preliminary
- r
- Revised
- n.a.
- Not available
- n.i.e.
- Not included elsewhere
- See also International Services table 2.1.
- Secondary income (current transfer) payments include U.S. government and private transfers, such as U.S. government grants and pensions, fines and penalties, withholding taxes, personal transfers (remittances), insurance-related transfers, and other current transfers.
Capital-transfer receipts decreased $3.8 billion to $7 million in the fourth quarter (table A). Third-quarter transactions reflected receipts from foreign insurance companies for losses resulting from Hurricane Ida. Capital-transfer payments increased $1.0 billion to $1.9 billion in the fourth quarter, reflecting an increase in U.S. government investment grants.
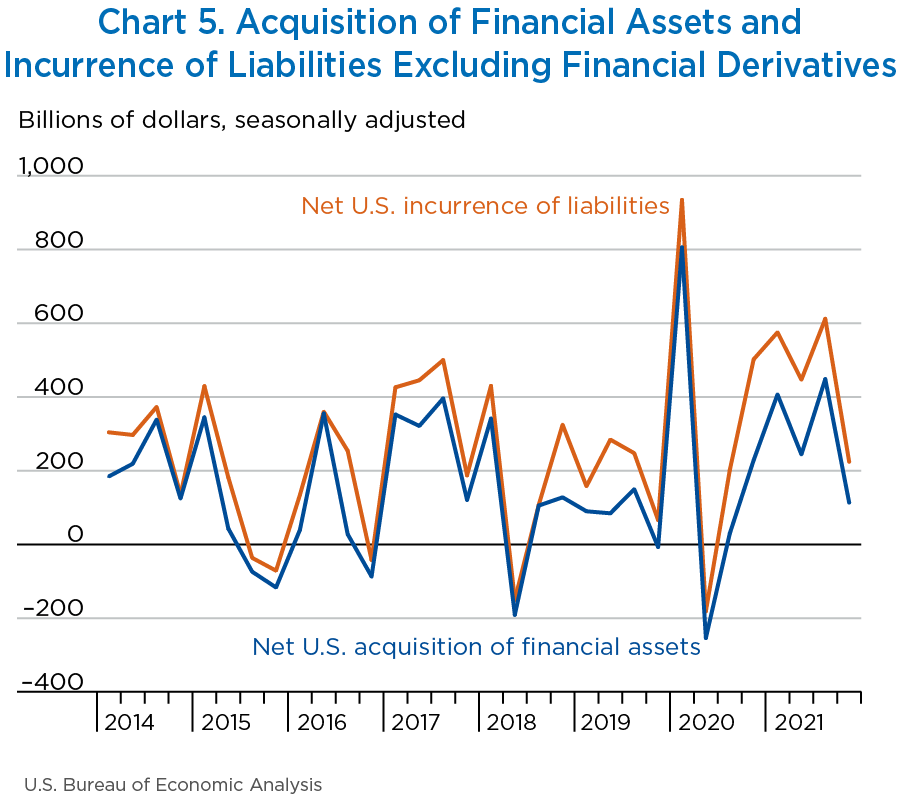
Net financial-account transactions were −$133.6 billion in the fourth quarter, reflecting net U.S. borrowing from foreign residents.
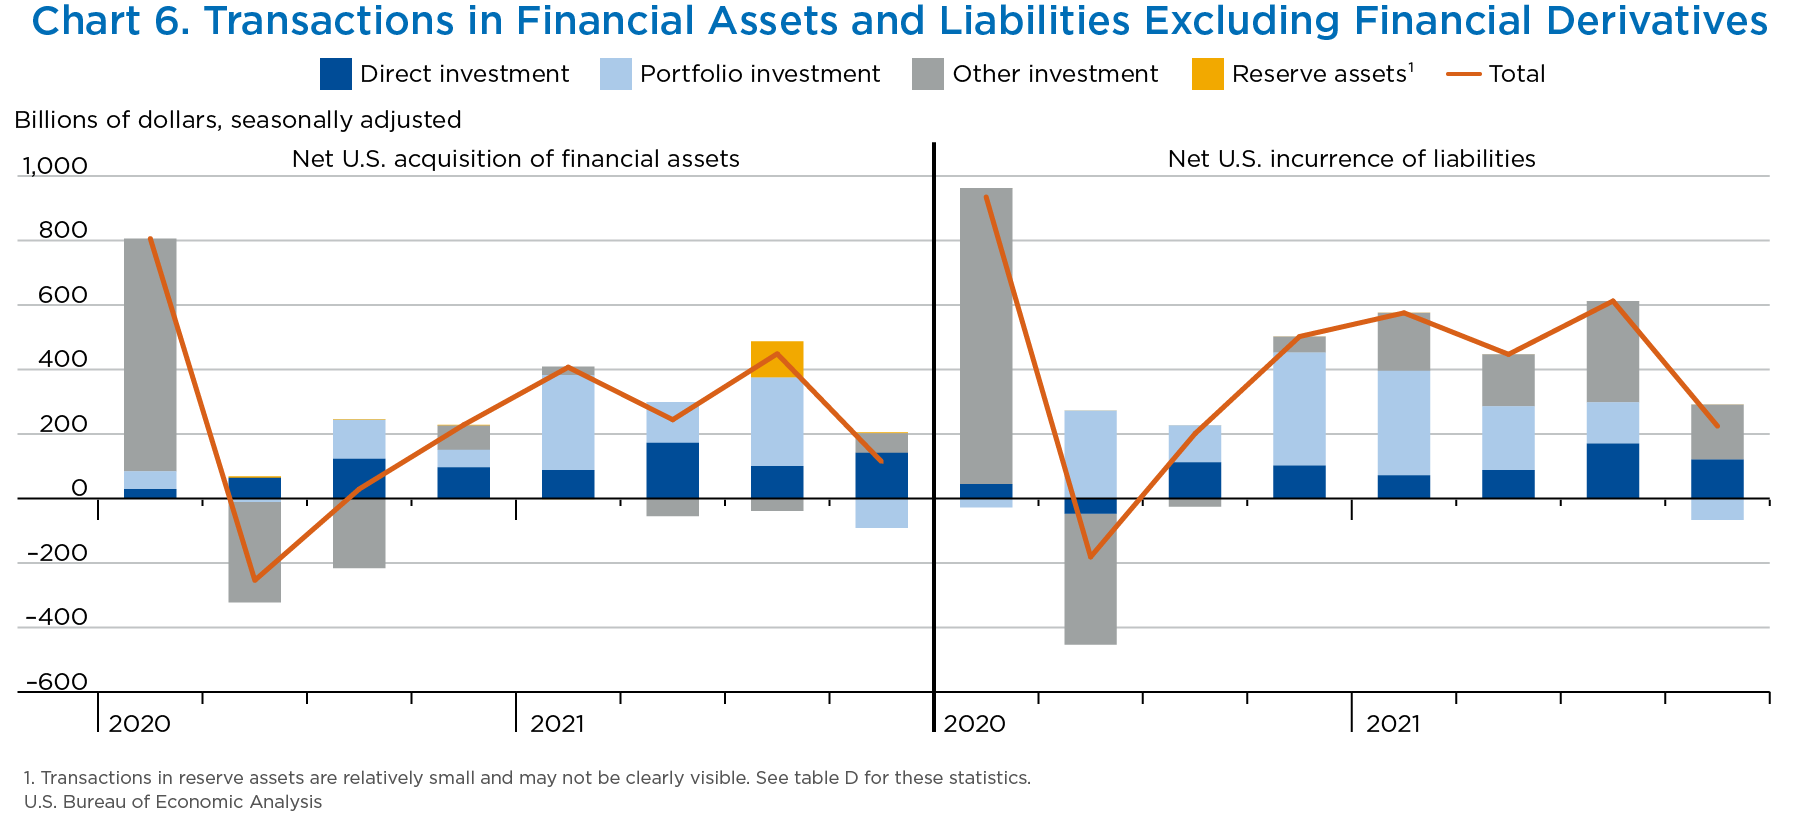
Financial assets
Fourth-quarter transactions increased U.S. residents' foreign financial assets by $113.6 billion (charts 5 and 6 and table D). Transactions increased direct investment assets, primarily equity, by $141.0 billion; other investment assets, mostly deposits, by $60.6 billion; and reserve assets by $3.0 billion. Transactions decreased portfolio investment assets by $90.9 billion, resulting from large and partly offsetting transactions in equity and debt securities.
Liabilities
Fourth-quarter transactions increased U.S. liabilities to foreign residents by $224.4 billion. Transactions increased other investment liabilities, mainly loans, by $170.5 billion, and direct investment liabilities, mostly equity, by $120.2 billion. Transactions decreased portfolio investment liabilities by $66.4 billion, resulting from large and partly offsetting transactions in equity and debt securities.
Financial derivatives
Net transactions in financial derivatives were −$22.9 billion in the fourth quarter, reflecting net U.S. borrowing from foreign residents.
[Click chart to expand]
[Click chart to expand]
| Series | 2021 | Change 2021:III to 2021:IV | |||
|---|---|---|---|---|---|
| I r | II r | III r | IV p | ||
| Net U.S. acquisition of financial assets excluding financial derivatives (net increase in assets / financial outflow (+)) | 406,909 | 244,195 | 448,596 | 113,623 | −334,973 |
| Direct investment assets | 88,017 | 172,251 | 100,025 | 140,996 | 40,971 |
| Equity | 87,993 | 130,324 | 86,886 | 155,310 | 68,424 |
| Equity other than reinvestment of earnings | 14,019 | 33,591 | 1,878 | 31,082 | 29,204 |
| Reinvestment of earnings | 73,974 | 96,733 | 85,008 | 124,228 | 39,220 |
| Debt instruments | 24 | 41,927 | 13,139 | −14,314 | −27,453 |
| Portfolio investment assets | 294,204 | 126,195 | 274,682 | −90,945 | −365,627 |
| Equity and investment fund shares | 83,024 | 121,169 | 115,393 | −165,712 | −281,105 |
| Debt securities | 211,180 | 5,026 | 159,288 | 74,767 | −84,521 |
| Short-term securities | 39,856 | 23,031 | 22,030 | −41,217 | −63,247 |
| Long-term corporate securities | 123,792 | −14,936 | 104,145 | 83,366 | −20,779 |
| Other long-term securities | 47,532 | −3,069 | 33,113 | 32,618 | −495 |
| Other investment assets | 26,788 | −54,728 | −38,714 | 60,559 | 99,273 |
| Other equity | 1,169 | 0 | 37 | 0 | −37 |
| Currency and deposits | −1,588 | −82,679 | −36,605 | 45,589 | 82,194 |
| Loans | 23,323 | 31,031 | −1,627 | 13,402 | 15,029 |
| Trade credit and advances | 3,884 | −3,081 | −518 | 1,569 | 2,087 |
| Reserve assets | −2,100 | 477 | 112,603 | 3,013 | −109,590 |
| Monetary gold | 0 | 0 | 0 | 0 | 0 |
| Special drawing rights | 8 | 4 | 112,838 | 835 | −112,003 |
| Reserve position in the International Monetary Fund | −2,157 | 437 | 11 | 2,169 | 2,158 |
| Other reserve assets | 50 | 36 | −247 | 9 | 256 |
| Net U.S. incurrence of liabilities excluding financial derivatives (net increase in liabilities / financial inflow (+)) | 575,402 | 446,846 | 612,132 | 224,377 | −387,755 |
| Direct investment liabilities | 71,560 | 87,537 | 170,282 | 120,229 | −50,053 |
| Equity | 73,195 | 88,901 | 119,716 | 110,944 | −8,772 |
| Equity other than reinvestment of earnings | 30,740 | 36,088 | 61,564 | 49,614 | −11,950 |
| Reinvestment of earnings | 42,455 | 52,813 | 58,152 | 61,330 | 3,178 |
| Debt instruments | −1,635 | −1,364 | 50,566 | 9,285 | −41,281 |
| Portfolio investment liabilities | 323,752 | 198,105 | 127,777 | −66,394 | −194,171 |
| Equity and investment fund shares | 96,969 | 67,936 | 131,827 | −305,215 | −437,042 |
| Debt securities | 226,783 | 130,169 | −4,050 | 238,821 | 242,871 |
| Short term | −44,402 | −39,330 | 7,434 | 50,210 | 42,776 |
| Treasury bills and certificates | −60,815 | −52,145 | −2,765 | 59,028 | 61,793 |
| Federally sponsored agency securities | −3,419 | −1,352 | 954 | 309 | −645 |
| Other short-term securities | 19,832 | 14,167 | 9,245 | −9,127 | −18,372 |
| Long term | 271,186 | 169,499 | −11,485 | 188,611 | 200,096 |
| Treasury bonds and notes | 223,025 | 158,132 | 79,256 | 140,349 | 61,093 |
| Federally sponsored agency securities | −24,416 | −12,749 | −24,384 | 16,906 | 41,290 |
| Corporate bonds and notes | 70,063 | 20,678 | −65,693 | 30,700 | 96,393 |
| Other | 2,514 | 3,438 | −664 | 656 | 1,320 |
| Other investment liabilities | 180,090 | 161,204 | 314,073 | 170,543 | −143,530 |
| Other equity | n.a. | n.a. | n.a. | n.a. | n.a |
| Currency | 10,092 | 12,650 | 7,321 | 18,284 | 10,963 |
| Deposits | 83,801 | 45,406 | 166,392 | −30,756 | −197,148 |
| Loans | 81,318 | 100,168 | 25,189 | 173,885 | 148,696 |
| Trade credit and advances | 4,878 | 2,980 | 2,336 | 9,129 | 6,793 |
| Special drawing rights allocations | 0 | 0 | 112,834 | 0 | −112,834 |
- p
- Preliminary
- r
- Revised
The U.S. international transactions statistics for the third quarter have been updated to incorporate newly available and revised source data (table E). In addition, the statistics for the first three quarters of 2021 have been updated to align the seasonally adjusted statistics with annual totals.
| Series | Preliminary Estimates | Revised Estimates |
|---|---|---|
| Balance on current account | −214,774 | −219,872 |
| Balance on goods | −274,827 | −273,170 |
| Balance on services | 49,863 | 49,778 |
| Balance on primary income | 48,162 | 41,922 |
| Balance on secondary income (current transfers) | −37,972 | −38,401 |
| Net lending or borrowing from financial-account transactions | −127,213 | −171,516 |
| Net U.S. acquisition of financial assets | 494,066 | 448,596 |
| Net U.S. incurrence of liabilities | 613,299 | 612,132 |
| Financial derivatives other than reserves, net transactions | −7,980 | −7,980 |
The $205.5 billion widening of the current-account deficit in 2021 primarily reflected an expanded deficit on goods (chart 7).
[Click chart to expand]
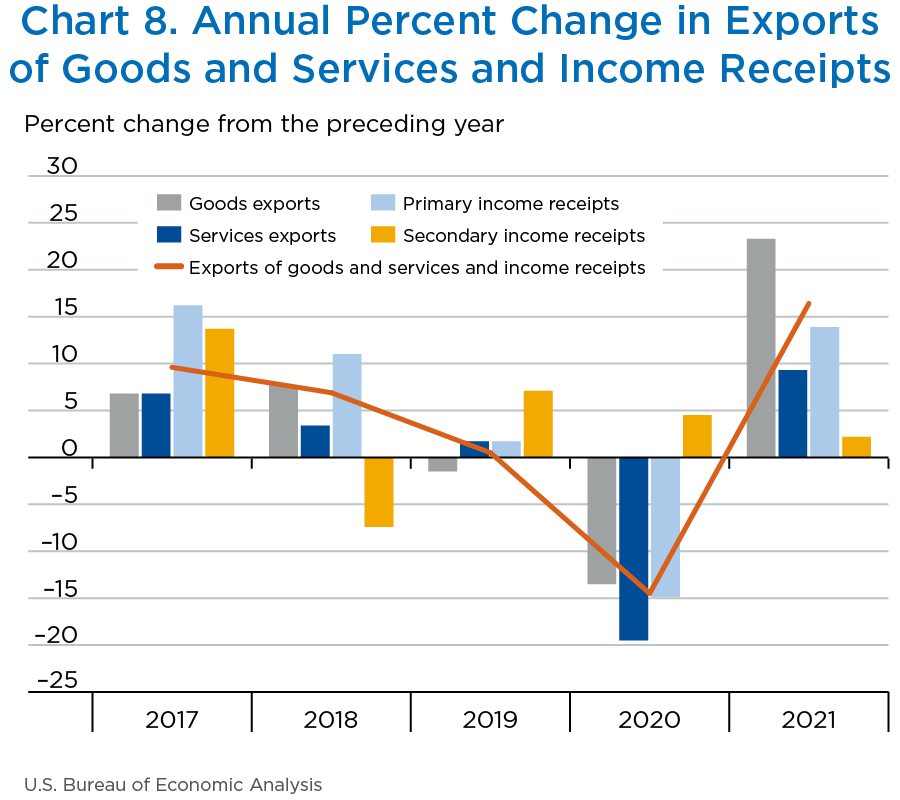
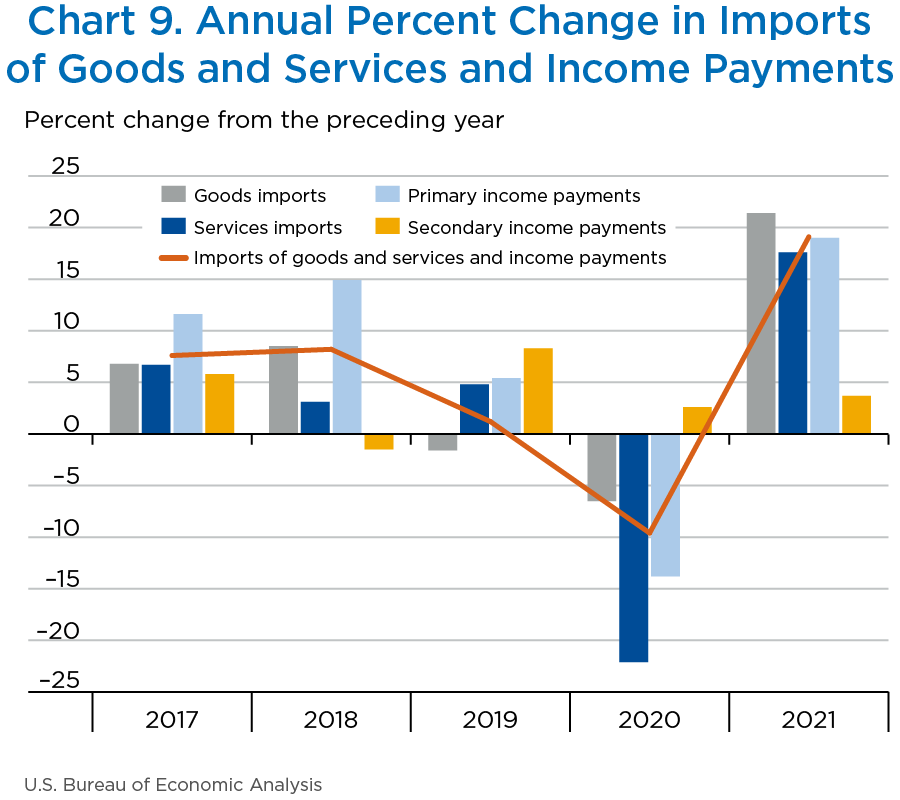
Exports of goods and services to, and income received from, foreign residents increased $535.1 billion to $3.79 trillion in 2021. Imports of goods and services from, and income paid to, foreign residents increased $740.6 billion to $4.62 trillion (charts 8 and 9 and table F).
Trade in goods
Exports of goods increased $332.9 billion to $1.76 trillion, and imports of goods increased $502.3 billion to $2.85 trillion. The increases in both exports and imports reflected increases in all major categories, led by industrial supplies and materials, mainly petroleum and products.
Trade in services
Exports of services increased $65.6 billion to $771.2 billion, mainly reflecting increases in other business services, mostly professional and management consulting services, in financial services, mostly financial management services and credit card and other credit-related services, and in charges for the use of intellectual property, mostly licenses for the use of outcomes of research and development. Imports of services increased $80.9 billion to $541.2 billion, mainly reflecting increases in transport, mostly sea freight transport, and in travel, mostly other personal travel.
Primary income
Receipts of primary income increased $132.9 billion to $1.09 trillion, and payments of primary income increased $146.5 billion to $915.9 billion. The increases in both receipts and payments mostly reflected an increase in direct investment income, primarily earnings.
Secondary income
Receipts of secondary income increased $3.6 billion to $170.0 billion, reflecting an increase in general government transfers, mostly taxes on income. Payments of secondary income increased $10.9 billion to $305.1 billion, reflecting increases in general government transfers, primarily international cooperation, and in private transfers, led by insurance-related transfers.
[Click chart to expand]
[Click chart to expand]
| Series | 2018 | 2019 | 2020 | 2021 p | Change 2020 to 2021 |
|---|---|---|---|---|---|
| Current account | |||||
| Exports of goods and services and income receipts (credits) | 3,793,642 | 3,812,458 | 3,258,642 | 3,793,730 | 535,088 |
| Exports of goods | 1,676,913 | 1,652,072 | 1,428,798 | 1,761,709 | 332,911 |
| Foods, feeds, and beverages | 133,144 | 130,993 | 139,335 | 165,216 | 25,881 |
| Industrial supplies and materials | 536,866 | 526,410 | 450,372 | 615,497 | 165,125 |
| Capital goods except automotive | 563,438 | 547,954 | 460,493 | 519,783 | 59,290 |
| Automotive vehicles, parts, and engines | 158,833 | 162,752 | 127,918 | 143,603 | 15,685 |
| Consumer goods except food and automotive | 205,513 | 204,976 | 173,974 | 221,557 | 47,583 |
| Other general merchandise | 56,835 | 59,146 | 51,693 | 63,671 | 11,978 |
| Net exports of goods under merchanting | 338 | 491 | 984 | 986 | 2 |
| Nonmonetary gold | 21,947 | 19,351 | 24,030 | 31,395 | 7,365 |
| Exports of services | 861,725 | 876,295 | 705,643 | 771,247 | 65,604 |
| Manufacturing services on physical inputs owned by others | n.a. | n.a. | n.a. | n.a. | n.a. |
| Maintenance and repair services n.i.e. | 28,036 | 27,698 | 13,278 | 12,048 | −1,230 |
| Transport | 93,107 | 91,017 | 56,706 | 65,044 | 8,338 |
| Travel (for all purposes including education) | 200,724 | 199,364 | 72,813 | 68,759 | −4,054 |
| Construction | 2,842 | 3,127 | 2,349 | 2,797 | 448 |
| Insurance services | 19,118 | 18,528 | 20,431 | 22,672 | 2,241 |
| Financial services | 132,448 | 136,046 | 144,343 | 164,088 | 19,745 |
| Charges for the use of intellectual property n.i.e. | 114,819 | 115,529 | 113,779 | 124,827 | 11,048 |
| Telecommunications, computer, and information services | 49,245 | 54,766 | 56,682 | 58,142 | 1,460 |
| Other business services | 176,540 | 185,573 | 183,180 | 206,542 | 23,362 |
| Personal, cultural, and recreational services | 22,715 | 22,193 | 20,442 | 22,965 | 2,523 |
| Government goods and services n.i.e. | 22,131 | 22,453 | 21,642 | 23,364 | 1,722 |
| Primary income receipts | 1,106,417 | 1,124,929 | 957,857 | 1,090,789 | 132,932 |
| Direct investment income | 585,260 | 569,102 | 495,722 | 613,910 | 118,188 |
| Portfolio investment income | 412,496 | 424,433 | 383,260 | 412,735 | 29,475 |
| Other investment income | 101,088 | 123,357 | 72,123 | 57,530 | −14,593 |
| Reserve asset income | 632 | 873 | 255 | −84 | −339 |
| Compensation of employees | 6,941 | 7,163 | 6,497 | 6,698 | 201 |
| Secondary income (current transfer) receipts | 148,587 | 159,162 | 166,344 | 169,986 | 3,642 |
| Imports of goods and services and income payments (debits) | 4,231,878 | 4,284,604 | 3,874,737 | 4,615,364 | 740,627 |
| Imports of goods | 2,555,662 | 2,513,587 | 2,350,825 | 2,853,093 | 502,268 |
| Foods, feeds, and beverages | 148,257 | 151,559 | 155,449 | 183,301 | 27,852 |
| Industrial supplies and materials | 580,206 | 525,562 | 430,058 | 640,761 | 210,703 |
| Capital goods except automotive | 694,229 | 679,126 | 648,503 | 766,303 | 117,800 |
| Automotive vehicles, parts, and engines | 372,009 | 376,016 | 311,305 | 348,223 | 36,918 |
| Consumer goods except food and automotive | 647,659 | 655,517 | 641,055 | 767,563 | 126,508 |
| Other general merchandise | 102,104 | 113,855 | 102,790 | 121,194 | 18,404 |
| Nonmonetary gold | 11,197 | 11,952 | 61,665 | 25,747 | −35,918 |
| Imports of services | 563,926 | 591,121 | 460,301 | 541,245 | 80,944 |
| Manufacturing services on physical inputs owned by others | n.a. | n.a. | n.a. | n.a. | n.a. |
| Maintenance and repair services n.i.e. | 7,354 | 8,866 | 6,090 | 7,514 | 1,424 |
| Transport | 110,441 | 112,798 | 72,411 | 104,806 | 32,395 |
| Travel (for all purposes including education) | 126,139 | 133,285 | 35,808 | 57,940 | 22,132 |
| Construction | 3,077 | 1,377 | 1,131 | 1,262 | 131 |
| Insurance services | 43,797 | 51,632 | 55,617 | 57,658 | 2,041 |
| Financial services | 39,445 | 41,210 | 42,256 | 44,966 | 2,710 |
| Charges for the use of intellectual property n.i.e. | 42,736 | 41,730 | 42,984 | 46,849 | 3,865 |
| Telecommunications, computer, and information services | 41,701 | 42,961 | 38,594 | 41,358 | 2,764 |
| Other business services | 107,435 | 112,776 | 117,673 | 126,780 | 9,107 |
| Personal, cultural, and recreational services | 18,825 | 20,486 | 23,185 | 26,952 | 3,767 |
| Government goods and services n.i.e. | 22,975 | 24,000 | 24,553 | 25,160 | 607 |
| Primary income payments | 847,286 | 893,009 | 769,397 | 915,881 | 146,484 |
| Direct investment income | 235,306 | 232,877 | 179,196 | 304,322 | 125,126 |
| Portfolio investment income | 488,208 | 506,767 | 489,189 | 525,707 | 36,518 |
| Other investment income | 106,548 | 134,460 | 86,582 | 69,957 | −16,625 |
| Compensation of employees | 17,223 | 18,904 | 14,429 | 15,895 | 1,466 |
| Secondary income (current transfer) payments | 265,004 | 286,887 | 294,215 | 305,144 | 10,929 |
| Balances | 0 | ||||
| Balance on current account | −438,236 | −472,146 | −616,095 | −821,634 | −205,539 |
| Balance on goods | −878,749 | −861,515 | −922,026 | −1,091,384 | −169,358 |
| Balance on services | 297,799 | 285,174 | 245,342 | 230,001 | −15,341 |
| Balance on primary income | 259,131 | 231,920 | 188,460 | 174,907 | −13,553 |
| Balance on secondary income | −116,417 | −127,725 | −127,871 | −135,158 | −7,287 |
- p
- Preliminary
- n.a.
- Not available
- n.i.e.
- Not included elsewhere
Note. The statistics are presented in table 1.2 on BEA's website.
Net financial-account transactions were −$687.1 billion in 2021, reflecting net U.S. borrowing from foreign residents (table G).
Financial assets
Transactions in 2021 increased U.S. residents' foreign financial assets by $1.21 trillion. Transactions increased portfolio investment assets, mostly long-term debt securities, by $604.1 billion; direct investment assets, mostly equity, by $501.3 billion; and reserve assets, primarily special drawing rights (SDRs), by $114.0 billion. Transactions decreased other investment assets by $6.1 billion, resulting from large and mostly offsetting transactions in deposits and loans. The increase in SDRs reflects the U.S. share of the $650 billion SDR allocation that was approved by the Board of Governors of the International Monetary Fund (IMF) in the third quarter. The SDR is an international reserve asset created by the IMF to supplement its member countries' official reserves; it can be exchanged between members for currencies, such as the U.S. dollar, the euro, or the yen.
Liabilities
Transactions in 2021 increased U.S. liabilities to foreign residents by $1.86 trillion. Transactions increased other investment liabilities, mostly loans and deposits, by $825.9 billion; portfolio investment liabilities, mainly long-term debt securities, by $583.2 billion; and direct investment liabilities, mostly equity, by $449.6 billion.
Financial derivatives
Net transactions in financial derivatives were −$41.7 billion in 2021, reflecting net U.S. borrowing from foreign residents.
| Series | 2018 | 2019 | 2020 | 2021 p | Change 2020 to 2021 |
|---|---|---|---|---|---|
| Capital account | |||||
| Capital transfer receipts and other credits | 3,281 | 72 | 371 | 3,850 | 3,479 |
| Capital transfer payments and other debits | 7,541 | 6,515 | 5,859 | 6,296 | 437 |
| Financial account | |||||
| Net U.S. acquisition of financial assets excluding financial derivatives (net increase in assets / financial outflow (+)) | 383,815 | 317,017 | 809,323 | 1,213,323 | 404,000 |
| Direct investment assets | −130,015 | 122,191 | 311,692 | 501,289 | 189,597 |
| Equity | −218,628 | 156,684 | 330,871 | 460,513 | 129,642 |
| Equity other than reinvestment of earnings | 75,309 | 17,667 | 134,796 | 80,570 | −54,226 |
| Reinvestment of earnings | −293,937 | 139,017 | 196,076 | 379,943 | 183,867 |
| Debt instruments | 88,613 | −34,494 | −19,180 | 40,776 | 59,956 |
| Portfolio investment assets | 335,263 | −13,479 | 220,026 | 604,136 | 384,110 |
| Equity and investment fund shares | 171,300 | −163,363 | 241,787 | 153,875 | −87,912 |
| Debt securities | 163,962 | 149,885 | −21,762 | 450,261 | 472,023 |
| Short term | 14,298 | 135,578 | −53,805 | 43,701 | 97,506 |
| Long term | 149,665 | 14,307 | 32,043 | 406,560 | 374,517 |
| Other investment assets | 173,578 | 203,647 | 268,632 | −6,095 | −274,727 |
| Currency and deposits | 106,125 | 132,391 | 92,893 | −75,284 | −168,177 |
| Loans | 64,945 | 68,722 | 182,202 | 66,129 | −116,073 |
| Trade credit and advances | 1,179 | 1,166 | −8,311 | 1,854 | 10,165 |
| Reserve assets | 4,989 | 4,659 | 8,974 | 113,993 | 105,019 |
| Monetary gold | 0 | 0 | 0 | 0 | 0 |
| Special drawing rights | 156 | 237 | 81 | 113,685 | 113,604 |
| Reserve position in the International Monetary Fund | 4,824 | 4,271 | 8,814 | 460 | −8,354 |
| Other reserve assets | 10 | 150 | 78 | −153 | −231 |
| Net U.S. incurrence of liabilities excluding financial derivatives (net increase in liabilities / financial inflow (+)) | 711,777 | 755,724 | 1,456,528 | 1,858,757 | 402,229 |
| Direct investment liabilities | 214,315 | 302,200 | 211,298 | 449,608 | 238,310 |
| Equity | 318,545 | 262,483 | 198,291 | 392,755 | 194,464 |
| Equity other than reinvestment of earnings | 200,122 | 137,758 | 115,798 | 178,006 | 62,208 |
| Reinvestment of earnings | 118,423 | 124,725 | 82,493 | 214,750 | 132,257 |
| Debt instruments | −104,230 | 39,717 | 13,007 | 56,853 | 43,846 |
| Portfolio investment liabilities | 303,075 | 177,157 | 710,151 | 583,239 | −126,912 |
| Equity and investment fund shares | 156,916 | −244,098 | 648,399 | −8,483 | −656,882 |
| Debt securities | 146,159 | 421,255 | 61,752 | 591,722 | 529,970 |
| Short term | 30,353 | −33,144 | 272,452 | −26,088 | −298,540 |
| Long term | 115,806 | 454,399 | −210,700 | 617,811 | 828,511 |
| Other investment liabilities | 194,387 | 276,368 | 535,079 | 825,909 | 290,830 |
| Currency and deposits | 12,656 | 204,250 | 323,595 | 313,191 | −10,404 |
| Loans | 165,787 | 62,052 | 198,920 | 380,561 | 181,641 |
| Trade credit and advances | 15,943 | 10,066 | 12,564 | 19,324 | 6,760 |
| Special drawing rights allocations | 0 | 0 | 0 | 112,834 | 112,834 |
| Financial derivatives other than reserves, net transactions | −20,404 | −41,670 | −5,780 | −41,669 | −35,889 |
| Statistical discrepancy | |||||
| Statistical discrepancy1 | 94,131 | −1,788 | −31,403 | 136,977 | 168,380 |
| Balances | |||||
| Balance on capital account | −4,261 | −6,443 | −5,487 | −2,446 | 3,041 |
| Net lending (+) or net borrowing (−) from current- and capital-account transactions2 | −442,497 | −478,589 | −621,582 | −824,080 | −202,498 |
| Net lending (+) or net borrowing (−) from financial-account transactions3 | −348,366 | −480,377 | −652,985 | −687,103 | −34,118 |
- p
- Preliminary
- r
- Revised
- n.a.
- Not available
- The statistical discrepancy is the difference between net acquisition of assets and net incurrence of liabilities in the financial account (including financial derivatives) less the difference between total credits and total debits recorded in the current and capital accounts.
- Sum of current-account balance (table F) and capital-account balance.