
Annual Update of the U.S. International Transactions Accounts
In June 2022, the U.S. Bureau of Economic Analysis (BEA) released the results of the 2022 annual update of the U.S. International Transactions Accounts (ITAs).1 With this update, BEA has incorporated newly available and revised source data for 2019–2021 and updated seasonal adjustments for 2017–2021 for most statistical series. In addition, there were three updates that are beyond the scope of updated source data and seasonal adjustments:
- Financial services exports and imports and related withholding taxes for 2015–2021 were revised to incorporate the results of BEA's 2019 Benchmark Survey of Financial Services Transactions Between U.S. Financial Services Providers and Foreign Persons.
- Transactions and income for short-term portfolio investment assets for 2012–2021 were revised to incorporate improved methodology and source data for foreign commercial paper (FCP) and other short-term securities (OSTS).
- Transactions and income for long-term portfolio investment assets and liabilities for 2019–2021 were revised to address a large series break in the source data for holdings of long-term portfolio investment.
With this annual update, BEA has also introduced new standard ITA tables that feature statistics on special purpose entities (SPEs) and expanded geographical detail for statistics on trade in goods and services. These improvements, along with the incorporation of newly available and revised source data (including the benchmark survey) and seasonal adjustments, serve to provide more accurate, consistent, and relevant statistics for data users.
For 2012–2021, this annual update has not altered the overall picture of U.S. international transactions. Revisions to the current-account deficit did not alter the direction of change (increase or decrease) for any of the revised years (table A and chart 1). Revisions to net borrowing from financial-account transactions did not alter the direction of change for most of the revised years; exceptions were for 2016–2018 (chart 2).
The next section of this article discusses the incorporation of the benchmark survey of financial services transactions, the improved methodology and source data for FCP and OSTS, the revisions related to a large series break in long-term portfolio investment holdings' source data, new statistics on SPEs, and expanded geographical detail on trade. The final section summarizes the effects of the revisions on the current account, the financial account, and the statistical discrepancy of the ITAs.
Appendix A provides a numerical summary of quarterly revisions to key ITA balances. For a comparison of this year's revisions with revisions from past annual updates, see the box “2022 Annual Update in Historical Context.” The U.S. International Economic Accounts: Concepts and Methods has been updated to reflect changes implemented with this annual update.
| Balances and statistical discrepancy | 2012 | 2013 | 2014 | 2015 | 2016 | 2017 | 2018 | 2019 | 2020 | 2021 |
|---|---|---|---|---|---|---|---|---|---|---|
| Balance on current account (line 109): | ||||||||||
| Revised | −418.2 | −339.5 | −370.1 | −408.5 | −396.2 | −361.0 | −439.9 | −446.0 | −619.7 | −846.4 |
| Previously published | −418.1 | −339.5 | −370.0 | −408.9 | −397.6 | −361.7 | −438.2 | −472.1 | −616.1 | −821.6 |
| Amount of revision | −0.1 | −0.1 | −0.1 | 0.4 | 1.4 | 0.7 | −1.6 | 26.2 | −3.6 | −24.7 |
| Balance on goods and services (line 110): | ||||||||||
| Revised | −525.9 | −446.9 | −484.0 | −490.8 | −479.5 | −510.3 | −578.6 | −559.7 | −654.0 | −845.0 |
| Previously published | −525.9 | −446.9 | −484.0 | −491.4 | −481.5 | −512.7 | −581.0 | −576.3 | −676.7 | −861.4 |
| Amount of revision | 0.0 | 0.0 | 0.0 | 0.6 | 2.0 | 2.4 | 2.4 | 16.7 | 22.7 | 16.3 |
| Balance on primary income (line 113): | ||||||||||
| Revised | 197.9 | 195.5 | 200.2 | 185.2 | 196.4 | 257.9 | 255.3 | 243.6 | 163.1 | 139.5 |
| Previously published | 197.9 | 195.5 | 200.3 | 185.4 | 197.0 | 259.5 | 259.1 | 231.9 | 188.5 | 174.9 |
| Amount of revision | −0.1 | −0.1 | −0.1 | −0.2 | −0.6 | −1.6 | −3.9 | 11.6 | −25.4 | −35.4 |
| Balance on secondary income (line 114): | ||||||||||
| Revised | −90.1 | −88.1 | −86.3 | −102.9 | −113.2 | −108.6 | −116.5 | −129.8 | −128.8 | −140.8 |
| Previously published | −90.1 | −88.1 | −86.3 | −102.8 | −113.1 | −108.5 | −116.4 | −127.7 | −127.9 | −135.2 |
| Amount of revision | 0.0 | 0.0 | 0.0 | (*) | −0.1 | −0.1 | −0.1 | −2.1 | −0.9 | −5.6 |
| Balance on capital account (line 115): | ||||||||||
| Revised | 0.9 | −6.6 | −6.5 | −7.9 | −6.6 | 12.4 | −4.3 | −6.5 | −5.5 | −2.5 |
| Previously published | 0.9 | −6.6 | −6.5 | −7.9 | −6.6 | 12.4 | −4.3 | −6.4 | −5.5 | −2.4 |
| Amount of revision | 0.0 | 0.0 | 0.0 | 0.0 | 0.0 | 0.0 | 0.0 | (*) | (*) | (*) |
| Net lending (+) or net borrowing (−) from financial-account transactions (line 117): | ||||||||||
| Revised | −453.6 | −423.7 | −298.1 | −386.4 | −362.4 | −373.2 | −302.9 | −565.5 | −697.0 | −740.6 |
| Previously published | −448.0 | −400.1 | −297.1 | −333.1 | −363.6 | −344.6 | −348.4 | −480.4 | −653.0 | −687.1 |
| Amount of revision | −5.6 | −23.6 | −1.0 | −53.3 | 1.2 | −28.6 | 45.5 | −85.1 | −44.0 | −53.5 |
| Statistical discrepancy (line 108): | ||||||||||
| Revised | −36.4 | −77.6 | 78.5 | 30.0 | 40.4 | −24.6 | 141.2 | −113.1 | −71.8 | 108.2 |
| Previously published | −30.8 | −54.1 | 79.4 | 83.7 | 40.5 | 4.7 | 94.1 | −1.8 | −31.4 | 137.0 |
| Amount of revision | −5.5 | −23.5 | −0.9 | −53.7 | −0.2 | −29.3 | 47.1 | −111.3 | −40.3 | −28.7 |
- (*)
- Transactions between +/− $50,000,000.
Note. Line numbers refer to ITA table 1.2 on BEA's website.

[Click chart to expand]

[Click chart to expand]
Results from the 2019 Benchmark Survey of Financial Services Transactions Between U.S. Financial Services Providers and Foreign Persons
BEA collects information on trade in services through mandatory surveys of U.S. companies. In addition to quarterly surveys that collect information from a sample of companies whose transactions are accounted for in the ITAs, BEA also conducts benchmark surveys every 5 years to collect information from the entire population—or universe—of services trading companies.2 BEA extrapolates data from benchmark surveys for companies that are not required to report on the sample surveys using trends in the data of companies that report on the sample surveys. Therefore, statistical coverage is complete whether the periods are covered by benchmark surveys or only sample surveys.
Financial services exports and imports and taxes on financial services exports and imports in secondary income receipts and payments for 2015–2021 were revised to incorporate the results of BEA's 2019 Benchmark Survey of Financial Services Transactions Between U.S. Financial Services Providers and Foreign Persons. This survey covered all U.S. financial services providers that engaged in financial services transactions with foreign persons. Estimates for 2015–2021 financial services exports and imports and related taxes, which were previously based on both the 2014 benchmark survey and the quarterly surveys, have been replaced with estimates that are informed by the results of the 2019 benchmark survey.
Improved methodology and source data for FCP and OSTS
BEA has implemented changes to the methodology and source data for estimating transactions and income for FCP and OSTS, which are mainly short-term notes.
Previously, BEA used Depository Trust & Clearing Corporation (DTCC) data on FCP placements in the U.S. commercial paper market to estimate FCP positions, transactions, and income. BEA began using this source in the 1990s before comparable data were available elsewhere. The Treasury International Capital (TIC) reporting system has collected quarterly data on U.S. holdings of FCP and OSTS since 2003. In the TIC reports, FCP and OSTS data are commingled on a country-level basis, and there is a memorandum item for FCP claims on all countries combined. BEA estimates holdings of OSTS by subtracting the DTCC-based holdings of FCP from the commingled TIC data for each country, assuming the OSTS amount is zero if the FCP estimate for a given country is larger than the TIC value.
There have been substantial enhancements to TIC reporting of FCP and OSTS since 2003 when the TIC system began providing quarterly data to BEA. Recent investigation by the Federal Reserve Board suggests that TIC data on FCP held by U.S. residents are now more accurate than BEA estimates, which are based on DTCC FCP market placements that assume U.S. residents hold all FCP issued in the U.S. market.
With this annual update, BEA has replaced DTCC data with TIC data as the source data for estimating positions, transactions, and income for both FCP and OSTS, beginning with statistics for 2012. BEA derived FCP country-level positions by computing the ratio of the FCP memorandum item to the commingled TIC data and applying the ratio to the country-level positions. OSTS country-level positions were calculated as the difference between commingled country positions and the derived FCP country-level positions. Transactions were calculated as the difference between end-of-period and beginning-of-period positions. Income was calculated by multiplying average positions by representative interest rates. This improvement resulted in revisions to transactions and income in the ITAs and to positions (in the IIP Accounts) for short-term portfolio investment assets.
Revisions related to large source data revisions for long-term portfolio investment
For long-term portfolio investment assets and liabilities, BEA revised transactions for 2019–2021 to address a large series break in the source data provided to BEA on holdings of long-term portfolio investment that resulted from unusually large data revisions by respondents on the monthly “Aggregate Holdings of Long-Term Securities by U.S. and Foreign Residents” (SLT) report for June 2021.
BEA uses the SLT data on holdings of portfolio investment to estimate transactions and income for the ITAs. With this annual update, BEA has allocated the upward revision to holdings among eight quarters to indicate that the securities were accumulated over time, even though the SLT source data were not revised prior to June 2021. BEA applied a straight-line interpolation method to selected investment categories for countries with large revisions in the June 2021 data. Transactions and income were revised upward for the third quarter of 2019 to the second quarter of 2021 to reflect the increased holdings. For more information about the SLT revisions, see footnote 5 in the “Footnotes and Notices” section of “Securities (B): Portfolio Holdings of U.S. and Foreign Securities.”
New statistics on SPEs
With the December 2021 releases of the ITAs and the IIP Accounts, BEA introduced new ITA tables 4.6 and 6.3 that feature annual statistics on U.S. SPEs—that is, U.S. legal entities with little or no employment or physical presence—to fulfill a commitment to the International Monetary Fund Task Force on Special Purpose Entities (TFSPE). Table 4.6 presents primary income on direct investment in SPEs, and table 6.3 presents financial transactions for direct investment in SPEs. With this annual update, BEA has expanded the scope of the tables to include annual statistics on U.S.-owned foreign SPEs—that is, foreign legal entities with little or no employment or physical presence. BEA's SPE statistics now cover both foreign SPE affiliates of U.S. multinational enterprises (MNEs) and U.S. SPE affiliates of foreign MNEs, beginning with annual statistics for 2019. Going forward, BEA will release and update these annual statistics each March and June, respectively.
MNEs increasingly set up complex global structures to maximize their worldwide profits. These structures include SPEs that can be set up to take advantage of different tax or regulatory regimes. The increased prevalence of SPEs heightens the need for separate statistics on their activities for analysis and for improved interpretability of macroeconomic statistics.
BEA's statistics on SPEs are compiled using its surveys of direct investment. Financial and operating data reported on the Annual and Benchmark Surveys of U.S. Direct Investment Abroad and Foreign Direct Investment in the United States are used to identify SPEs in the Quarterly Surveys of U.S. Direct Investment Abroad and Foreign Direct Investment in the United States. Based on guidelines from the TFSPE, BEA identifies entities as SPEs using the following criteria:
- Majority-owned by their U.S. or foreign parent(s)
- Zero to five employees
- Less than $1 million of gross property, plant, and equipment
- Less than 10 percent of total sales to local customers
Additional country detail
With this annual update, selected ITA tables that present statistics by geography were expanded to include additional countries. ITA table 2.2, which presents seasonally adjusted trade in goods by selected countries and areas, and ITA table 3.2, which presents seasonally adjusted trade in services by selected countries and areas, were expanded to include Australia, Belgium, Ireland, Israel, Malaysia, the Netherlands, Switzerland, and Vietnam. In addition, ITA table 2.3, which presents not seasonally adjusted trade in goods by selected countries and areas, was expanded to include Vietnam. Statistics for the added countries in all three tables are mostly available beginning with 1999. Exceptions are in ITA table 3.2 in which annual statistics for Ireland and Vietnam begin with 2006 and quarterly statistics for Ireland, Israel, Malaysia, Switzerland, and Vietnam begin with 2013.
Current-account statistics were updated to incorporate newly available and revised source data and the improvements described above for 2012–2021 and updated seasonal factors, which only affected quarterly statistics, for 2017–2021 (table B). The revisions to the quarterly statistics did not affect the direction (increase or decrease) of the quarter-to-quarter changes in the current-account deficit for 2012–2021 (chart 3). For most quarters, the revisions also did not significantly affect the magnitude of the quarter-to-quarter changes in the current-account deficit.
| Selected current-account transactions | 2012 | 2013 | 2014 | 2015 | 2016 | 2017 | 2018 | 2019 | 2020 | 2021 |
|---|---|---|---|---|---|---|---|---|---|---|
| Exports of goods and services and income receipts (line 1): | ||||||||||
| Revised | 3,151.1 | 3,250.4 | 3,379.1 | 3,238.6 | 3,239.2 | 3,550.4 | 3,794.0 | 3,839.7 | 3,260.1 | 3,780.2 |
| Previously published | 3,151.2 | 3,250.5 | 3,379.1 | 3,238.0 | 3,237.3 | 3,548.3 | 3,793.6 | 3,812.5 | 3,258.6 | 3,793.7 |
| Amount of revision | −0.1 | −0.1 | −0.1 | 0.6 | 1.9 | 2.1 | 0.4 | 27.3 | 1.5 | −13.6 |
| Exports of goods (line 3): | ||||||||||
| Revised | 1,562.6 | 1,593.7 | 1,635.6 | 1,511.4 | 1,457.4 | 1,557.0 | 1,676.9 | 1,655.1 | 1,432.2 | 1,761.4 |
| Previously published | 1,562.6 | 1,593.7 | 1,635.6 | 1,511.4 | 1,457.4 | 1,557.0 | 1,676.9 | 1,652.1 | 1,428.8 | 1,761.7 |
| Amount of revision | 0.0 | 0.0 | 0.0 | 0.0 | 0.0 | 0.0 | 0.0 | 3.0 | 3.4 | −0.3 |
| Exports of services (line 13): | ||||||||||
| Revised | 684.8 | 719.4 | 757.1 | 769.4 | 783.4 | 837.5 | 865.5 | 891.2 | 726.4 | 795.3 |
| Previously published | 684.8 | 719.4 | 757.1 | 768.7 | 780.9 | 833.8 | 861.7 | 876.3 | 705.6 | 771.2 |
| Amount of revision | 0.0 | 0.0 | 0.0 | 0.7 | 2.5 | 3.7 | 3.8 | 14.9 | 20.8 | 24.0 |
| Financial services | 0.0 | 0.0 | 0.0 | 0.7 | 2.5 | 3.7 | 3.8 | 6.5 | 6.7 | 7.7 |
| Professional and management consulting services | 0.0 | 0.0 | 0.0 | 0.0 | 0.0 | 0.0 | 0.0 | 0.9 | 4.9 | 5.9 |
| Technical, trade-related, and other business services | 0.0 | 0.0 | 0.0 | 0.0 | 0.0 | 0.0 | 0.0 | 1.9 | 7.2 | 5.6 |
| Other services | 0.0 | 0.0 | 0.0 | 0.0 | 0.0 | 0.0 | 0.0 | 5.6 | 2.1 | 4.9 |
| Primary income receipts (line 26): | ||||||||||
| Revised | 791.6 | 811.5 | 845.9 | 824.9 | 857.2 | 995.4 | 1,103.0 | 1,136.8 | 936.2 | 1,052.1 |
| Previously published | 791.7 | 811.6 | 845.9 | 825.1 | 857.8 | 997.0 | 1,106.4 | 1,124.9 | 957.9 | 1,090.8 |
| Amount of revision | −0.1 | −0.1 | −0.1 | −0.2 | −0.6 | −1.6 | −3.5 | 11.9 | −21.6 | −38.7 |
| Direct investment income | 0.0 | 0.0 | 0.0 | 0.0 | 0.0 | 0.0 | −0.7 | 14.3 | −21.1 | −31.1 |
| Portfolio investment income | −0.1 | −0.1 | −0.1 | −0.2 | −0.6 | −1.6 | −2.7 | −3.3 | −3.1 | −9.5 |
| Other primary income | 0.0 | 0.0 | 0.0 | 0.0 | 0.0 | 0.0 | 0.0 | 0.9 | 2.6 | 1.9 |
| Secondary income receipts (line 33): | ||||||||||
| Revised | 112.1 | 125.8 | 140.6 | 132.9 | 141.1 | 160.5 | 148.6 | 156.7 | 165.2 | 171.4 |
| Previously published | 112.1 | 125.8 | 140.6 | 132.9 | 141.1 | 160.5 | 148.6 | 159.2 | 166.3 | 170.0 |
| Amount of revision | 0.0 | 0.0 | 0.0 | (*) | (*) | (*) | (*) | −2.5 | −1.1 | 1.5 |
| Taxes on income, wealth, etc. | 0.0 | 0.0 | 0.0 | (*) | (*) | (*) | (*) | −0.8 | 0.3 | −0.1 |
| Other secondary income | 0.0 | 0.0 | 0.0 | 0.0 | 0.0 | 0.0 | 0.0 | −1.8 | −1.4 | 1.5 |
| Imports of goods and services and income payments (line 34): | ||||||||||
| Revised | 3,569.3 | 3,589.9 | 3,749.1 | 3,647.0 | 3,635.4 | 3,911.5 | 4,233.9 | 4,285.7 | 3,879.8 | 4,626.5 |
| Previously published | 3,569.3 | 3,589.9 | 3,749.1 | 3,646.9 | 3,634.9 | 3,910.1 | 4,231.9 | 4,284.6 | 3,874.7 | 4,615.4 |
| Amount of revision | 0.0 | 0.0 | 0.0 | 0.1 | 0.5 | 1.4 | 2.0 | 1.1 | 5.1 | 11.1 |
| Imports of goods (line 36): | ||||||||||
| Revised | 2,303.7 | 2,294.2 | 2,385.5 | 2,273.2 | 2,207.2 | 2,356.3 | 2,555.7 | 2,512.4 | 2,346.1 | 2,851.7 |
| Previously published | 2,303.7 | 2,294.2 | 2,385.5 | 2,273.2 | 2,207.2 | 2,356.3 | 2,555.7 | 2,513.6 | 2,350.8 | 2,853.1 |
| Amount of revision | 0.0 | 0.0 | 0.0 | 0.0 | 0.0 | 0.0 | 0.0 | −1.2 | −4.7 | −1.4 |
| Imports of services (line 45): | ||||||||||
| Revised | 469.6 | 465.7 | 491.1 | 498.3 | 513.1 | 548.5 | 565.4 | 593.6 | 466.5 | 550.0 |
| Previously published | 469.6 | 465.7 | 491.1 | 498.2 | 512.6 | 547.2 | 563.9 | 591.1 | 460.3 | 541.2 |
| Amount of revision | 0.0 | 0.0 | 0.0 | 0.1 | 0.5 | 1.3 | 1.5 | 2.5 | 6.2 | 8.8 |
| Financial services | 0.0 | 0.0 | 0.0 | 0.1 | 0.5 | 1.3 | 1.9 | 3.2 | 3.1 | 4.6 |
| Other services | 0.0 | 0.0 | 0.0 | 0.0 | 0.0 | 0.0 | −0.4 | −0.7 | 3.2 | 4.2 |
| Primary income payments (line 58): | ||||||||||
| Revised | 593.8 | 616.0 | 645.6 | 639.7 | 660.8 | 737.5 | 847.7 | 893.2 | 773.1 | 912.6 |
| Previously published | 593.8 | 616.0 | 645.6 | 639.7 | 660.8 | 737.5 | 847.3 | 893.0 | 769.4 | 915.9 |
| Amount of revision | 0.0 | 0.0 | 0.0 | 0.0 | 0.0 | 0.0 | 0.4 | 0.2 | 3.7 | −3.3 |
| Direct investment income | 0.0 | 0.0 | 0.0 | 0.0 | 0.0 | 0.0 | 0.4 | −2.3 | −0.8 | −1.2 |
| Portfolio investment income | 0.0 | 0.0 | 0.0 | 0.0 | 0.0 | 0.0 | (*) | 1.2 | 3.1 | −3.9 |
| Other primary income | 0.0 | 0.0 | 0.0 | 0.0 | 0.0 | 0.0 | 0.0 | 1.4 | 1.5 | 1.8 |
| Secondary income payments (line 64): | ||||||||||
| Revised | 202.2 | 213.9 | 226.9 | 235.7 | 254.3 | 269.1 | 265.1 | 286.5 | 294.0 | 312.2 |
| Previously published | 202.2 | 213.9 | 226.9 | 235.7 | 254.2 | 269.0 | 265.0 | 286.9 | 294.2 | 305.1 |
| Amount of revision | 0.0 | 0.0 | 0.0 | (*) | 0.1 | 0.1 | 0.1 | −0.4 | −0.2 | 7.1 |
| Insurance-related transfers | 0.0 | 0.0 | 0.0 | 0.0 | 0.0 | 0.0 | 0.0 | −1.1 | (*) | 4.6 |
| Taxes on income, wealth, etc. | 0.0 | 0.0 | 0.0 | (*) | 0.1 | 0.1 | 0.1 | 1.6 | 1.3 | 1.4 |
| Other secondary income | 0.0 | 0.0 | 0.0 | 0.0 | 0.0 | 0.0 | 0.0 | −0.9 | −1.5 | 1.1 |
- (*)
- Transactions between +/− $50,000,000.
Note. Line numbers refer to ITA table 1.2 on BEA's website.

[Click chart to expand]
Exports of goods and services and income receipts were revised for 2012–2022. Chart 4 presents the revisions by component. The upward revisions to services reflect newly available and revised source data from BEA's surveys of international services, particularly the financial services benchmark survey. The revisions to primary income reflect newly available and revised source data, particularly from BEA’s surveys of direct investment, as well as the improved methodology and source data for FCP and OSTS, which are components of portfolio investment income.

[Click chart to expand]
Imports of goods and services and income payments were revised for 2015–2021. Chart 5 presents the revisions by component. The upward revisions to services reflect newly available and revised source data from BEA's services surveys, particularly the financial services benchmark survey. The revisions to secondary income reflect the incorporation of updated insurance-related transfers from BEA's insurance services surveys. The revisions to primary income reflect the incorporation of the series break in the historical series for portfolio investment and newly available and revised source data.

[Click chart to expand]
Financial-account highlights
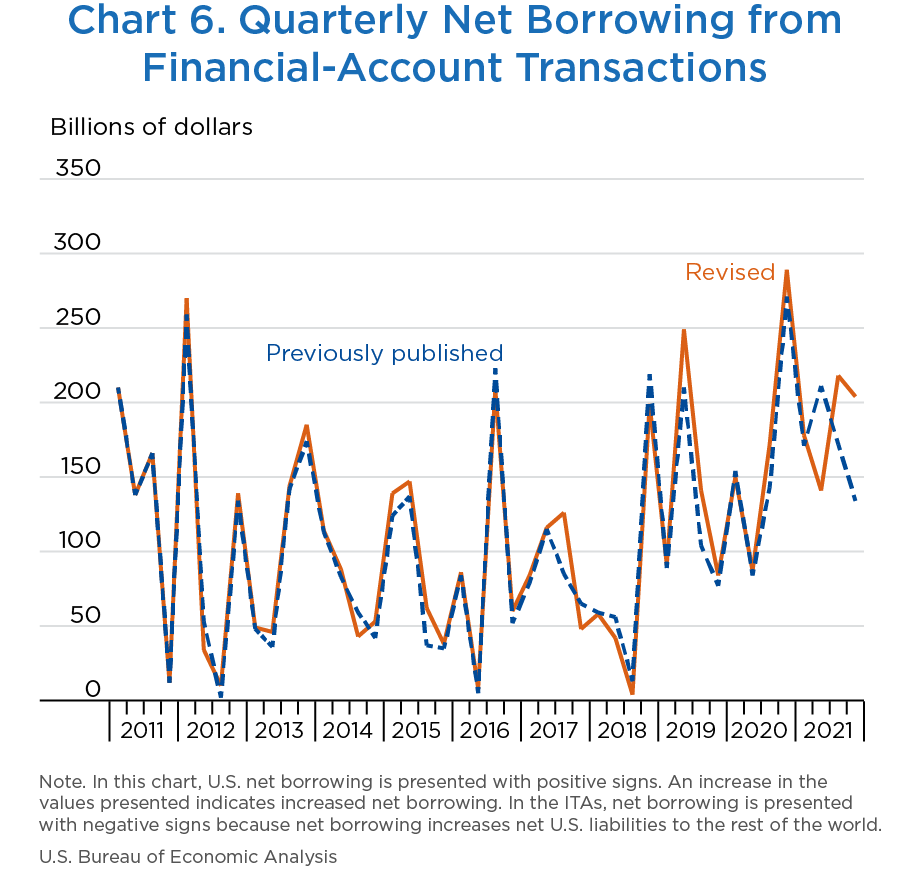
Financial-account statistics were updated to incorporate newly available and revised source data and the improvements described above for 2012–2021 and updated seasonal factors, which only affected quarterly statistics, for 2017–2021 (table C). For most quarters, the revisions to the quarterly statistics did not affect the direction (increase or decrease) of the quarter-to-quarter changes in net borrowing and did not significantly affect the magnitude of the quarter-to-quarter changes in net borrowing (chart 6).
Revisions to net borrowing reflect the combined revisions to net U.S. acquisition of financial assets excluding financial derivatives, to net U.S. incurrence of liabilities excluding financial derivatives, and to net transactions in financial derivatives. The revised annual and quarterly financial transactions for each of these major accounts are similar in size to the previously published financial transactions.
| Selected financial-account transactions | 2012 | 2013 | 2014 | 2015 | 2016 | 2017 | 2018 | 2019 | 2020 | 2021 |
|---|---|---|---|---|---|---|---|---|---|---|
| Net U.S. acquisition of financial assets excluding financial derivatives (net increase in assets/financial outflow (+)) (line 67): | ||||||||||
| Revised | 171.4 | 626.2 | 865.7 | 144.1 | 336.4 | 1,162.0 | 429.7 | 307.2 | 943.1 | 1,278.6 |
| Previously published | 176.9 | 649.8 | 866.7 | 197.4 | 335.2 | 1,190.6 | 383.8 | 317.0 | 809.3 | 1,213.3 |
| Amount of revision | −5.6 | −23.6 | −1.0 | −53.3 | 1.2 | −28.6 | 45.9 | −9.8 | 133.8 | 65.3 |
| Direct investment assets (line 68): | ||||||||||
| Revised | 377.2 | 392.8 | 387.5 | 302.1 | 299.8 | 409.4 | −130.7 | 105.7 | 271.8 | 421.7 |
| Previously published | 377.2 | 392.8 | 387.5 | 302.1 | 299.8 | 409.4 | −130.0 | 122.2 | 311.7 | 501.3 |
| Amount of revision | 0.0 | 0.0 | 0.0 | 0.0 | 0.0 | 0.0 | −0.7 | −16.5 | −39.9 | −79.5 |
| Portfolio investment assets (line 71): | ||||||||||
| Revised | 243.2 | 457.7 | 581.7 | 107.2 | 37.5 | 540.7 | 381.9 | −11.5 | 406.4 | 719.1 |
| Previously published | 248.8 | 481.3 | 582.7 | 160.4 | 36.3 | 569.4 | 335.3 | −13.5 | 220.0 | 604.1 |
| Amount of revision | −5.6 | −23.6 | −1.0 | −53.3 | 1.2 | −28.6 | 46.6 | 2.0 | 186.3 | 115.0 |
| Equity and investment fund shares (line 72): | ||||||||||
| Revised | 104.0 | 287.4 | 431.6 | 196.9 | 21.7 | 139.9 | 171.3 | −25.3 | 396.0 | 154.8 |
| Previously published | 104.0 | 287.4 | 431.6 | 196.9 | 21.7 | 139.9 | 171.3 | −163.4 | 241.8 | 153.9 |
| Amount of revision | 0.0 | 0.0 | 0.0 | 0.0 | 0.0 | 0.0 | 0.0 | 138.1 | 154.2 | 0.9 |
| Debt securities (line 73) | ||||||||||
| Short term (line 74): | ||||||||||
| Revised | −14.2 | 25.2 | 10.4 | −10.2 | −26.2 | 163.0 | 60.9 | −0.5 | −24.9 | 75.6 |
| Previously published | −8.6 | 48.8 | 11.4 | 43.0 | −27.4 | 191.7 | 14.3 | 135.6 | −53.8 | 43.7 |
| Amount of revision | −5.6 | −23.6 | −1.0 | −53.3 | 1.2 | −28.6 | 46.6 | −136.0 | 28.9 | 31.9 |
| Long term (line 75): | ||||||||||
| Revised | 153.4 | 145.1 | 139.7 | −79.6 | 42.0 | 237.8 | 149.7 | 14.3 | 35.3 | 488.7 |
| Previously published | 153.4 | 145.1 | 139.7 | −79.6 | 42.0 | 237.8 | 149.7 | 14.3 | 32.0 | 406.6 |
| Amount of revision | 0.0 | 0.0 | 0.0 | 0.0 | 0.0 | 0.0 | 0.0 | 0.0 | 3.3 | 82.1 |
| Other investment assets (line 76): | ||||||||||
| Revised | −453.5 | −221.2 | −99.9 | −258.8 | −3.0 | 213.5 | 173.6 | 208.3 | 256.0 | 23.8 |
| Previously published | −453.5 | −221.2 | −99.9 | −258.8 | −3.0 | 213.5 | 173.6 | 203.6 | 268.6 | −6.1 |
| Amount of revision | 0.0 | 0.0 | 0.0 | 0.0 | 0.0 | 0.0 | 0.0 | 4.7 | −12.7 | 29.9 |
| Net U.S. incurrence of liabilities excluding financial derivatives (net increase in liabilities/financial inflow (+)) (line 91): | ||||||||||
| Revised | 632.0 | 1,052.1 | 1,109.4 | 503.5 | 706.7 | 1,559.2 | 712.2 | 831.0 | 1,635.0 | 1,977.3 |
| Previously published | 632.0 | 1,052.1 | 1,109.4 | 503.5 | 706.7 | 1,559.2 | 711.8 | 755.7 | 1,456.5 | 1,858.8 |
| Amount of revision | 0.0 | 0.0 | 0.0 | 0.0 | 0.0 | 0.0 | 0.4 | 75.3 | 178.4 | 118.5 |
| Direct investment liabilities (line 92): | ||||||||||
| Revised | 250.3 | 288.1 | 251.9 | 511.4 | 474.4 | 380.8 | 214.7 | 314.7 | 148.9 | 448.3 |
| Previously published | 250.3 | 288.1 | 251.9 | 511.4 | 474.4 | 380.8 | 214.3 | 302.2 | 211.3 | 449.6 |
| Amount of revision | 0.0 | 0.0 | 0.0 | 0.0 | 0.0 | 0.0 | 0.4 | 12.5 | −62.4 | −1.3 |
| Portfolio investment liabilities (line 95): | ||||||||||
| Revised | 747.0 | 512.0 | 697.6 | 213.9 | 231.3 | 790.8 | 303.1 | 233.5 | 946.6 | 676.1 |
| Previously published | 747.0 | 512.0 | 697.6 | 213.9 | 231.3 | 790.8 | 303.1 | 177.2 | 710.2 | 583.2 |
| Amount of revision | 0.0 | 0.0 | 0.0 | 0.0 | 0.0 | 0.0 | 0.0 | 56.3 | 236.4 | 92.9 |
| Equity and investment fund shares (line 96): | ||||||||||
| Revised | 239.1 | −62.6 | 154.3 | −187.3 | −139.7 | 149.6 | 156.9 | −291.4 | 687.4 | −19.6 |
| Previously published | 239.1 | −62.6 | 154.3 | −187.3 | −139.7 | 149.6 | 156.9 | −244.1 | 648.4 | −8.5 |
| Amount of revision | 0.0 | 0.0 | 0.0 | 0.0 | 0.0 | 0.0 | 0.0 | −47.3 | 39.0 | −11.1 |
| Debt securities (line 97) | ||||||||||
| Short term (line 98): | ||||||||||
| Revised | 16.3 | 45.7 | 22.4 | 45.8 | −12.2 | 11.9 | 30.4 | −33.1 | 269.2 | −61.5 |
| Previously published | 16.3 | 45.7 | 22.4 | 45.8 | −12.2 | 11.9 | 30.4 | −33.1 | 272.5 | −26.1 |
| Amount of revision | 0.0 | 0.0 | 0.0 | 0.0 | 0.0 | 0.0 | 0.0 | (*) | −3.3 | −35.4 |
| Long term (line 99): | ||||||||||
| Revised | 491.6 | 529.0 | 520.9 | 355.4 | 383.1 | 629.3 | 115.8 | 558.0 | −10.0 | 757.1 |
| Previously published | 491.6 | 529.0 | 520.9 | 355.4 | 383.1 | 629.3 | 115.8 | 454.4 | −210.7 | 617.8 |
| Amount of revision | 0.0 | 0.0 | 0.0 | 0.0 | 0.0 | 0.0 | 0.0 | 103.6 | 200.7 | 139.3 |
| Other investment liabilities (line 100): | ||||||||||
| Revised | −365.3 | 251.9 | 160.0 | −221.9 | 1.0 | 387.6 | 194.4 | 282.8 | 539.5 | 852.9 |
| Previously published | −365.3 | 251.9 | 160.0 | −221.9 | 1.0 | 387.6 | 194.4 | 276.4 | 535.1 | 825.9 |
| Amount of revision | 0.0 | 0.0 | 0.0 | 0.0 | 0.0 | 0.0 | 0.0 | 6.5 | 4.4 | 26.9 |
| Financial derivatives other than reserves, net transactions (line 107): | ||||||||||
| Revised | 7.1 | 2.2 | −54.3 | −27.0 | 7.8 | 24.0 | −20.4 | −41.7 | −5.1 | −41.9 |
| Previously published | 7.1 | 2.2 | −54.3 | −27.0 | 7.8 | 24.0 | −20.4 | −41.7 | −5.8 | −41.7 |
| Amount of revision | 0.0 | 0.0 | 0.0 | 0.0 | 0.0 | 0.0 | 0.0 | 0.0 | 0.7 | −0.2 |
| Net lending (+) or net borrowing (−) from financial-account transactions (line 117): | ||||||||||
| Revised | −453.6 | −423.7 | −298.1 | −386.4 | −362.4 | −373.2 | −302.9 | −565.5 | −697.0 | −740.6 |
| Previously published | −448.0 | −400.1 | −297.1 | −333.1 | −363.6 | −344.6 | −348.4 | −480.4 | −653.0 | −687.1 |
| Amount of revision | −5.6 | −23.6 | −1.0 | −53.3 | 1.2 | −28.6 | 45.5 | −85.1 | −44.0 | −53.5 |
- (*)
- Transactions between +/− $50,000,000.
Note. Line numbers refer to ITA table 1.2 on BEA's website.
[Click chart to expand]
Net U.S. acquisition of financial assets excluding financial derivatives was revised for 2012–2021 (chart 7). The methodology change for short-term portfolio investment was the only source of revisions for 2012–2017 and drove the upward revision for 2018. Direct investment assets were revised down for 2019–2021, reflecting revised source data from BEA's direct investment surveys. For 2020, the upward revision to portfolio assets was related to the series break in the TIC SLT data. For 2021, the revision to portfolio assets was due to revised source data for long-term debt and the methodology change for short-term debt.

[Click chart to expand]
Net U.S. incurrence of liabilities excluding financial derivatives was revised for 2018–2021 (chart 8). Revisions for 2019–2021 were mainly due to long-term portfolio debt securities, reflecting the smoothing of a large break in series in the TIC data. The revision for 2021 was also due to updated source data.3 Downward revisions to direct investment for 2019–2021 reflect newly available and revised BEA survey data.

[Click chart to expand]
Statistical discrepancy
The statistical discrepancy is the difference between net acquisition of assets and net incurrence of liabilities in the financial account (including financial derivatives) less the difference between total credits and total debits recorded in the current and capital accounts. In principle, the combined deficit (or surplus) on recorded transactions in the current and capital accounts should equal net borrowing (or net lending) measured by recorded transactions in the financial account. In practice, however, they differ because of incomplete source data, gaps in coverage, and timing differences. Table A and chart 9 present the previously published and revised statistical discrepancy for 2012–2021.

[Click chart to expand]
| Quarters | Balance on goods and services | Balance on primary income | Balance on secondary income | ||||||
|---|---|---|---|---|---|---|---|---|---|
| Previously published | Revised | Revision | Previously published | Revised | Revision | Previously published | Revised | Revision | |
| 2012:Q1 | −142,655 | −142,655 | 0 | 52,811 | 52,795 | −16 | −24,052 | −24,052 | 0 |
| Q2 | −134,888 | −134,888 | 0 | 48,329 | 48,313 | −16 | −23,428 | −23,428 | 0 |
| Q3 | −125,229 | −125,229 | 0 | 48,631 | 48,615 | −16 | −22,252 | −22,252 | 0 |
| Q4 | −123,134 | −123,134 | 0 | 48,153 | 48,136 | −17 | −20,402 | −20,402 | 0 |
| 2013:Q1 | −115,453 | −115,453 | 0 | 45,308 | 45,291 | −17 | −20,761 | −20,761 | 0 |
| Q2 | −114,614 | −114,614 | 0 | 48,579 | 48,564 | −15 | −23,111 | −23,111 | 0 |
| Q3 | −112,890 | −112,890 | 0 | 51,420 | 51,407 | −13 | −23,909 | −23,909 | 0 |
| Q4 | −103,904 | −103,904 | 0 | 50,213 | 50,198 | −15 | −20,334 | −20,334 | 0 |
| 2014:Q1 | −120,492 | −120,492 | 0 | 50,664 | 50,648 | −16 | −21,070 | −21,070 | 0 |
| Q2 | −122,205 | −122,205 | 0 | 48,387 | 48,371 | −16 | −13,335 | −13,335 | 0 |
| Q3 | −117,542 | −117,542 | 0 | 54,283 | 54,265 | −18 | −25,912 | −25,912 | 0 |
| Q4 | −123,713 | −123,713 | 0 | 46,969 | 46,950 | −19 | −26,022 | −26,022 | 0 |
| 2015:Q1 | −121,459 | −121,500 | −41 | 46,974 | 46,949 | −25 | −24,819 | −24,844 | −25 |
| Q2 | −120,941 | −120,763 | 178 | 44,290 | 44,264 | −26 | −22,972 | −22,976 | −4 |
| Q3 | −126,376 | −126,186 | 190 | 44,606 | 44,561 | −45 | −28,301 | −28,302 | −1 |
| Q4 | −122,647 | −122,327 | 320 | 49,505 | 49,430 | −75 | −26,751 | −26,760 | −9 |
| 2016:Q1 | −120,528 | −120,152 | 376 | 45,073 | 44,929 | −144 | −28,778 | −28,792 | −14 |
| Q2 | −119,150 | −118,798 | 352 | 45,352 | 45,208 | −144 | −26,875 | −26,891 | −16 |
| Q3 | −117,806 | −117,082 | 724 | 46,354 | 46,225 | −129 | −28,676 | −28,705 | −29 |
| Q4 | −123,991 | −123,427 | 564 | 60,242 | 60,080 | −162 | −28,787 | −28,811 | −24 |
| 2017:Q1 | −124,233 | −124,349 | −116 | 59,650 | 59,327 | −323 | −20,320 | −20,325 | −5 |
| Q2 | −131,484 | −130,862 | 622 | 56,828 | 57,293 | 465 | −30,422 | −30,443 | −21 |
| Q3 | −124,635 | −123,570 | 1,065 | 67,585 | 68,358 | 773 | −27,274 | −27,286 | −12 |
| Q4 | −132,388 | −131,563 | 825 | 75,482 | 72,963 | −2,519 | −30,495 | −30,564 | −69 |
| 2018:Q1 | −140,186 | −139,473 | 713 | 70,374 | 69,335 | −1,039 | −27,457 | −27,485 | −28 |
| Q2 | −131,162 | −132,245 | −1,083 | 66,417 | 66,808 | 391 | −28,839 | −28,903 | −64 |
| Q3 | −151,023 | −149,782 | 1,241 | 59,131 | 59,004 | −127 | −27,982 | −27,966 | 16 |
| Q4 | −158,579 | −157,094 | 1,485 | 63,209 | 60,128 | −3,081 | −32,139 | −32,176 | −37 |
| 2019:Q1 | −146,627 | −145,208 | 1,419 | 54,497 | 62,829 | 8,332 | −34,977 | −34,931 | 46 |
| Q2 | −152,367 | −148,424 | 3,943 | 60,267 | 63,835 | 3,568 | −31,815 | −32,606 | −791 |
| Q3 | −148,609 | −141,542 | 7,067 | 60,332 | 61,688 | 1,356 | −29,208 | −29,798 | −590 |
| Q4 | −128,737 | −124,501 | 4,236 | 56,823 | 55,202 | −1,621 | −31,725 | −32,501 | −776 |
| 2020:Q1 | −134,248 | −129,705 | 4,543 | 51,464 | 55,486 | 4,022 | −32,004 | −33,200 | −1,196 |
| Q2 | −158,549 | −155,586 | 2,963 | 34,524 | 33,829 | −695 | −29,841 | −30,527 | −686 |
| Q3 | −187,101 | −179,037 | 8,064 | 48,257 | 41,551 | −6,706 | −33,519 | −33,806 | −287 |
| Q4 | −196,787 | −189,661 | 7,126 | 54,216 | 32,224 | −21,992 | −32,508 | −31,266 | 1,242 |
| 2021:Q1 | −204,067 | −197,191 | 6,876 | 50,056 | 40,906 | −9,150 | −33,518 | −32,455 | 1,063 |
| Q2 | −204,954 | −203,715 | 1,239 | 38,684 | 28,027 | −10,657 | −30,083 | −30,714 | −631 |
| Q3 | −223,392 | −219,142 | 4,250 | 41,922 | 33,568 | −8,354 | −38,401 | −40,800 | −2,399 |
| Q4 | −228,970 | −225,000 | 3,970 | 44,246 | 36,993 | −7,253 | −33,156 | −36,831 | −3,675 |
| Quarters | Balance on current account | Balance on capital account | Net lending (+) or net borrowing (-) from financial-account transactions | ||||||
|---|---|---|---|---|---|---|---|---|---|
| Previously published | Revised | Revision | Previously published | Revised | Revision | Previously published | Revised | Revision | |
| 2012:Q1 | −113,896 | −113,912 | −16 | −2,047 | −2,047 | 0 | −258,914 | −270,170 | −11,256 |
| Q2 | −109,987 | −110,004 | −17 | −1,794 | −1,794 | 0 | −53,109 | −34,293 | 18,816 |
| Q3 | −98,850 | −98,866 | −16 | −1,525 | −1,525 | 0 | −1,628 | −10,418 | −8,790 |
| Q4 | −95,382 | −95,400 | −18 | 6,297 | 6,297 | 0 | −134,382 | −138,729 | −4,347 |
| 2013:Q1 | −90,907 | −90,923 | −16 | −1,671 | −1,671 | 0 | −47,936 | −48,635 | −699 |
| Q2 | −89,146 | −89,161 | −15 | −1,882 | −1,882 | 0 | −35,979 | −46,301 | −10,322 |
| Q3 | −85,379 | −85,392 | −13 | −1,462 | −1,462 | 0 | −141,903 | −144,167 | −2,264 |
| Q4 | −74,025 | −74,041 | −16 | −1,544 | −1,544 | 0 | −174,276 | −184,554 | −10,278 |
| 2014:Q1 | −90,898 | −90,914 | −16 | −2,361 | −2,361 | 0 | −113,490 | −113,573 | −83 |
| Q2 | −87,153 | −87,169 | −16 | −1,298 | −1,298 | 0 | −82,615 | −87,997 | −5,382 |
| Q3 | −89,171 | −89,189 | −18 | −1,220 | −1,220 | 0 | −58,651 | −43,297 | 15,354 |
| Q4 | −102,766 | −102,784 | −18 | −1,655 | −1,655 | 0 | −42,320 | −53,217 | −10,897 |
| 2015:Q1 | −99,304 | −99,395 | −91 | −2,999 | −2,999 | 0 | −124,436 | −139,237 | −14,801 |
| Q2 | −99,622 | −99,475 | 147 | −1,266 | −1,266 | 0 | −137,039 | −147,496 | −10,457 |
| Q3 | −110,070 | −109,927 | 143 | −2,184 | −2,184 | 0 | −36,886 | −62,039 | −25,153 |
| Q4 | −99,892 | −99,657 | 235 | −1,490 | −1,490 | 0 | −34,782 | −37,628 | −2,846 |
| 2016:Q1 | −104,234 | −104,015 | 219 | −2,236 | −2,236 | 0 | −84,133 | −85,978 | −1,845 |
| Q2 | −100,673 | −100,481 | 192 | −1,078 | −1,078 | 0 | −4,687 | −7,785 | −3,098 |
| Q3 | −100,127 | −99,562 | 565 | −1,352 | −1,352 | 0 | −222,890 | −208,820 | 14,070 |
| Q4 | −92,536 | −92,158 | 378 | −1,940 | −1,940 | 0 | −51,922 | −59,845 | −7,923 |
| 2017:Q1 | −84,903 | −85,347 | −444 | −2,116 | −2,116 | 0 | −79,387 | −83,621 | −4,234 |
| Q2 | −105,077 | −104,012 | 1,065 | −1,999 | −1,999 | 0 | −114,592 | −116,058 | −1,466 |
| Q3 | −84,324 | −82,498 | 1,826 | 18,213 | 18,213 | 0 | −85,388 | −126,042 | −40,654 |
| Q4 | −87,401 | −89,164 | −1,763 | −1,703 | −1,703 | 0 | −65,221 | −47,515 | 17,706 |
| 2018:Q1 | −97,269 | −97,622 | −353 | −1,347 | −1,347 | 0 | −59,376 | −57,668 | 1,708 |
| Q2 | −93,584 | −94,340 | −756 | −2,937 | −2,937 | 0 | −56,343 | −41,857 | 14,486 |
| Q3 | −119,874 | −118,744 | 1,130 | −449 | −449 | 0 | −13,199 | −4,293 | 8,906 |
| Q4 | −127,508 | −129,143 | −1,635 | 472 | 472 | 0 | −219,448 | −199,054 | 20,394 |
| 2019:Q1 | −127,106 | −117,311 | 9,795 | −2,732 | −2,733 | −1 | −89,292 | −91,189 | −1,897 |
| Q2 | −123,915 | −117,195 | 6,720 | −865 | −866 | −1 | −209,551 | −249,490 | −39,939 |
| Q3 | −117,485 | −109,652 | 7,833 | −899 | −899 | 0 | −104,132 | −140,552 | −36,420 |
| Q4 | −103,640 | −101,800 | 1,840 | −1,947 | −1,957 | −10 | −77,402 | −84,293 | −6,891 |
| 2020:Q1 | −114,788 | −107,420 | 7,368 | −2,867 | −2,878 | −11 | −154,122 | −149,799 | 4,323 |
| Q2 | −153,866 | −152,283 | 1,583 | −946 | −957 | −11 | −84,255 | −86,626 | −2,371 |
| Q3 | −172,362 | −171,293 | 1,069 | −550 | −561 | −11 | −143,408 | −171,626 | −28,218 |
| Q4 | −175,079 | −188,702 | −13,623 | −1,124 | −1,136 | −12 | −271,199 | −288,929 | −17,730 |
| 2021:Q1 | −187,529 | −188,740 | −1,211 | −2,743 | −2,740 | 3 | −170,709 | −177,654 | −6,945 |
| Q2 | −196,353 | −206,402 | −10,049 | −863 | −881 | −18 | −211,262 | −140,900 | 70,362 |
| Q3 | −219,872 | −226,375 | −6,503 | 3,004 | 2,990 | −14 | −171,516 | −218,096 | −46,580 |
| Q4 | −217,880 | −224,837 | −6,957 | −1,844 | −1,844 | 0 | −133,616 | −203,948 | −70,332 |
- Results of the annual update of the U.S. International Investment Position (IIP) Accounts were also released in June. For a discussion of the revisions to the IIP Accounts, see Erin Whitaker, “U.S. Net International Investment Position: First Quarter 2022 and Annual Update” in this issue of the Survey of Current Business.
- For more information, see A Guide to BEA's Services Surveys on BEA's website.
- Revised data from the following TIC surveys were incorporated: (1) Reports by Financial Institutions of Liabilities to, and Claims on, Foreign Residents by U.S. Residents (liabilities) and (2) Reports of Liabilities to, and Claims on, Unaffiliated Foreign Residents by U.S. Resident Non-Financial Institutions (liabilities).