New Foreign Direct Investment in the United States in 2021
The U.S. Bureau of Economic Analysis (BEA) recently released statistics on 2021 new foreign direct investment in the United States. These statistics provide information on the acquisition and establishment of U.S. business enterprises by foreign investors and on the expansion of existing U.S. affiliates of foreign companies to establish new production facilities. These annual statistics provide information on the amount and characteristics of new investments in the United States by foreign investors and are obtained from a mandatory survey of foreign-owned U.S. businesses conducted by BEA.
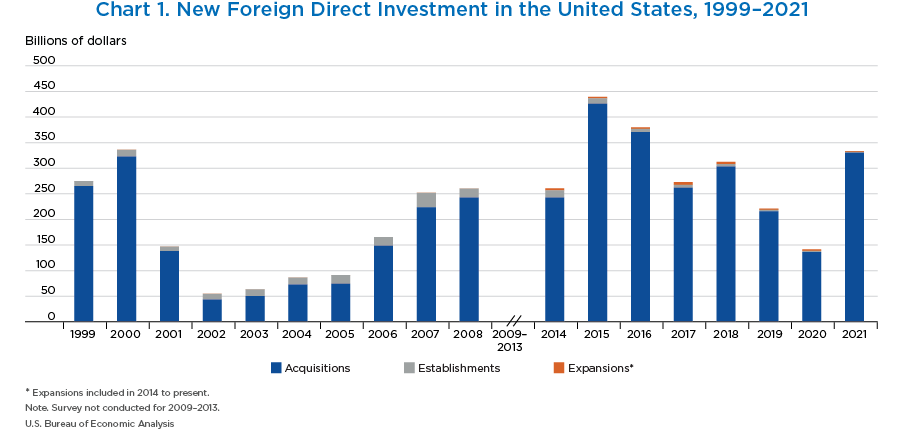
- Expenditures by foreign direct investors to acquire, establish, or expand U.S. businesses totaled $333.6 billion (preliminary) in 2021.
- Expenditures increased $192.2 billion from $141.4 billion (revised) in 2020 and were above the annual average of $289.7 billion for 2014–2020.
- As in previous years, acquisitions of existing businesses accounted for a large majority of total expenditures.
- In 2021, expenditures for acquisitions were $330.2 billion, expenditures to establish new U.S. businesses were $1.6 billion, and expenditures to expand existing foreign-owned businesses were $1.8 billion.
- Planned total expenditures, which include both first-year and planned future expenditures for investments initiated in 2021, were $345.8 billion.
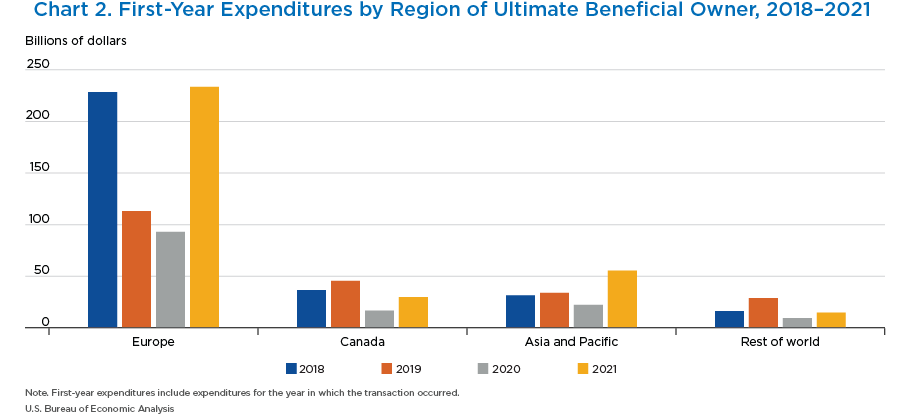
- By region of UBO, European investors were the largest source of new foreign direct investment expenditures in 2018–2021.
- New foreign direct investment expenditures increased from all regions of UBO from 2020 to 2021.
- By region, Europe had the largest change in new foreign direct investment expenditures between 2020 and 2021, an increase of $140.4 billion.
- Europe contributed 70 percent of new investment expenditures in 2021.
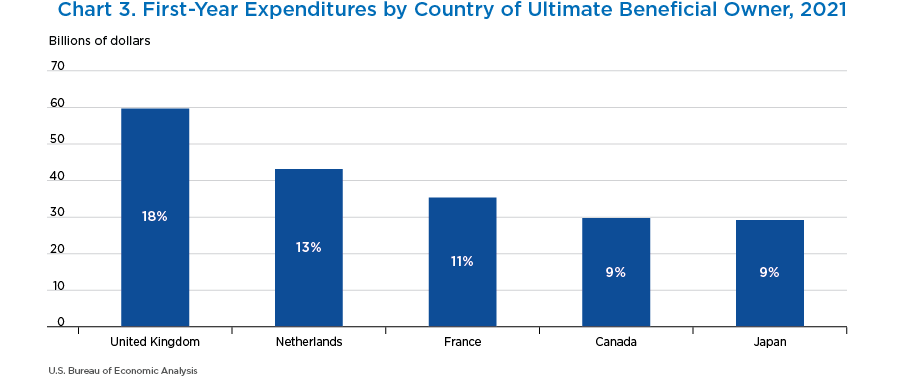
- By country of UBO, the United Kingdom was the largest investing country, with expenditures of $59.7 billion in 2021.
- Investments by British investors accounted for 18 percent of new foreign direct investment expenditures.
- The Netherlands ($43.1 billion) was the second-largest investing country, followed by France ($35.3 billion).
- The top-five investing countries accounted for 59.1 percent of new foreign direct investment expenditures in 2021.
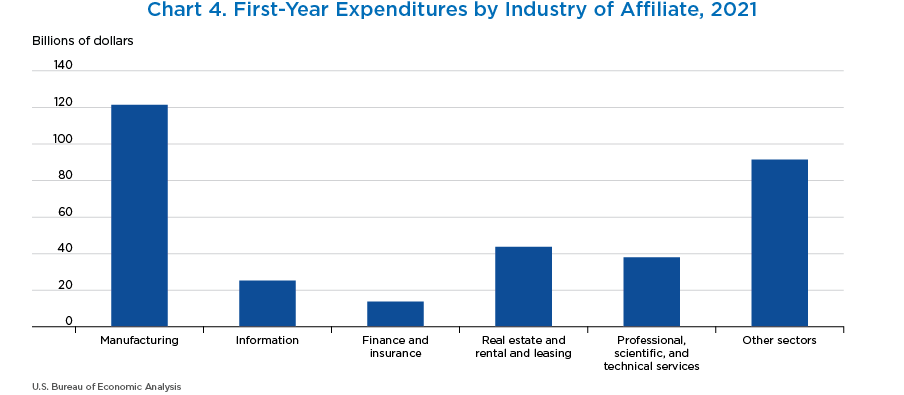
- Expenditures for new foreign direct investment were largest in manufacturing, at $121.3 billion, accounting for 36.4 percent of total expenditures in 2021.
- Within manufacturing, expenditures were largest in chemical manufacturing ($63.2 billion) and computers and electronic products ($30.2 billion).
- Chemical manufacturing has been the top industry for new foreign direct investment expenditures since 2018.
- There were also notable expenditures in the real estate and rental and leasing sector ($43.8 billion).
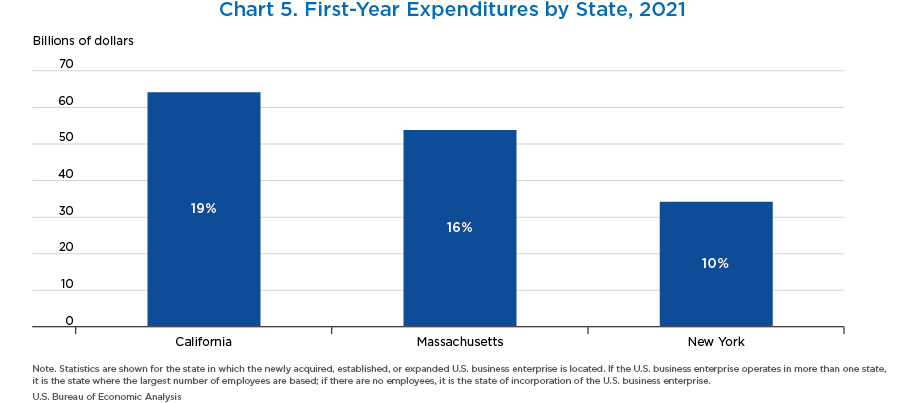
- By U.S. state, California received the largest share of first-year investment, with expenditures of $64.1 billion.
- Massachusetts ($53.8 billion) and New York ($34.2 billion) were the second- and third-largest recipient states, respectively, in 2021.
- Combined, these three states received 45.6 percent of first-year expenditures in 2021.
- In 2021, 47 states, Puerto Rico, and the District of Columbia received new foreign direct investment.
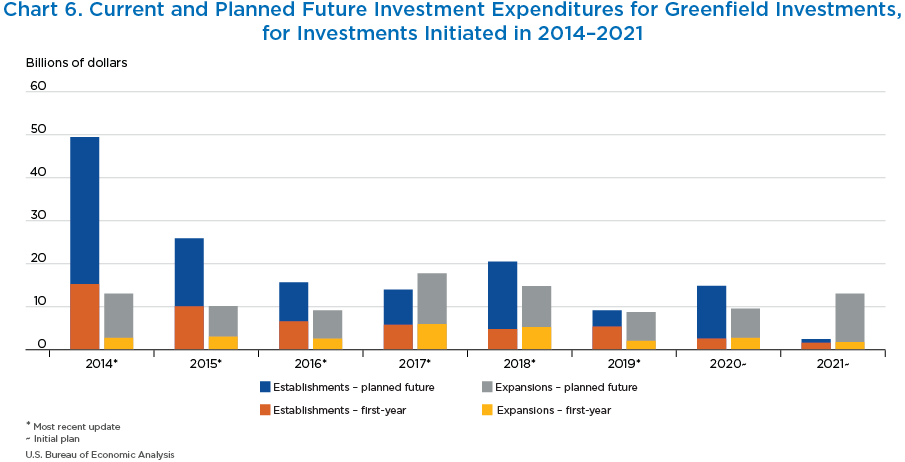
- First-year greenfield investment expenditures—expenditures to either establish a new U.S. business or to expand an existing foreign-owned U.S. business—were $3.4 billion in 2021.
- Planned total expenditures (first year and planned future) for establishments and expansions initiated in 2021 were $15.6 billion.
- Greenfield projects can take multiple years to complete. Over half of total planned expenditures for these projects are incurred in years beyond the one in which the investment was initiated.
- For establishments initiated in 2021, planned total expenditures were $2.5 billion, of which $0.9 billion will be incurred in future years.
- For expansions initiated in 2021, planned total expenditures were $13.1 billion, of which $11.3 billion will be incurred in future years.
- In 2021, employment at newly acquired, established, or expanded foreign-owned U.S. businesses was 236,900.
- Current employment of acquired enterprises was 234,500.
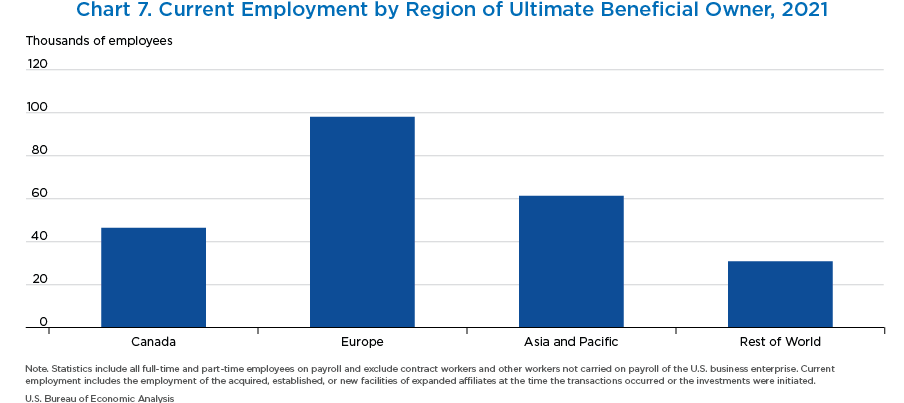
- By region of UBO, Europe accounted for 41.4 percent of current employment in 2021.
- By country of UBO, Canada (46,500), Japan (between 25,000 and 50,000), and the United Kingdom (20,600) accounted for the largest number of employees.1
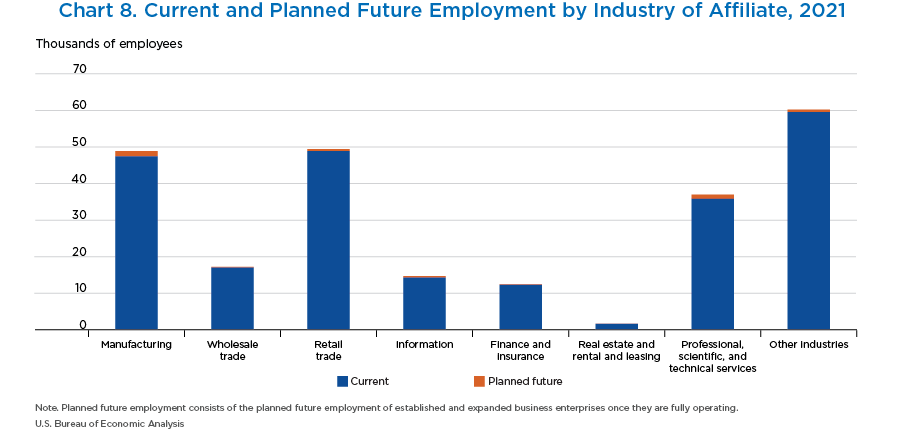
- Total planned employment, which includes the current employment of acquired enterprises, the planned future employment of newly established business enterprises when fully operational, and the planned future employment associated with expansions, was 241,400.
- By industry, retail trade accounted for the largest number of current employees (48,900), followed by manufacturing (47,400).
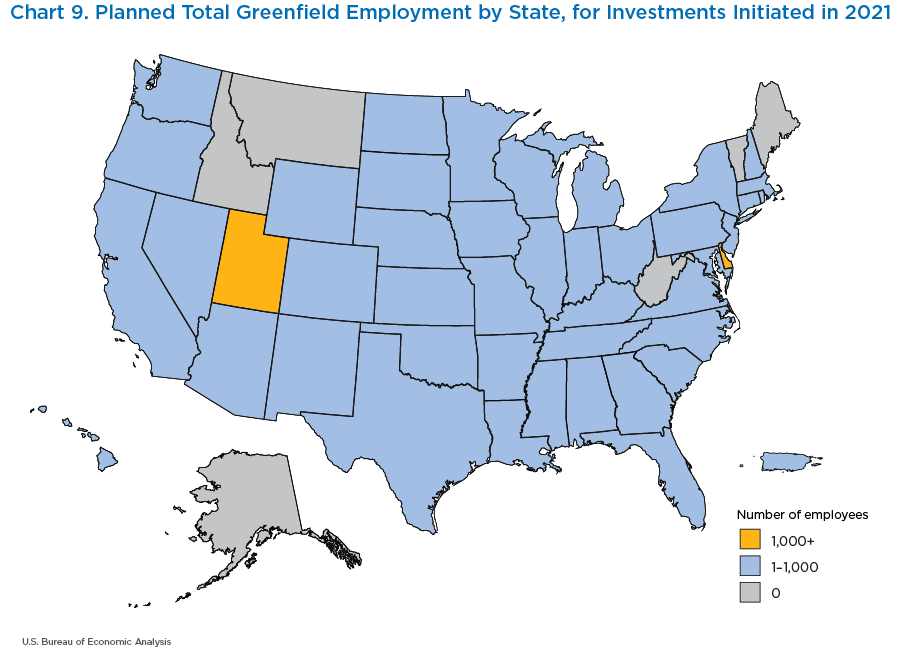
- When complete, greenfield investments initiated in 2021 by foreign direct investors are expected to employ 6,900.
- Forty-four states, Puerto Rico, and the District of Columbia had planned employment from greenfield investments initiated in 2021.
- Establishments and expansions in Utah and Delaware plan to employ over 1,000 in each state when complete.
- Size ranges are provided for employment values that are suppressed to ensure the confidentiality of survey responses.
