
GDP and the Economy
Second Estimates for the Fourth Quarter of 2017
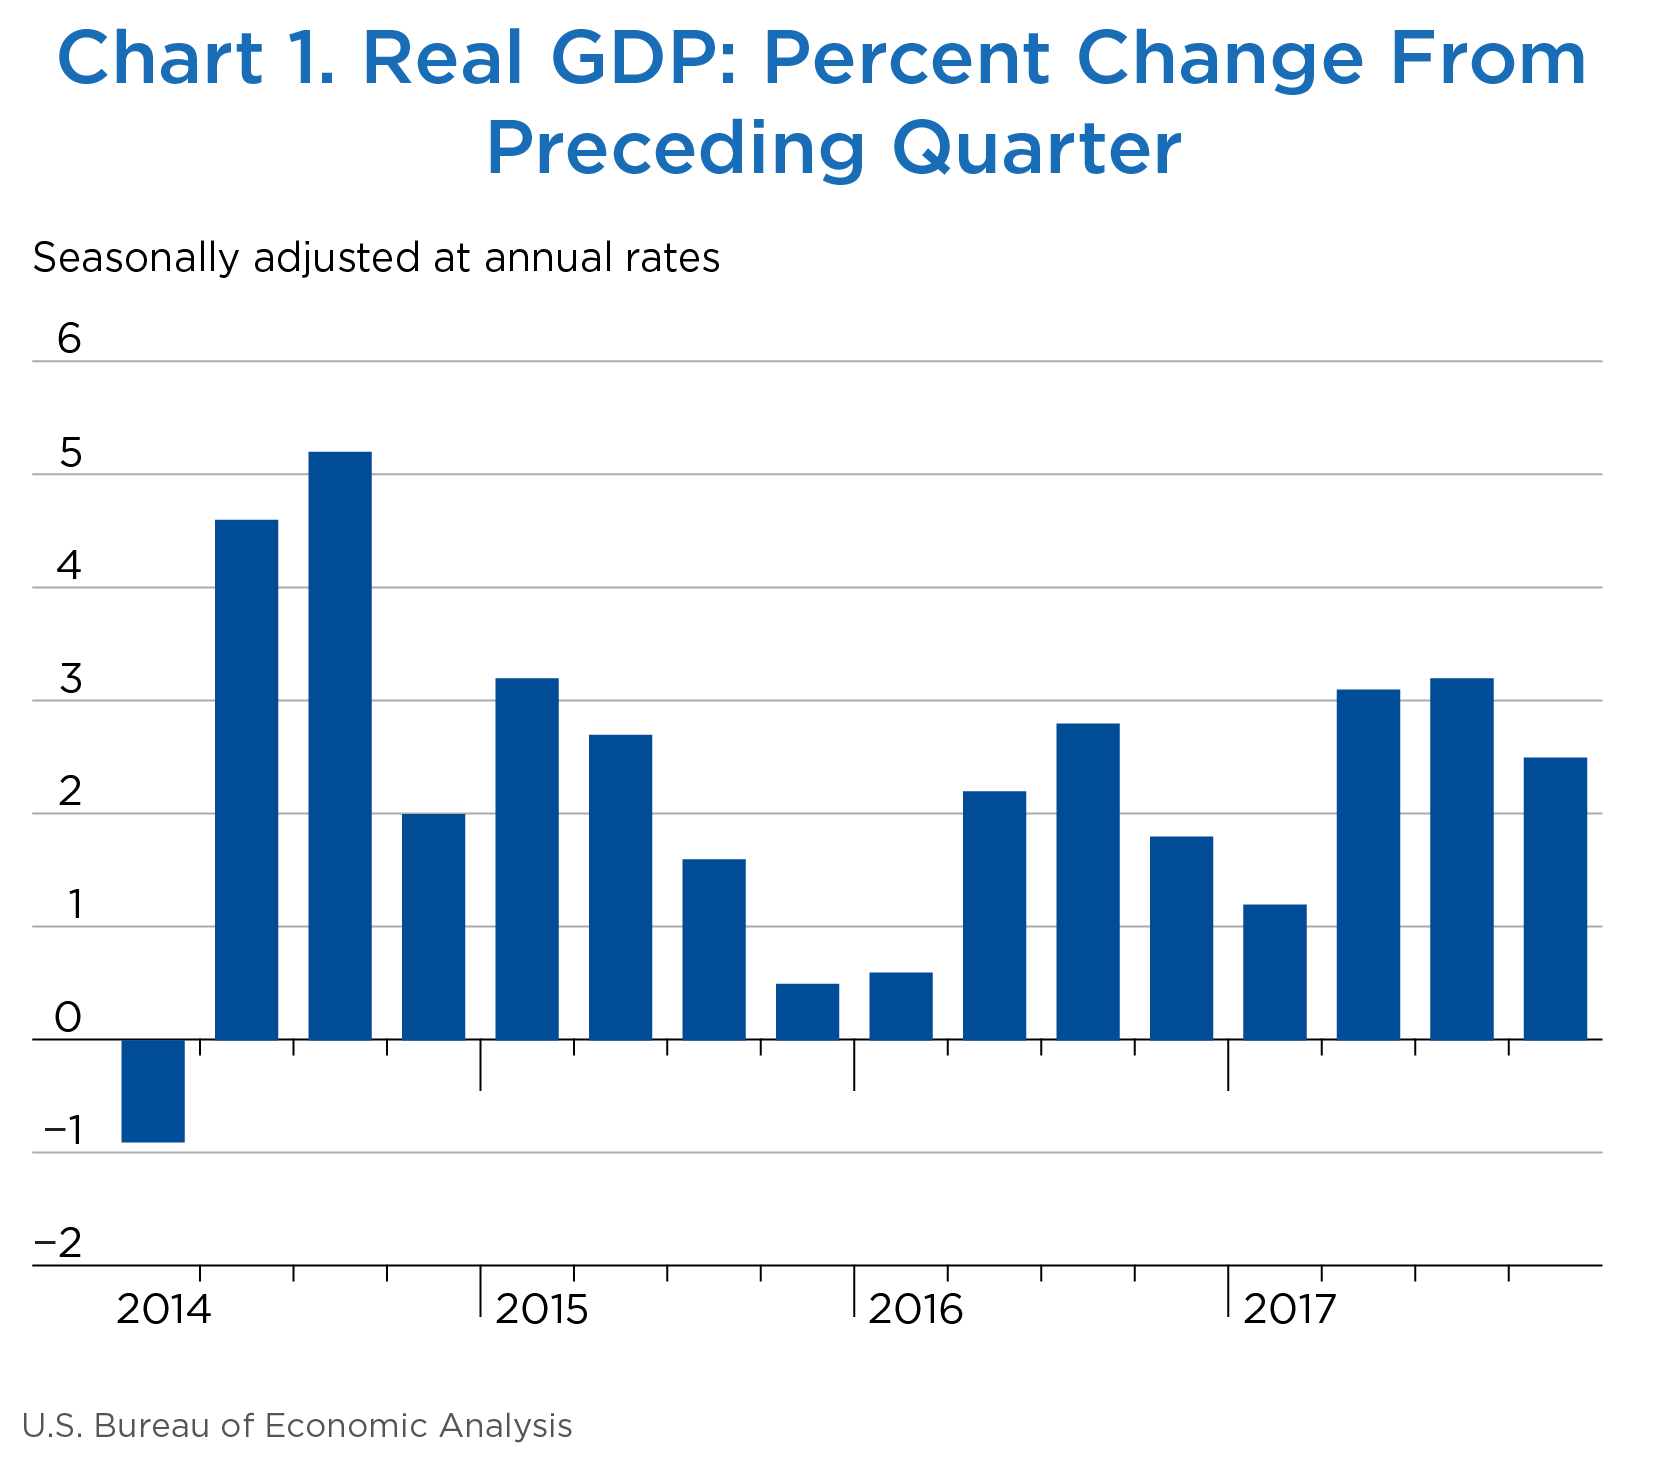
Real gross domestic product (GDP) increased 2.5 percent at an annual rate in the fourth quarter of 2017, according to the second estimates of the national income and product accounts (NIPAs) (chart 1 and table 1).1 In the third quarter, real GDP increased 3.2 percent.
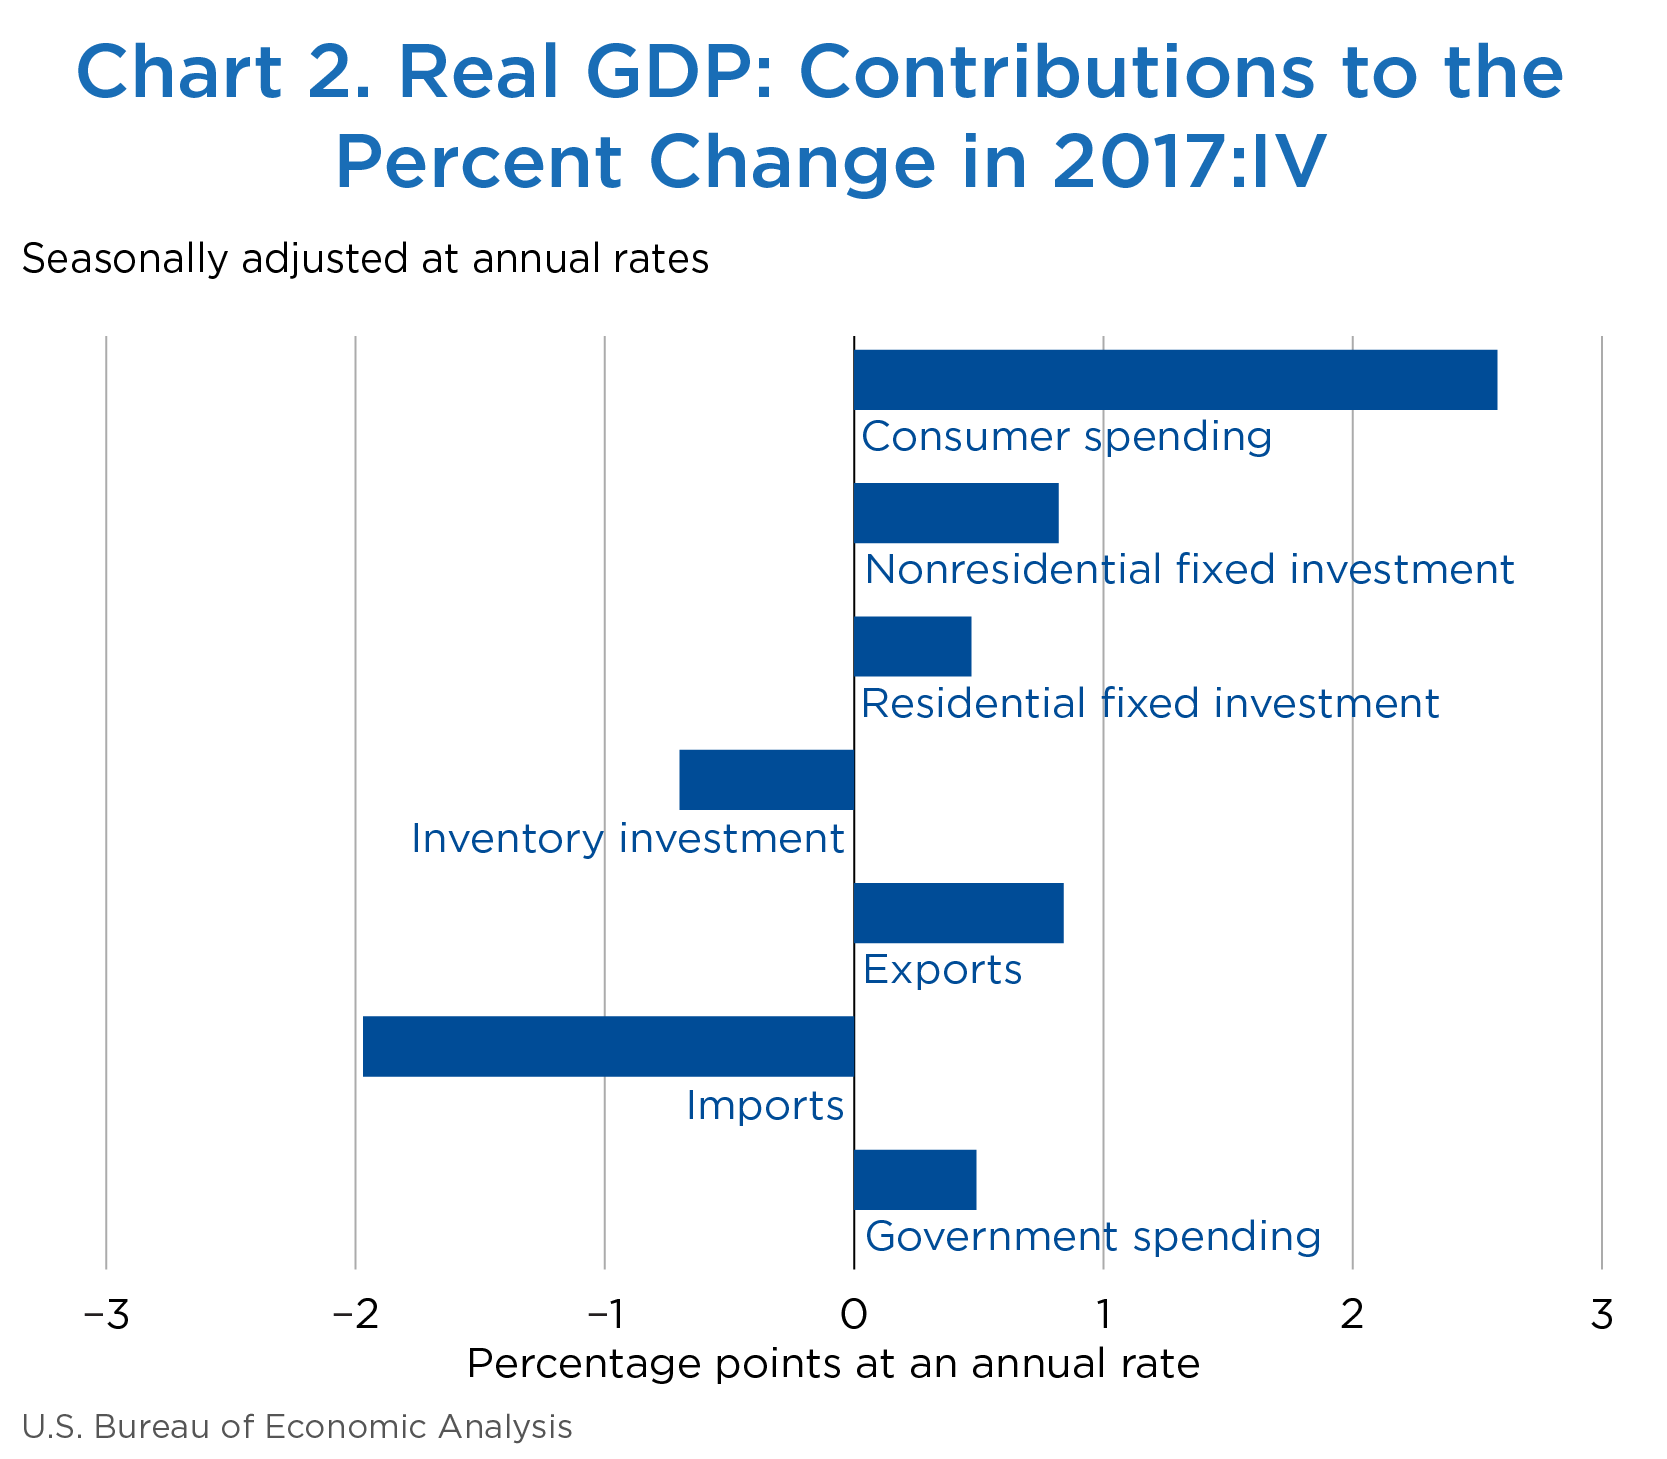
The increase in real GDP in the fourth quarter reflected positive contributions from consumer spending, exports, nonresidential fixed investment, residential fixed investment, state and local government spending, and federal government spending that were partly offset by a negative contribution from private inventory investment (chart 2).2 Imports, which are a subtraction in the calculation of GDP, increased.
[Click Chart to Expand]
[Click Chart to Expand]
GDP Component Detail
The deceleration in real GDP growth in the fourth quarter reflected a downturn in private inventory investment that was partly offset by accelerations in consumer spending, exports, state and local government spending, nonresidential fixed investment, and federal government spending and by an upturn in residential fixed investment. Imports, which are a subtraction in the calculation of GDP, turned up.
- The acceleration in consumer spending (line 2) primarily reflected an acceleration in spending for goods. The main contributors to the acceleration were accelerations in spending for recreational goods and vehicles, food and beverages purchased for off-premises consumption, and motor vehicles and parts and an upturn in spending for clothing and footwear.
- The acceleration in nonresidential fixed investment (line 9) was mainly due to an upturn in commercial and health care structures and a smaller decrease in manufacturing structures.
- The upturn in residential fixed investment (line 13) primarily reflected an upturn in “other” structures (which was mainly due to upturns in brokers’ commissions and other ownership transfer costs and in improvements).
- The downturn in inventory investment (line 14) primarily reflected downturns in wholesale trade and in manufacturing that were partly offset by an upturn in retail trade.
- The acceleration in exports (line 16) reflected an acceleration in exports of goods that was partly offset by a downturn in exports of services. The main contributor to the acceleration in exports of goods (line 17) was an upturn in industrial supplies and materials (mainly petroleum and products).
- The acceleration in federal government spending (line 23) primarily reflected an acceleration in national defense spending. The main contributor was an acceleration in investment in equipment (primarily aircraft).
- The acceleration in state and local government spending (line 26) primarily reflected an upturn in gross investment in structures.
- Real gross domestic income (line 27) for the third quarter was revised up 0.4 percentage points to 2.4 percent, reflecting revised wages and salaries data from the Quarterly Census of Employment and Wages. The fourth-quarter estimate of gross domestic income will be available with the release of the third estimate of GDP in March when the source data become available.
| Line | Share of current- dollar GDP (percent) |
Change from preceding period (percent) | Contribution to percent change in real GDP (percentage points) |
|||||||
|---|---|---|---|---|---|---|---|---|---|---|
| 2017 | 2017 | 2017 | ||||||||
| IV | I | II | III | IV | I | II | III | IV | ||
| 1 | Gross domestic product1 | 100.0 | 1.2 | 3.1 | 3.2 | 2.5 | 1.2 | 3.1 | 3.2 | 2.5 |
| 2 | Personal consumption expenditures | 69.1 | 1.9 | 3.3 | 2.2 | 3.8 | 1.32 | 2.24 | 1.49 | 2.58 |
| 3 | Goods | 22.3 | 0.7 | 5.4 | 4.5 | 7.5 | 0.15 | 1.16 | 0.97 | 1.61 |
| 4 | Durable goods | 7.7 | −0.1 | 7.6 | 8.6 | 13.8 | −0.01 | 0.56 | 0.63 | 0.99 |
| 5 | Nondurable goods | 14.6 | 1.1 | 4.2 | 2.3 | 4.3 | 0.16 | 0.61 | 0.34 | 0.62 |
| 6 | Services | 46.9 | 2.5 | 2.3 | 1.1 | 2.1 | 1.17 | 1.08 | 0.52 | 0.97 |
| 7 | Gross private domestic investment | 16.6 | −1.2 | 3.9 | 7.3 | 3.5 | −0.20 | 0.64 | 1.19 | 0.59 |
| 8 | Fixed investment | 16.6 | 8.1 | 3.2 | 2.4 | 8.1 | 1.27 | 0.53 | 0.40 | 1.29 |
| 9 | Nonresidential | 12.7 | 7.2 | 6.7 | 4.7 | 6.6 | 0.86 | 0.82 | 0.58 | 0.82 |
| 10 | Structures | 2.9 | 14.8 | 7.0 | −7.0 | 2.5 | 0.39 | 0.20 | −0.21 | 0.07 |
| 11 | Equipment | 5.8 | 4.4 | 8.8 | 10.8 | 11.8 | 0.24 | 0.48 | 0.58 | 0.64 |
| 12 | Intellectual property products | 4.1 | 5.7 | 3.7 | 5.2 | 2.4 | 0.23 | 0.15 | 0.21 | 0.10 |
| 13 | Residential | 3.9 | 11.1 | −7.3 | −4.7 | 13.0 | 0.41 | −0.30 | −0.18 | 0.47 |
| 14 | Change in private inventories | 0.0 | ...... | ...... | ...... | ...... | −1.46 | 0.12 | 0.79 | −0.70 |
| 15 | Net exports of goods and services | −3.0 | ...... | ...... | ...... | ...... | 0.22 | 0.21 | 0.36 | −1.13 |
| 16 | Exports | 12.3 | 7.3 | 3.5 | 2.1 | 7.1 | 0.85 | 0.42 | 0.25 | 0.84 |
| 17 | Goods | 8.2 | 10.8 | 2.2 | 1.8 | 12.0 | 0.81 | 0.18 | 0.15 | 0.92 |
| 18 | Services | 4.1 | 1.0 | 6.2 | 2.5 | −1.9 | 0.04 | 0.25 | 0.10 | −0.08 |
| 19 | Imports | 15.3 | 4.3 | 1.5 | −0.7 | 14.0 | −0.63 | −0.22 | 0.11 | −1.97 |
| 20 | Goods | 12.5 | 4.7 | 1.3 | −0.2 | 16.9 | −0.56 | −0.16 | 0.03 | −1.92 |
| 21 | Services | 2.8 | 2.5 | 2.2 | −2.6 | 1.9 | −0.07 | −0.06 | 0.07 | −0.05 |
| 22 | Government consumption expenditures and gross investment | 17.3 | −0.6 | −0.2 | 0.7 | 2.9 | −0.11 | −0.03 | 0.12 | 0.49 |
| 23 | Federal | 6.5 | −2.4 | 1.9 | 1.3 | 3.2 | −0.16 | 0.13 | 0.09 | 0.21 |
| 24 | National defense | 3.8 | −3.3 | 4.7 | 2.4 | 5.6 | −0.13 | 0.18 | 0.09 | 0.21 |
| 25 | Nondefense | 2.6 | −1.2 | −1.9 | −0.2 | 0.0 | −0.03 | −0.05 | −0.01 | 0.00 |
| 26 | State and local | 10.8 | 0.5 | −1.5 | 0.2 | 2.7 | 0.05 | −0.16 | 0.03 | 0.28 |
| Addenda: | ||||||||||
| 27 | Gross domestic income (GDI)2 | ...... | 2.7 | 2.3 | 2.4 | ...... | ...... | ...... | ...... | ...... |
| 28 | Average of GDP and GDI | ...... | 2.0 | 2.7 | 2.8 | ...... | ...... | ...... | ...... | ...... |
| 29 | Final sales of domestic product | 100.0 | 2.7 | 2.9 | 2.4 | 3.3 | 2.70 | 2.94 | 2.37 | 3.23 |
| 30 | Goods | 29.6 | −1.6 | 7.3 | 9.6 | 2.3 | −0.47 | 2.10 | 2.74 | 0.71 |
| 31 | Services | 62.3 | 1.5 | 2.1 | 1.5 | 1.6 | 0.91 | 1.32 | 0.93 | 1.02 |
| 32 | Structures | 8.1 | 10.3 | −4.3 | −6.2 | 10.5 | 0.80 | −0.36 | −0.51 | 0.81 |
| 33 | Motor vehicle output | 2.8 | −7.3 | 0.8 | −10.3 | 33.8 | −0.22 | 0.02 | −0.30 | 0.80 |
| 34 | GDP excluding motor vehicle output | 97.2 | 1.5 | 3.1 | 3.6 | 1.8 | 1.45 | 3.04 | 3.45 | 1.73 |
| 35 | Final sales of computers | 0.4 | 23.3 | 22.3 | −24.2 | 21.0 | 0.08 | 0.08 | −0.10 | 0.07 |
| 36 | GDP excluding final sales of computers | 99.6 | 1.2 | 3.0 | 3.3 | 2.5 | 1.16 | 2.98 | 3.26 | 2.47 |
| 37 | Research and development (R&D) | 2.5 | 7.1 | 1.3 | 0.9 | −1.6 | 0.18 | 0.03 | 0.02 | −0.04 |
| 38 | GDP excluding R&D | 97.5 | 1.1 | 3.1 | 3.2 | 2.6 | 1.06 | 3.03 | 3.13 | 2.58 |
- The estimates of GDP under the contribution columns are also percent changes.
- GDI is deflated by the implicit price deflator for GDP. The third-quarter change in GDI reflects the incorporation of revised wage and salary estimates.
Note. Percent changes are from NIPA tables 1.1.1 and 1.2.1, contributions are from NIPA tables 1.1.2 and 1.2.2, and shares are from NIPA table 1.1.10, or are calculated from NIPA table 1.2.5. For GDI, percent changes are from NIPA table 1.7.1.
Prices
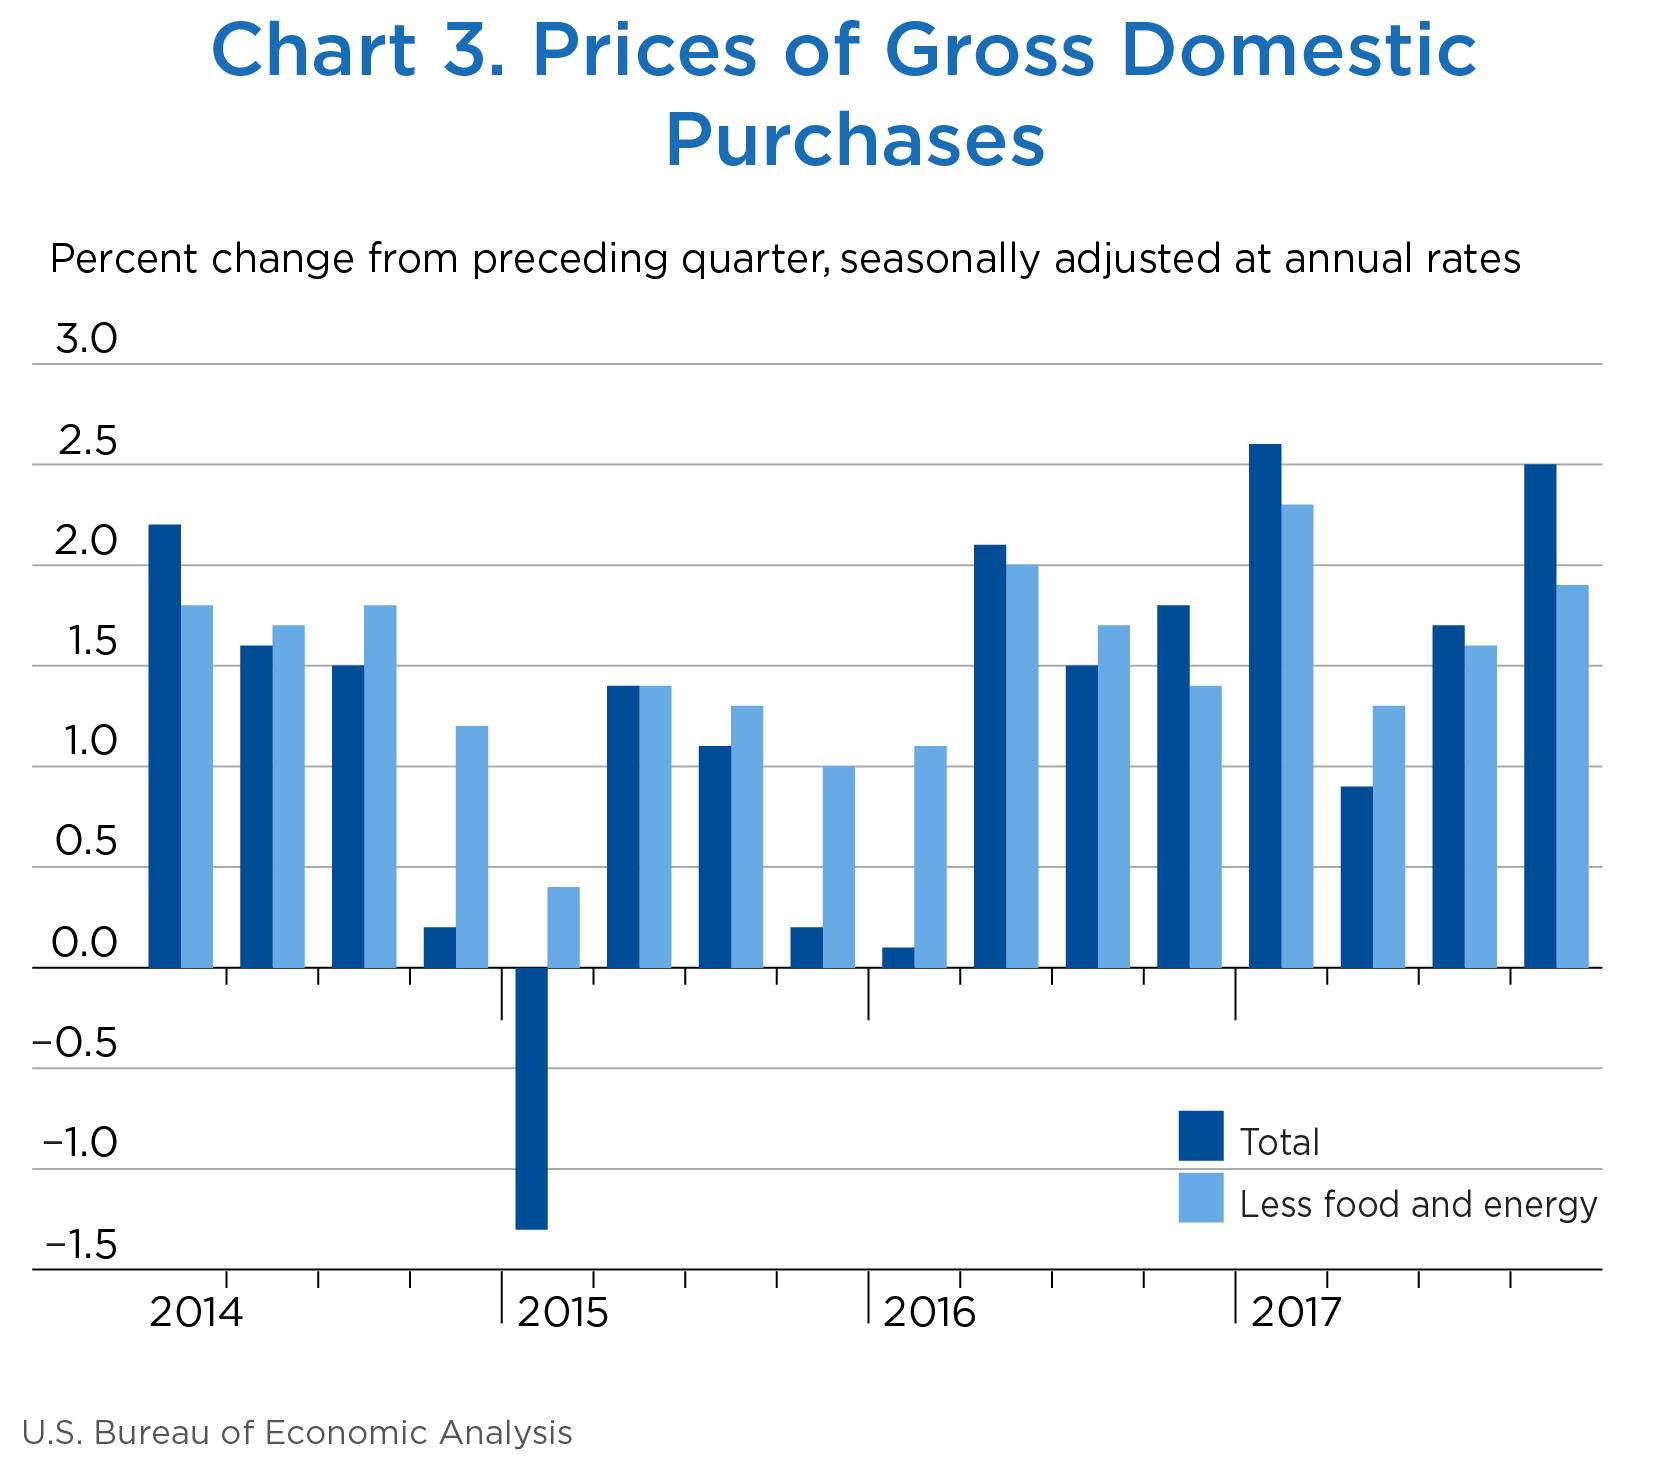
Prices of goods and services purchased by U.S. residents increased 2.5 percent in the fourth quarter after increasing 1.7 percent in the third quarter (table 2, line 1, and chart 3). The acceleration mainly reflected an acceleration in consumer prices.
[Click Chart to Expand]
- Prices paid for consumer goods (line 3) accelerated, primarily reflecting an acceleration in the prices paid for gasoline and other energy goods that were partly offset by a downturn in prices for clothing and footwear, and by a larger decrease in prices for recreational goods and vehicles.
- Prices paid for consumer services (line 6) accelerated, primarily reflecting accelerations in the prices for financial services, food services and accommodations, and transportation services.
- Consumer prices for energy (line 25) increased more in the fourth quarter than in the third quarter, and food prices (line 24) increased at the same rate. Consumer prices excluding food and energy (line 26), a measure of the “core” rate of inflation, accelerated, increasing 1.9 percent in the fourth quarter after increasing 1.3 percent in the third quarter.
| Line | Change from preceding period (percent) | Contribution to percent change in gross domestic purchases prices (percentage points) | |||||||
|---|---|---|---|---|---|---|---|---|---|
| 2017 | 2017 | ||||||||
| I | II | III | IV | I | II | III | IV | ||
| 1 | Gross domestic purchases1 | 2.6 | 0.9 | 1.7 | 2.5 | 2.6 | 0.9 | 1.7 | 2.5 |
| 2 | Personal consumption expenditures | 2.2 | 0.3 | 1.5 | 2.7 | 1.50 | 0.18 | 1.02 | 1.82 |
| 3 | Goods | 2.7 | −3.6 | 0.7 | 1.8 | 0.57 | −0.79 | 0.16 | 0.38 |
| 4 | Durable goods | 1.0 | −3.6 | −2.5 | −2.0 | 0.07 | −0.27 | −0.19 | −0.15 |
| 5 | Nondurable goods | 3.6 | −3.6 | 2.4 | 3.8 | 0.50 | −0.52 | 0.34 | 0.53 |
| 6 | Services | 2.0 | 2.2 | 1.9 | 3.2 | 0.92 | 0.97 | 0.87 | 1.44 |
| 7 | Gross private domestic investment | 1.7 | 2.6 | 1.9 | 1.0 | 0.27 | 0.40 | 0.30 | 0.16 |
| 8 | Fixed investment | 1.6 | 2.5 | 1.9 | 1.0 | 0.25 | 0.40 | 0.30 | 0.16 |
| 9 | Nonresidential | 1.5 | 1.9 | 1.1 | 0.5 | 0.19 | 0.23 | 0.14 | 0.06 |
| 10 | Structures | 3.1 | 3.8 | 4.5 | 2.0 | 0.08 | 0.11 | 0.12 | 0.06 |
| 11 | Equipment | 0.7 | 0.8 | 0.2 | 0.1 | 0.04 | 0.04 | 0.01 | 0.00 |
| 12 | Intellectual property products | 1.6 | 1.9 | 0.1 | 0.0 | 0.06 | 0.08 | 0.00 | 0.00 |
| 13 | Residential | 1.7 | 4.6 | 4.4 | 2.8 | 0.06 | 0.17 | 0.16 | 0.10 |
| 14 | Change in private inventories | ...... | ...... | ...... | ...... | 0.02 | 0.01 | 0.00 | −0.01 |
| 15 | Government consumption expenditures and gross investment | 4.8 | 1.6 | 2.3 | 3.0 | 0.80 | 0.27 | 0.38 | 0.49 |
| 16 | Federal | 5.5 | 1.8 | 1.1 | 1.6 | 0.34 | 0.11 | 0.07 | 0.10 |
| 17 | National defense | 4.9 | 1.4 | 0.4 | 1.4 | 0.18 | 0.05 | 0.02 | 0.05 |
| 18 | Nondefense | 6.3 | 2.3 | 2.1 | 2.0 | 0.16 | 0.06 | 0.05 | 0.05 |
| 19 | State and local | 4.4 | 1.5 | 3.0 | 3.7 | 0.46 | 0.16 | 0.31 | 0.39 |
| Addenda: | |||||||||
| 20 | Gross domestic purchases: | ||||||||
| 21 | Food | 0.3 | 2.1 | 0.2 | 0.2 | 0.02 | 0.10 | 0.01 | 0.01 |
| 22 | Energy goods and services | 15.9 | −16.0 | 8.4 | 27.8 | 0.40 | −0.45 | 0.21 | 0.66 |
| 23 | Excluding food and energy | 2.3 | 1.3 | 1.6 | 1.9 | 2.14 | 1.21 | 1.49 | 1.81 |
| Personal consumption expenditures (PCE): | |||||||||
| 24 | Food and beverages purchased for off-premises consumption | 0.3 | 2.0 | 0.2 | 0.2 | ...... | ...... | ...... | ...... |
| 25 | Energy goods and services | 15.5 | −16.0 | 8.4 | 27.6 | ...... | ...... | ...... | ...... |
| 26 | Excluding food and energy | 1.8 | 0.9 | 1.3 | 1.9 | ...... | ...... | ...... | ...... |
| 27 | Gross domestic product (GDP) | 2.0 | 1.0 | 2.1 | 2.3 | ...... | ...... | ...... | ...... |
| 28 | Exports of goods and services | 2.5 | −0.1 | 3.3 | 5.8 | ...... | ...... | ...... | ...... |
| 29 | Imports of goods and services | 6.2 | −1.0 | 0.4 | 6.2 | ...... | ...... | ...... | ...... |
- The estimates under the contribution columns are also percent changes.
Note. Most percent changes are from NIPA table 1.6.7; percent changes for PCE for food and energy goods and services and for PCE excluding food and energy are from NIPA table 2.3.7. Contributions are from NIPA table 1.6.8. GDP, export, and import prices are from NIPA table 1.1.7.
Personal Income
Personal income (table 3, line 1), which is measured in current dollars, accelerated in the fourth quarter, increasing $189.2 billion after increasing $129.4 billion in the third quarter. The acceleration primarily reflected an upturn in personal interest income (line 17) and an acceleration in nonfarm proprietors’ income (line 14).
- Wages and salaries (line 3) decelerated slightly in the fourth quarter, increasing $91.3 billion after increasing $97.4 billion. The third-quarter estimate was revised up $18.3 billion as a result of the incorporation of newly available Quarterly Census of Employment and Wages data.
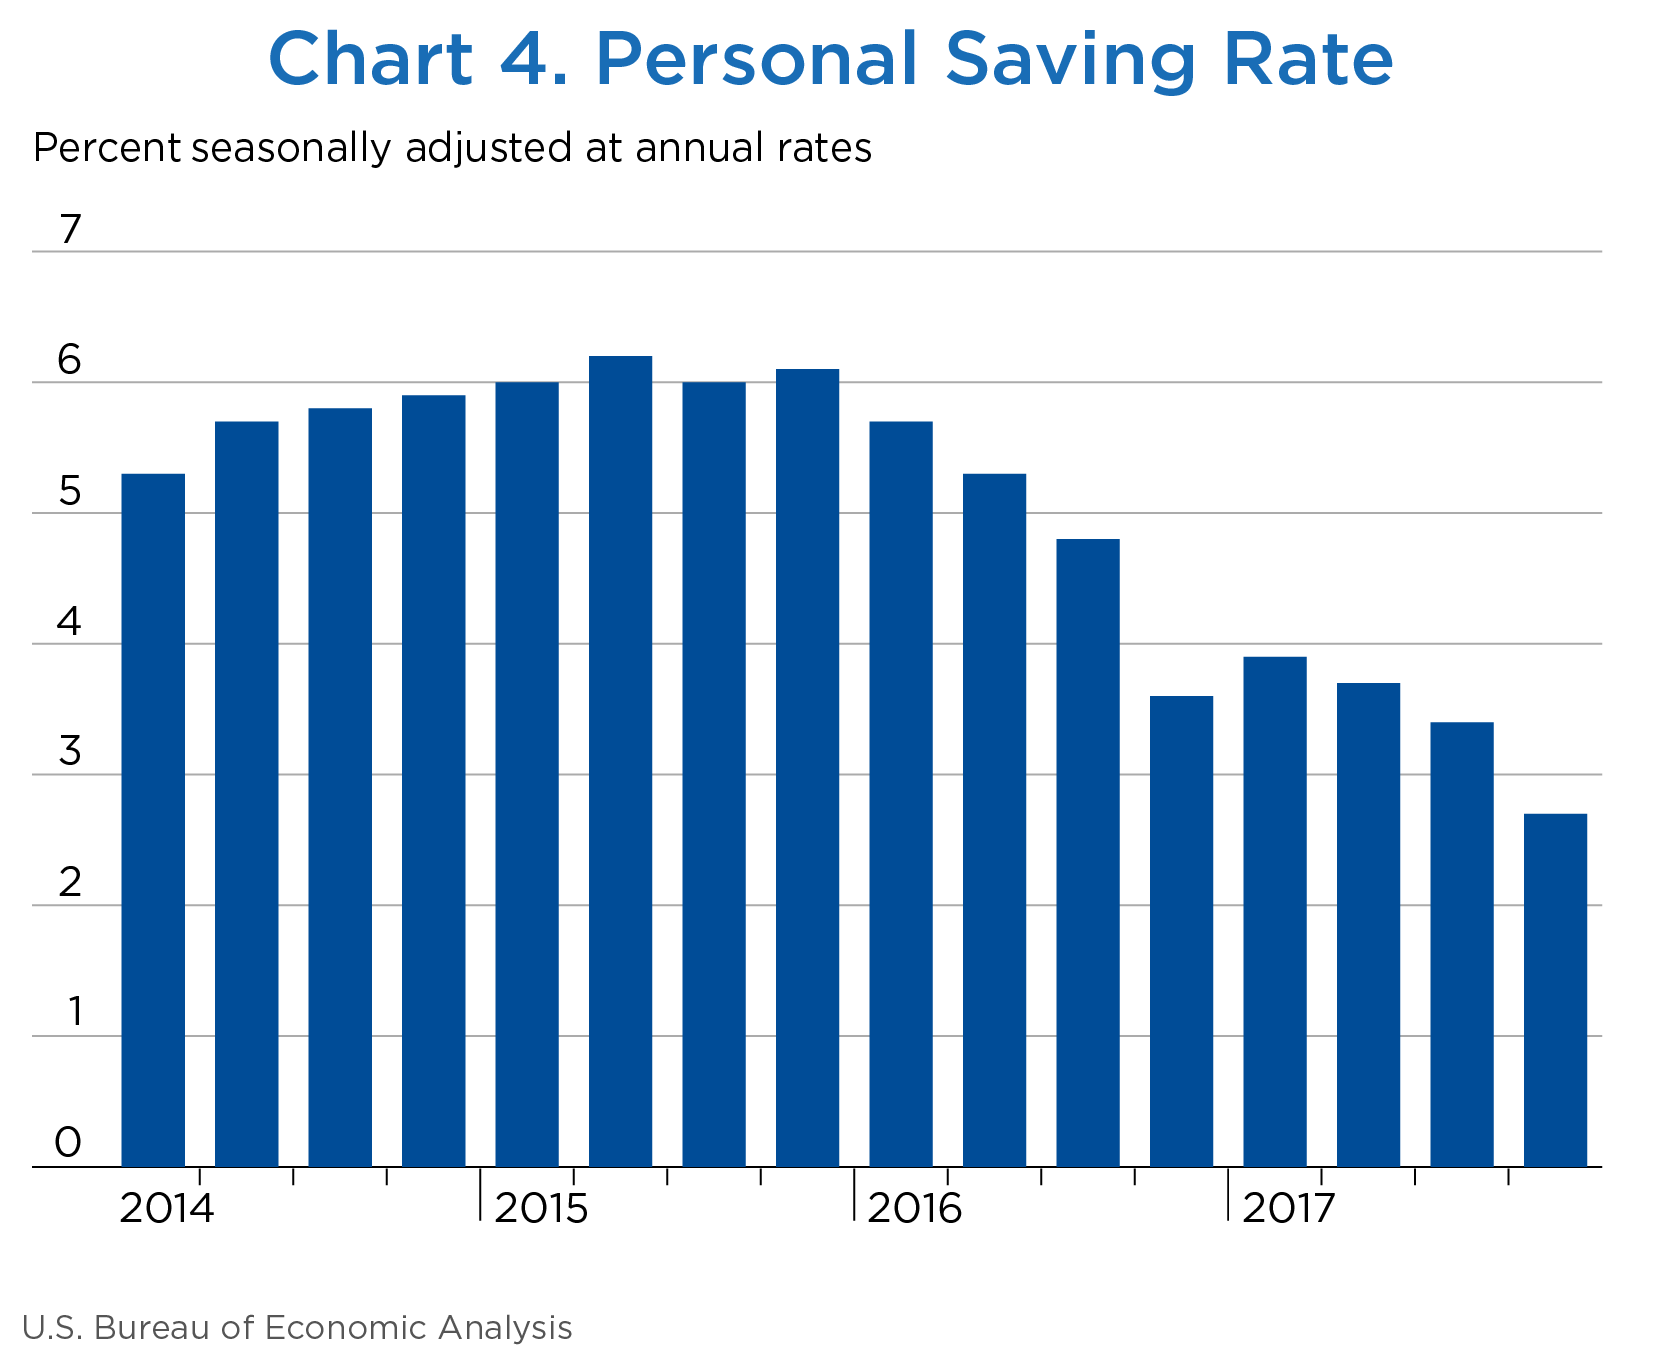
- The personal saving rate (line 33)—personal saving as a percentage of disposable personal income—was 2.7 percent in the fourth quarter (chart 4); the last time this rate was below 3.0 percent was in the fourth quarter of 2007 (2.8 percent).
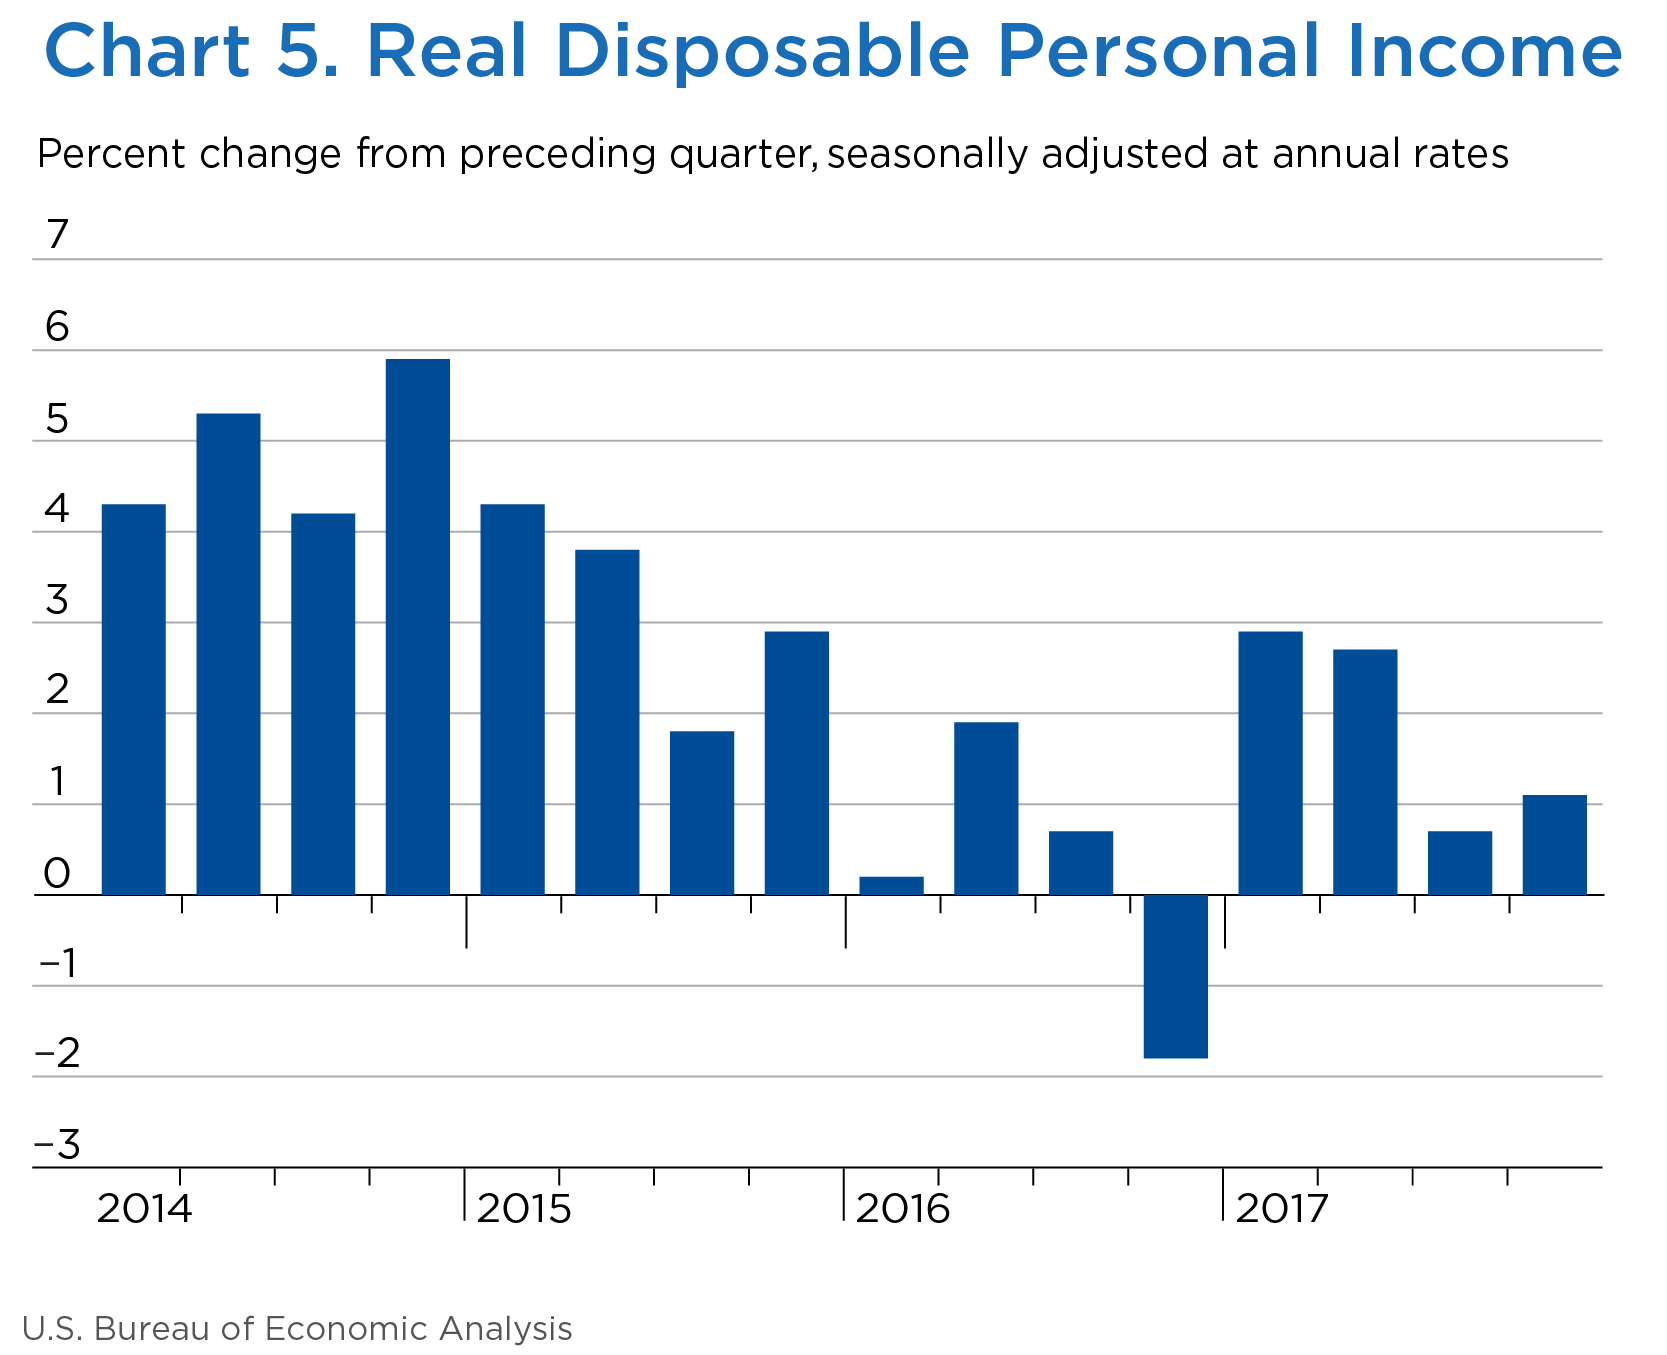
- Real disposable personal income (DPI) (line 35) increased 1.1 percent in the fourth quarter after increasing 0.7 percent in the third quarter (chart 5). Current-dollar DPI (line 34) increased 3.9 percent after increasing 2.2 percent. The differences in the movements in real DPI and current-dollar DPI reflected an acceleration in the implicit price deflator for consumer spending, which is used to deflate DPI.
| Line | Level | Change from preceding period | |||||
|---|---|---|---|---|---|---|---|
| 2017 | 2017 | ||||||
| III | IV | I | II | III | IV | ||
| 1 | Personal income | 16,468.9 | 16,658.1 | 219.5 | 94.3 | 129.4 | 189.2 |
| 2 | Compensation of employees | 10,356.1 | 10,461.8 | 151.4 | 76.7 | 113.1 | 105.7 |
| 3 | Wages and salaries | 8,392.6 | 8,483.8 | 124.3 | 63.1 | 97.4 | 91.3 |
| 4 | Private industries | 7,047.4 | 7,131.4 | 108.9 | 56.8 | 89.0 | 84.0 |
| 5 | Goods-producing industries | 1,376.4 | 1,390.7 | 20.7 | 9.3 | 16.6 | 14.2 |
| 6 | Manufacturing | 834.9 | 840.8 | 12.9 | 4.6 | 5.8 | 5.9 |
| 7 | Services-producing industries | 5,671.0 | 5,740.7 | 88.2 | 47.5 | 72.4 | 69.8 |
| 8 | Trade, transportation, and utilities | 1,307.8 | 1,322.9 | 25.6 | 7.1 | 12.2 | 15.1 |
| 9 | Other services-producing industries | 4,363.2 | 4,417.8 | 62.6 | 40.5 | 60.2 | 54.6 |
| 10 | Government | 1,345.1 | 1,352.4 | 15.3 | 6.3 | 8.4 | 7.3 |
| 11 | Supplements to wages and salaries | 1,963.5 | 1,978.0 | 27.1 | 13.6 | 15.7 | 14.5 |
| 12 | Proprietors' income with IVA and CCAdj | 1,381.9 | 1,401.8 | 25.7 | −1.6 | 3.3 | 19.9 |
| 13 | Farm | 31.9 | 28.7 | 4.0 | −4.8 | −5.1 | −3.2 |
| 14 | Nonfarm | 1,350.0 | 1,373.1 | 21.6 | 3.3 | 8.4 | 23.1 |
| 15 | Rental income of persons with CCAdj | 747.2 | 760.2 | 11.9 | 9.5 | 6.9 | 13.0 |
| 16 | Personal income receipts on assets | 2,433.9 | 2,477.6 | 28.5 | 14.4 | −0.6 | 43.7 |
| 17 | Personal interest income | 1,460.6 | 1,503.2 | 38.1 | −11.5 | −4.5 | 42.6 |
| 18 | Personal dividend income | 973.2 | 974.4 | −9.6 | 25.9 | 3.9 | 1.1 |
| 19 | Personal current transfer receipts | 2,858.4 | 2,879.2 | 35.9 | 5.1 | 21.4 | 20.9 |
| 20 | Government social benefits to persons | 2,798.5 | 2,818.6 | 35.5 | 4.3 | 20.7 | 20.1 |
| 21 | Social security | 930.0 | 935.4 | 10.1 | 6.8 | 7.2 | 5.4 |
| 22 | Medicare | 676.4 | 681.9 | 4.5 | 4.1 | 4.9 | 5.5 |
| 23 | Medicaid | 583.4 | 595.4 | 3.5 | −4.0 | 6.0 | 12.1 |
| 24 | Unemployment insurance | 28.5 | 27.8 | −0.4 | −1.7 | −0.1 | −0.7 |
| 25 | Veterans' benefits | 99.2 | 100.2 | 1.5 | 2.5 | 1.2 | 0.9 |
| 26 | Other | 481.0 | 477.9 | 16.3 | −3.4 | 1.6 | −3.1 |
| 27 | Other current transfer receipts, from business (net) | 59.9 | 60.7 | 0.5 | 0.7 | 0.7 | 0.8 |
| 28 | Less: Contributions for government social insurance | 1,308.5 | 1,322.6 | 33.9 | 9.7 | 14.7 | 14.2 |
| 29 | Less: Personal current taxes | 2,058.1 | 2,110.3 | 41.6 | −10.9 | 50.2 | 52.1 |
| 30 | Equals: Disposable personal income (DPI) | 14,410.8 | 14,547.8 | 177.9 | 105.2 | 79.2 | 137.0 |
| 31 | Less: Personal outlays | 13,927.2 | 14,159.2 | 134.9 | 134.1 | 121.2 | 232.0 |
| 32 | Equals: Personal saving | 483.7 | 388.7 | 43.0 | −28.9 | −42.1 | −95.0 |
| 33 | Personal saving as a percentage of DPI | 3.4 | 2.7 | ...... | ...... | ...... | ...... |
| Addenda: Percent change at annual rate | |||||||
| 34 | Current-dollar DPI | ...... | ...... | 5.2 | 3.0 | 2.2 | 3.9 |
| 35 | Real DPI, chained (2009) dollars | ...... | ...... | 2.9 | 2.7 | 0.7 | 1.1 |
- CCAdj
- Capital consumption adjustment
- IVA
- Inventory valuation adjustment
Note. Dollar levels and percent changes are from NIPA tables 2.1 and 2.2B.
[Click Chart to Expand]
[Click Chart to Expand]
Revisions
The percent change in real GDP was revised down 0.1 percentage point from the advance estimate, primarily reflecting a slight downward revision to private inventory investment.
- Consumer spending was unrevised, reflecting a downward revision to goods that was offset by an upward revision to services. The revision to goods was primarily due to a downward revision to clothing and footwear, and the revision to services was primarily due to an upward revision to financial services and insurance.
- The revision to private inventory investment was due to a downward revision to farm inventories.
| Line | Change from preceding period (percent) | Contribution to percent change in real GDP (percentage points) | |||||
|---|---|---|---|---|---|---|---|
| Advance estimate | Second estimate | Second estimate minus advance estimate | Advance estimate | Second estimate | Second estimate minus advance estimate | ||
| 1 | Gross domestic product (GDP)1 | 2.6 | 2.5 | −0.1 | 2.6 | 2.5 | −0.1 |
| 2 | Personal consumption expenditures | 3.8 | 3.8 | 0.0 | 2.58 | 2.58 | 0.00 |
| 3 | Goods | 8.2 | 7.5 | −0.7 | 1.76 | 1.61 | −0.15 |
| 4 | Durable goods | 14.2 | 13.8 | −0.4 | 1.02 | 0.99 | −0.03 |
| 5 | Nondurable goods | 5.2 | 4.3 | −0.9 | 0.74 | 0.62 | −0.12 |
| 6 | Services | 1.8 | 2.1 | 0.3 | 0.82 | 0.97 | 0.15 |
| 7 | Gross private domestic investment | 3.6 | 3.5 | −0.1 | 0.60 | 0.59 | −0.01 |
| 8 | Fixed investment | 7.9 | 8.1 | 0.2 | 1.27 | 1.29 | 0.02 |
| 9 | Nonresidential | 6.8 | 6.6 | −0.2 | 0.84 | 0.82 | −0.02 |
| 10 | Structures | 1.4 | 2.5 | 1.1 | 0.04 | 0.07 | 0.03 |
| 11 | Equipment | 11.4 | 11.8 | 0.4 | 0.62 | 0.64 | 0.02 |
| 12 | Intellectual property products | 4.5 | 2.4 | −2.1 | 0.18 | 0.10 | −0.08 |
| 13 | Residential | 11.6 | 13.0 | 1.4 | 0.42 | 0.47 | 0.05 |
| 14 | Change in private inventories | ...... | ...... | ...... | −0.67 | −0.70 | −0.03 |
| 15 | Net exports of goods and services | ...... | ...... | ...... | −1.13 | −1.13 | 0.00 |
| 16 | Exports | 6.9 | 7.1 | 0.2 | 0.82 | 0.84 | 0.02 |
| 17 | Goods | 12.6 | 12.0 | −0.6 | 0.96 | 0.92 | −0.04 |
| 18 | Services | −3.3 | −1.9 | 1.4 | −0.14 | −0.08 | 0.06 |
| 19 | Imports | 13.9 | 14.0 | 0.1 | −1.96 | −1.97 | −0.01 |
| 20 | Goods | 16.8 | 16.9 | 0.1 | −1.91 | −1.92 | −0.01 |
| 21 | Services | 1.7 | 1.9 | 0.2 | −0.05 | −0.05 | 0.00 |
| 22 | Government consumption expenditures and gross investment | 3.0 | 2.9 | −0.1 | 0.50 | 0.49 | −0.01 |
| 23 | Federal | 3.5 | 3.2 | −0.3 | 0.23 | 0.21 | −0.02 |
| 24 | National defense | 6.0 | 5.6 | −0.4 | 0.22 | 0.21 | −0.01 |
| 25 | Nondefense | 0.1 | 0.0 | −0.1 | 0.00 | 0.00 | 0.00 |
| 26 | State and local | 2.6 | 2.7 | 0.1 | 0.28 | 0.28 | 0.00 |
| Addenda: | |||||||
| 27 | Final sales of domestic product | 3.2 | 3.3 | 0.1 | 3.22 | 3.23 | 0.01 |
| 28 | Gross domestic purchases price index | 2.5 | 2.5 | 0.0 | ...... | ...... | ...... |
| 29 | GDP price index | 2.4 | 2.3 | −0.1 | ...... | ...... | ...... |
- The estimates under the contribution columns are also percent changes.
Real GDP 2017
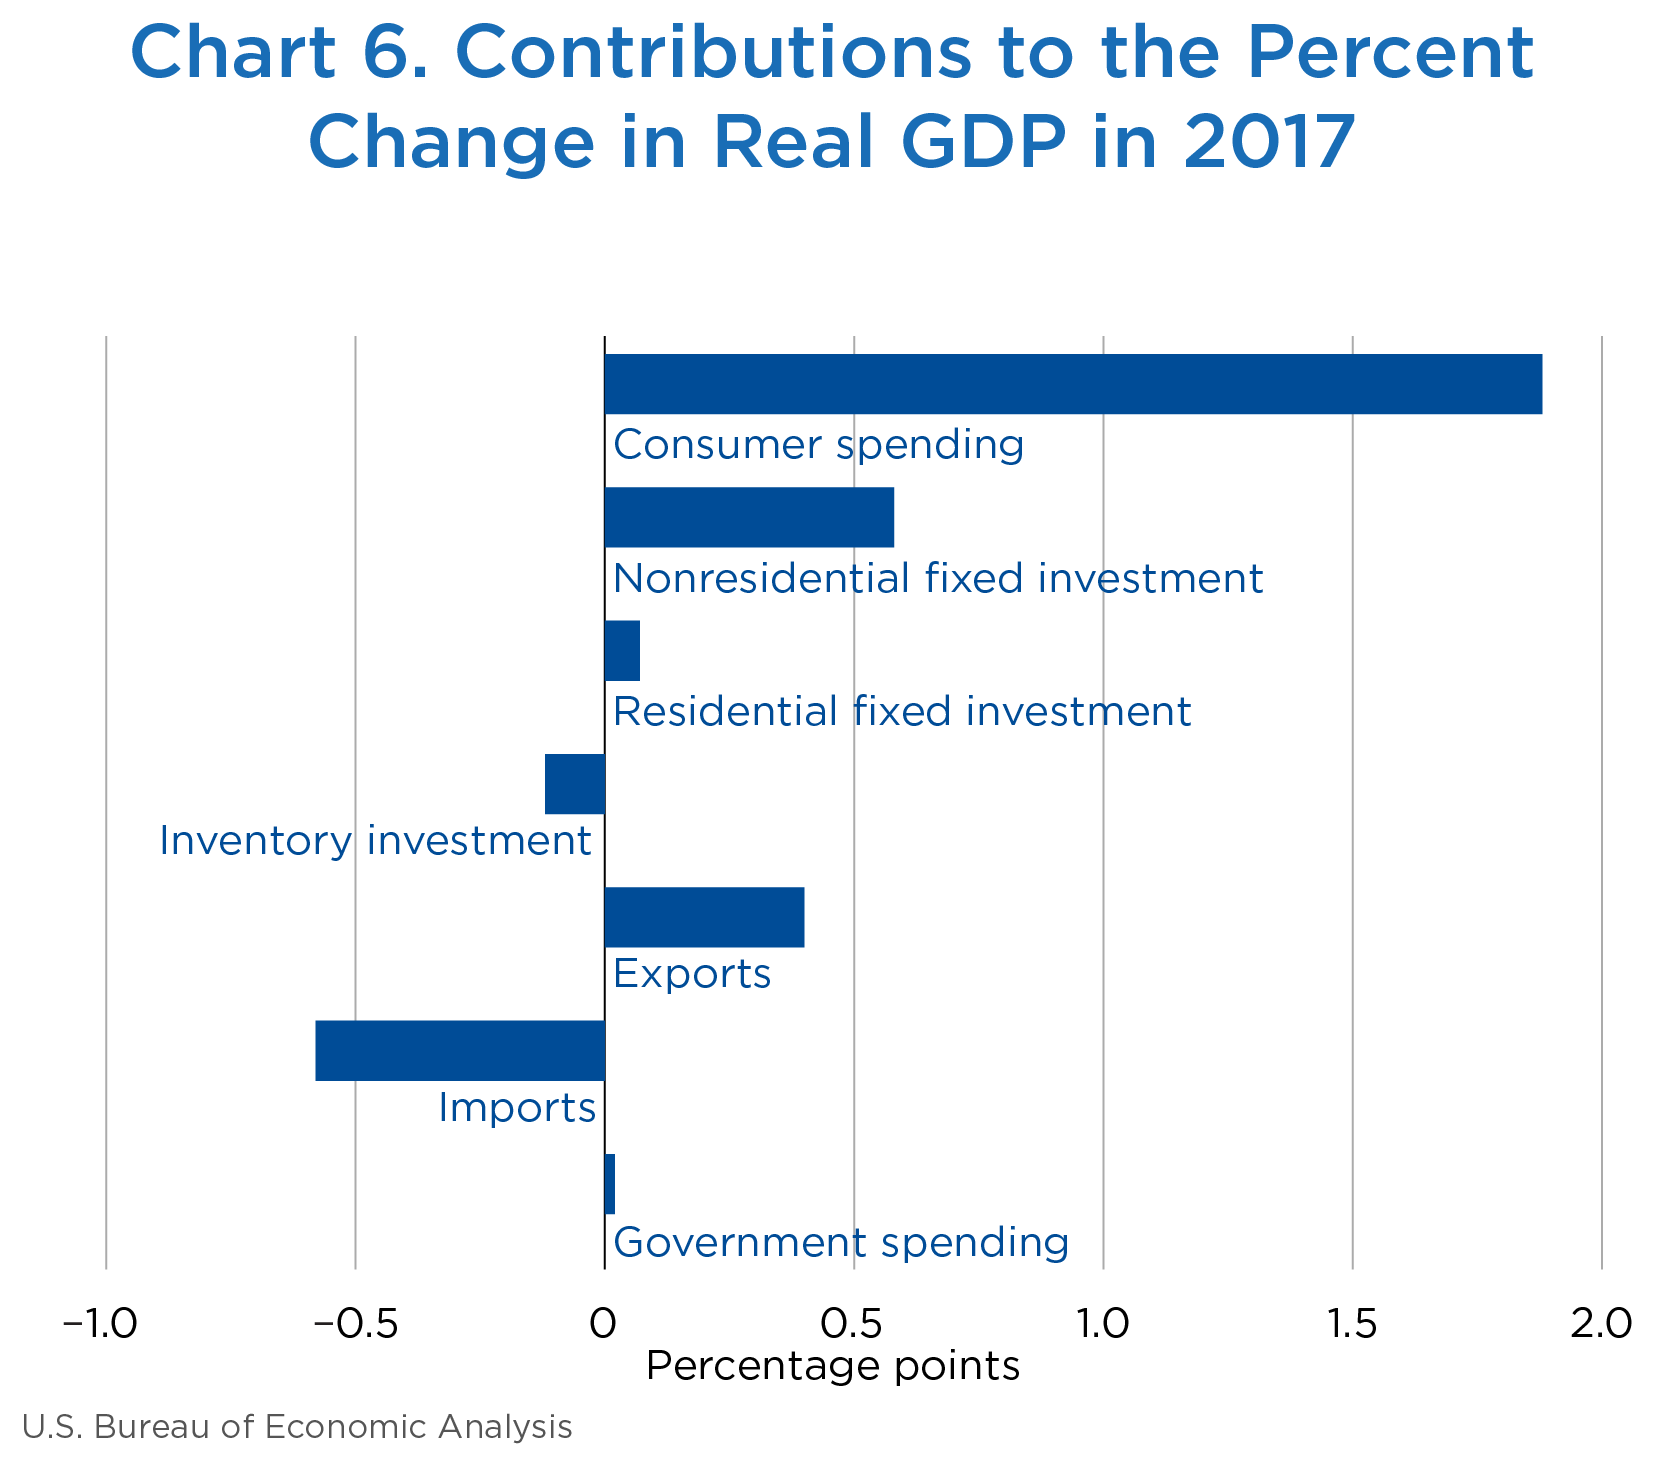
Real GDP (table 5, line 1) increased 2.3 percent in 2017 (from the 2016 annual level to the 2017 annual level) after increasing 1.5 percent in 2016. The increase in real GDP in 2017 primarily reflected positive contributions from consumer spending, nonresidential fixed investment, and exports (chart 6). Imports, which are a subtraction in the calculation of GDP, increased. The acceleration in real GDP from 2016 to 2017 reflected upturns in nonresidential fixed investment and in exports and a smaller decrease in inventory investment. These movements were partly offset by decelerations in residential fixed investment and in state and local government spending. Imports accelerated.
[Click Chart to Expand]
- The upturn in nonresidential fixed investment (line 9) reflected upturns in equipment and in structures that were partly offset by a deceleration in investment in intellectual property products. The upturn in equipment was widespread. The upturn in structures investment was more than accounted for by an upturn in mining exploration, shafts, and wells.
- The deceleration in residential fixed investment (line 13) primarily reflected no change to investment in “other” structures in 2017 after an increase of 5.2 percent in 2016. Within “other” structures, a downturn in residential improvements was the main contributor.
- The smaller decrease in inventory investment (line 14) primarily reflected a smaller decrease in manufacturing industries and an upturn in mining, utilities, and construction.
- The upturn in exports (line 16) primarily reflected an upturn in nonautomotive capital goods and an acceleration in industrial supplies and materials.
- The acceleration in imports (line 19) primarily reflected an acceleration in nonautomotive capital goods and an upturn in consumer goods excluding food and automotive.
- The deceleration in state and local government spending (line 26) primarily reflected a deceleration in consumption expenditures and a larger decrease in structures investment.
| Line | Share of current-dollar GDP (percent) | Change from preceding period (percent) | Contribution to percent change in real GDP (percentage points) | |||
|---|---|---|---|---|---|---|
| 2017 | 2016 | 2017 | 2016 | 2017 | ||
| 1 | Gross domestic product1 | 100.0 | 1.5 | 2.3 | 1.5 | 2.3 |
| 2 | Personal consumption expenditures | 69.1 | 2.7 | 2.7 | 1.86 | 1.88 |
| 3 | Goods | 22.2 | 3.7 | 3.8 | 0.81 | 0.84 |
| 4 | Durable goods | 7.6 | 5.5 | 6.7 | 0.41 | 0.50 |
| 5 | Nondurable goods | 14.5 | 2.8 | 2.4 | 0.40 | 0.35 |
| 6 | Services | 46.9 | 2.3 | 2.2 | 1.05 | 1.04 |
| 7 | Gross private domestic investment | 16.6 | −1.6 | 3.2 | −0.28 | 0.53 |
| 8 | Fixed investment | 16.5 | 0.7 | 4.0 | 0.12 | 0.65 |
| 9 | Nonresidential | 12.6 | −0.6 | 4.7 | −0.08 | 0.58 |
| 10 | Structures | 2.9 | −4.1 | 5.4 | −0.12 | 0.15 |
| 11 | Equipment | 5.7 | −3.4 | 4.8 | −0.20 | 0.27 |
| 12 | Intellectual property products | 4.1 | 6.3 | 4.0 | 0.25 | 0.16 |
| 13 | Residential | 3.9 | 5.5 | 1.8 | 0.20 | 0.07 |
| 14 | Change in private inventories | 0.1 | ...... | ...... | −0.40 | −0.12 |
| 15 | Net exports of goods and services | −2.9 | ...... | ...... | −0.23 | −0.18 |
| 16 | Exports | 12.1 | −0.3 | 3.4 | −0.04 | 0.40 |
| 17 | Goods | 8.0 | 0.3 | 4.5 | 0.02 | 0.35 |
| 18 | Services | 4.1 | −1.5 | 1.2 | −0.06 | 0.05 |
| 19 | Imports | 15.0 | 1.3 | 3.9 | −0.19 | −0.58 |
| 20 | Goods | 12.3 | 0.9 | 4.3 | −0.11 | −0.51 |
| 21 | Services | 2.8 | 3.1 | 2.6 | −0.09 | −0.07 |
| 22 | Government consumption expenditures and gross investment | 17.3 | 0.8 | 0.1 | 0.13 | 0.02 |
| 23 | Federal | 6.5 | 0.0 | 0.2 | 0.00 | 0.01 |
| 24 | National defense | 3.8 | −0.7 | 0.2 | −0.03 | 0.01 |
| 25 | Nondefense | 2.7 | 1.2 | 0.1 | 0.03 | 0.00 |
| 26 | State and local | 10.8 | 1.2 | 0.1 | 0.13 | 0.01 |
| Addenda: | ||||||
| 27 | Gross domestic income (GDI)2 | ...... | 0.9 | ...... | ...... | ...... |
| 28 | Average of GDP and GDI | ...... | 1.2 | ...... | ...... | ...... |
- The estimates of GDP under the contribution columns are also percent changes.
- GDI is deflated by the implicit price deflator for GDP.
Note. Percent changes are from NIPA table 1.1.1, contributions to percent change are from NIPA table 1.1.2, and shares are from NIPA table 1.1.10.
- “Real” estimates are in chained (2009) dollars, and price indexes are chain-type measures. Each GDP estimate for a quarter (advance, second, and third) incorporates increasingly comprehensive and improved source data; for more information, see “The Revisions to GDP, GDI, and Their Major Components” in the January 2018 Survey of Current Business. Quarterly estimates are expressed at seasonally adjusted annual rates, which reflect a rate of activity for a quarter as if it were maintained for a year.
- In this article, “consumer spending” refers to “personal consumption expenditures,” “inventory investment” refers to “change in private inventories,” and “government spending” refers to “government consumption expenditures and gross investment.”