
GDP and the Economy
Third Estimates for the Fourth Quarter of 2017
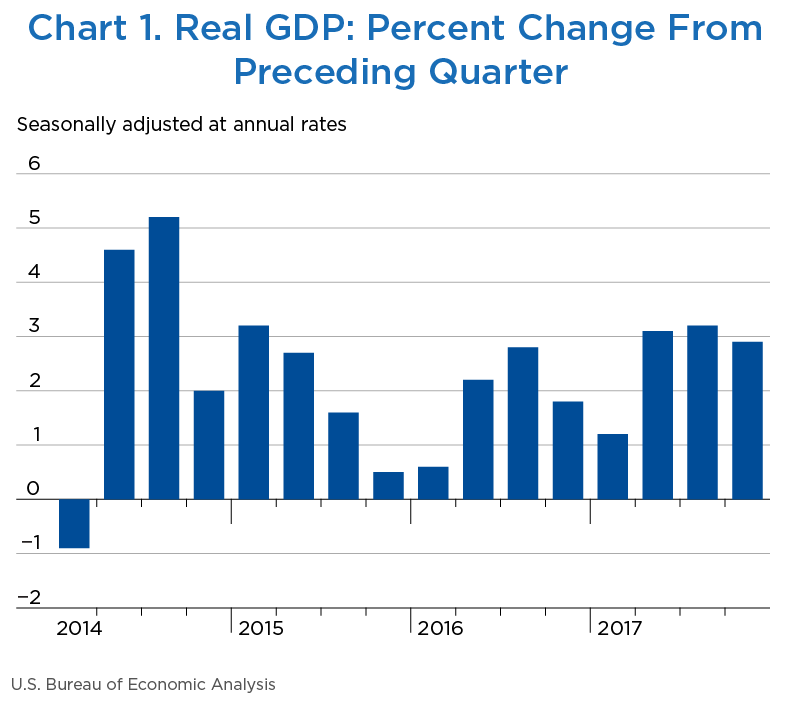
Real gross domestic product (GDP) increased 2.9 percent at an annual rate in the fourth quarter of 2017, according to the third estimates of the national income and product accounts (NIPAs) (chart 1 and table 1).1 Real GDP growth was revised up 0.4 percentage point from the second estimate of 2.5 percent, reflecting upward revisions to consumer spending and to inventory investment. In the third quarter, real GDP increased 3.2 percent.
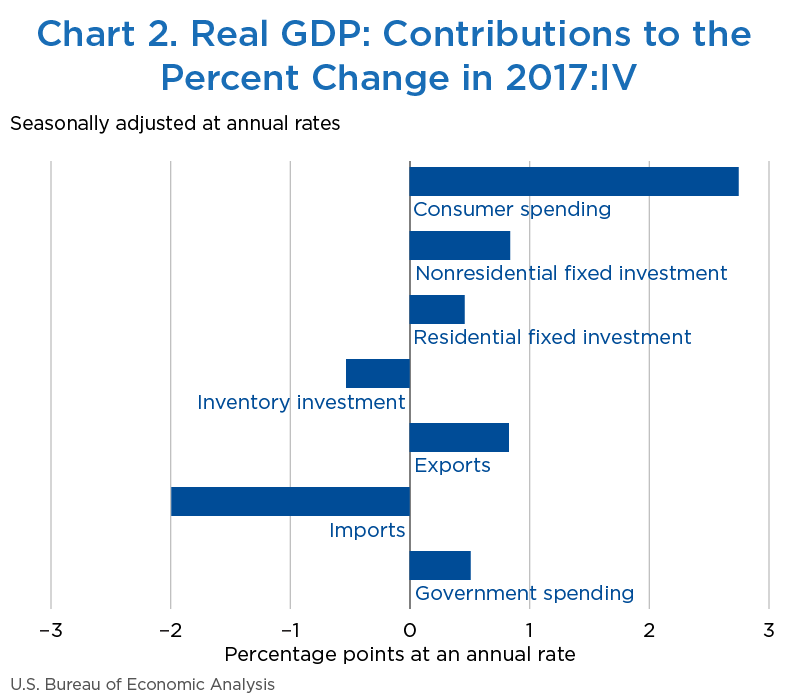
The increase in real GDP in the fourth quarter reflected increases in consumer spending, nonresidential fixed investment, exports, residential fixed investment, state and local government spending, and federal government spending that were partly offset by a decrease in inventory investment (chart 2).2 Imports, which are a subtraction in the calculation of GDP, increased.
[Click Chart to Expand]
[Click Chart to Expand]
The deceleration in real GDP growth in the fourth quarter reflected a downturn in inventory investment that was partly offset by accelerations in consumer spending, exports, state and local government spending, nonresidential fixed investment, and federal government spending and by an upturn in residential fixed investment. Imports, which are a subtraction in the calculation of GDP, turned up.
- The acceleration in consumer spending (line 2) reflected accelerations in spending for both goods and services.
- The main contributors to the acceleration in consumer spending on goods (line 3) were accelerations in recreational goods and vehicles, in food and beverages purchased for off-premises consumption, and in motor vehicles and parts and an upturn in clothing and footwear.
- The main contributors to the acceleration in consumer spending on services (line 6) were an acceleration in housing and utilities, mainly from an upturn in spending for electricity, and an upturn in net foreign travel (foreign travel by U.S. residents less expenditures in the United States by nonresidents).
- The acceleration in nonresidential fixed investment (line 9) was mainly due to upturns in commercial and health care structures and in manufacturing structures.
- The upturn in residential fixed investment (line 13) primarily reflected an upturn in “other” structures (which was mainly due to upturns in brokers’ commissions and other ownership transfer costs and in improvements).
- The downturn in inventory investment (line 14) primarily reflected downturns in wholesale trade and in manufacturing that were partly offset by an upturn in retail trade.
- The acceleration in exports (line 16) reflected an acceleration in exports of goods that was partly offset by a downturn in exports of services. The main contributor to the acceleration in exports of goods (line 17) was an upturn in industrial supplies and materials (mainly petroleum and products).
- The acceleration in federal government spending (line 23) primarily reflected an acceleration in national defense spending. The main contributor was an acceleration in investment in equipment (primarily aircraft).
- The acceleration in state and local government spending (line 26) primarily reflected an upturn in gross investment in structures.
- Real gross domestic income (GDI) increased 0.9 percent in the fourth quarter after increasing 2.4 percent in the third quarter (line 27). The average of real GDP and real GDI, a supplemental measure of U.S. economic activity that equally weights GDP and GDI, increased 1.9 percent in the fourth quarter after increasing 2.8 percent in the third quarter (line 28).
| Line | Share of current-dollar GDP (percent) | Change from preceding period (percent) | Contribution to percent change in real GDP (percentage points) | |||||||
|---|---|---|---|---|---|---|---|---|---|---|
| 2017 | 2017 | 2017 | ||||||||
| IV | I | II | III | IV | I | II | III | IV | ||
| 1 | Gross domestic product1 | 100.0 | 1.2 | 3.1 | 3.2 | 2.9 | 1.2 | 3.1 | 3.2 | 2.9 |
| 2 | Personal consumption expenditures | 69.1 | 1.9 | 3.3 | 2.2 | 4.0 | 1.32 | 2.24 | 1.49 | 2.75 |
| 3 | Goods | 22.3 | 0.7 | 5.4 | 4.5 | 7.8 | 0.15 | 1.16 | 0.97 | 1.67 |
| 4 | Durable goods | 7.7 | −0.1 | 7.6 | 8.6 | 13.7 | −0.01 | 0.56 | 0.63 | 0.98 |
| 5 | Nondurable goods | 14.6 | 1.1 | 4.2 | 2.3 | 4.8 | 0.16 | 0.61 | 0.34 | 0.69 |
| 6 | Services | 46.8 | 2.5 | 2.3 | 1.1 | 2.3 | 1.17 | 1.08 | 0.52 | 1.08 |
| 7 | Gross private domestic investment | 16.7 | −1.2 | 3.9 | 7.3 | 4.7 | −0.20 | 0.64 | 1.19 | 0.78 |
| 8 | Fixed investment | 16.6 | 8.1 | 3.2 | 2.4 | 8.2 | 1.27 | 0.53 | 0.40 | 1.31 |
| 9 | Nonresidential | 12.7 | 7.2 | 6.7 | 4.7 | 6.8 | 0.86 | 0.82 | 0.58 | 0.84 |
| 10 | Structures | 2.9 | 14.8 | 7.0 | −7.0 | 6.3 | 0.39 | 0.20 | −0.21 | 0.18 |
| 11 | Equipment | 5.8 | 4.4 | 8.8 | 10.8 | 11.6 | 0.24 | 0.48 | 0.58 | 0.63 |
| 12 | Intellectual property products | 4.1 | 5.7 | 3.7 | 5.2 | 0.8 | 0.23 | 0.15 | 0.21 | 0.03 |
| 13 | Residential | 3.9 | 11.1 | −7.3 | −4.7 | 12.8 | 0.41 | −0.30 | −0.18 | 0.46 |
| 14 | Change in private inventories | 0.1 | ...... | ...... | ...... | ...... | −1.46 | 0.12 | 0.79 | −0.53 |
| 15 | Net exports of goods and services | −3.0 | ...... | ...... | ...... | ...... | 0.22 | 0.21 | 0.36 | −1.16 |
| 16 | Exports | 12.2 | 7.3 | 3.5 | 2.1 | 7.0 | 0.85 | 0.42 | 0.25 | 0.83 |
| 17 | Goods | 8.1 | 10.8 | 2.2 | 1.8 | 11.6 | 0.81 | 0.18 | 0.15 | 0.89 |
| 18 | Services | 4.1 | 1.0 | 6.2 | 2.5 | −1.4 | 0.04 | 0.25 | 0.10 | −0.06 |
| 19 | Imports | 15.3 | 4.3 | 1.5 | −0.7 | 14.1 | −0.63 | −0.22 | 0.11 | −1.99 |
| 20 | Goods | 12.5 | 4.7 | 1.3 | −0.2 | 17.3 | −0.56 | −0.16 | 0.03 | −1.96 |
| 21 | Services | 2.7 | 2.5 | 2.2 | −2.6 | 1.1 | −0.07 | −0.06 | 0.07 | −0.03 |
| 22 | Government consumption expenditures and gross investment | 17.2 | −0.6 | −0.2 | 0.7 | 3.0 | −0.11 | −0.03 | 0.12 | 0.51 |
| 23 | Federal | 6.5 | −2.4 | 1.9 | 1.3 | 3.2 | −0.16 | 0.13 | 0.09 | 0.20 |
| 24 | National defense | 3.8 | −3.3 | 4.7 | 2.4 | 5.5 | −0.13 | 0.18 | 0.09 | 0.21 |
| 25 | Nondefense | 2.6 | −1.2 | −1.9 | −0.2 | −0.1 | −0.03 | −0.05 | −0.01 | 0.00 |
| 26 | State and local | 10.8 | 0.5 | −1.5 | 0.2 | 2.9 | 0.05 | −0.16 | 0.03 | 0.31 |
| Addenda: | ||||||||||
| 27 | Gross domestic income (GDI)2 | ...... | 2.7 | 2.3 | 2.4 | 0.9 | ...... | ...... | ...... | ...... |
| 28 | Average of GDP and GDI | ...... | 2.0 | 2.7 | 2.8 | 1.9 | ...... | ...... | ...... | ...... |
| 29 | Final sales of domestic product | 99.9 | 2.7 | 2.9 | 2.4 | 3.4 | 2.70 | 2.94 | 2.37 | 3.41 |
| 30 | Goods | 29.6 | −1.6 | 7.3 | 9.6 | 2.6 | −0.47 | 2.10 | 2.74 | 0.78 |
| 31 | Services | 62.2 | 1.5 | 2.1 | 1.5 | 1.9 | 0.91 | 1.32 | 0.93 | 1.18 |
| 32 | Structures | 8.1 | 10.3 | −4.3 | −6.2 | 12.2 | 0.80 | −0.36 | −0.51 | 0.93 |
| 33 | Motor vehicle output | 2.8 | −7.3 | 0.8 | −10.3 | 35.1 | −0.22 | 0.02 | −0.30 | 0.83 |
| 34 | GDP excluding motor vehicle output | 97.2 | 1.5 | 3.1 | 3.6 | 2.1 | 1.45 | 3.04 | 3.45 | 2.05 |
| 35 | Final sales of computers | 0.4 | 23.3 | 22.3 | −24.2 | 19.8 | 0.08 | 0.08 | −0.10 | 0.07 |
| 36 | GDP excluding final sales of computers | 99.6 | 1.2 | 3.0 | 3.3 | 2.8 | 1.16 | 2.98 | 3.26 | 2.82 |
| 37 | Research and development (R&D) | 2.5 | 7.1 | 1.3 | 0.9 | −0.4 | 0.18 | 0.03 | 0.02 | −0.01 |
| 38 | GDP excluding R&D | 97.5 | 1.1 | 3.1 | 3.2 | 3.0 | 1.06 | 3.03 | 3.13 | 2.90 |
- The estimates of GDP under the contribution columns are also percent changes.
- GDI is deflated by the implicit price deflator for GDP.
Note. Percent changes are from NIPA tables 1.1.1 and 1.2.1, contributions are from NIPA tables 1.1.2 and 1.2.2, and shares are from NIPA table 1.1.10 or are calculated from NIPA table 1.2.5. For GDI, percent changes are from NIPA table 1.7.1.
[View larger chart]
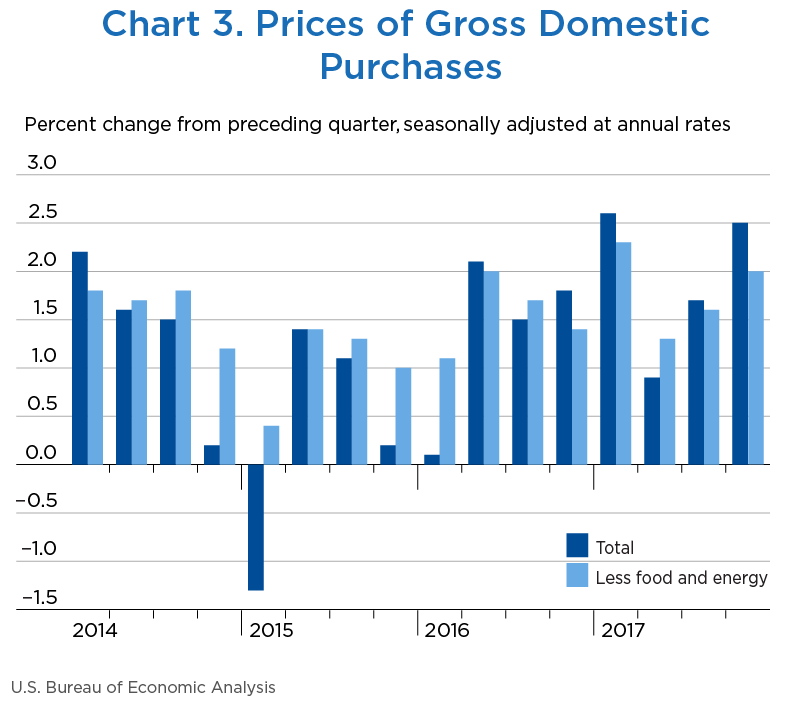
Prices of goods and services purchased by U.S. residents increased 2.5 percent in the fourth quarter after increasing 1.7 percent in the third quarter (table 2, line 1, and chart 3); the third estimates were unrevised from the second estimates. The acceleration mainly reflected an acceleration in consumer prices. Excluding food and energy, prices of goods and services purchased by U.S. residents increased 2.0 percent after increasing 1.6 percent.
- Prices paid for consumer goods (line 3) accelerated, primarily reflecting an acceleration in the prices paid for gasoline and other energy goods that was partly offset by a downturn in prices for clothing and footwear and by a larger decrease in prices for recreational goods and vehicles.
- Prices paid for consumer services (line 6) accelerated, primarily reflecting accelerations in the prices for financial services, food services and accommodations, and transportation services.
- Consumer prices for energy (line 26) increased more in the fourth quarter than in the third quarter, and food prices (line 25) increased at the same rate. Consumer prices excluding food and energy (line 27), a measure of the “core” rate of inflation, accelerated, increasing 1.9 percent in the fourth quarter after increasing 1.3 percent in the third quarter.
| Line | Change from preceding period (percent) | Contribution to percent change in gross domestic purchases prices (percentage points) | |||||||
|---|---|---|---|---|---|---|---|---|---|
| 2017 | 2017 | ||||||||
| I | II | III | IV | I | II | III | IV | ||
| 1 | Gross domestic purchases1 | 2.6 | 0.9 | 1.7 | 2.5 | 2.6 | 0.9 | 1.7 | 2.5 |
| 2 | Personal consumption expenditures | 2.2 | 0.3 | 1.5 | 2.7 | 1.50 | 0.18 | 1.02 | 1.83 |
| 3 | Goods | 2.7 | −3.6 | 0.7 | 1.8 | 0.57 | −0.79 | 0.16 | 0.38 |
| 4 | Durable goods | 1.0 | −3.6 | −2.5 | −2.1 | 0.07 | −0.27 | −0.19 | −0.15 |
| 5 | Nondurable goods | 3.6 | −3.6 | 2.4 | 3.8 | 0.50 | −0.52 | 0.34 | 0.53 |
| 6 | Services | 2.0 | 2.2 | 1.9 | 3.2 | 0.92 | 0.97 | 0.87 | 1.44 |
| 7 | Gross private domestic investment | 1.7 | 2.6 | 1.9 | 1.0 | 0.27 | 0.40 | 0.30 | 0.16 |
| 8 | Fixed investment | 1.6 | 2.5 | 1.9 | 1.0 | 0.25 | 0.40 | 0.30 | 0.16 |
| 9 | Nonresidential | 1.5 | 1.9 | 1.1 | 0.6 | 0.19 | 0.23 | 0.14 | 0.07 |
| 10 | Structures | 3.1 | 3.8 | 4.5 | 1.9 | 0.08 | 0.11 | 0.12 | 0.05 |
| 11 | Equipment | 0.7 | 0.8 | 0.2 | 0.2 | 0.04 | 0.04 | 0.01 | 0.01 |
| 12 | Intellectual property products | 1.6 | 1.9 | 0.1 | 0.0 | 0.06 | 0.08 | 0.00 | 0.00 |
| 13 | Residential | 1.7 | 4.6 | 4.4 | 2.5 | 0.06 | 0.17 | 0.16 | 0.09 |
| 14 | Change in private inventories | ...... | ...... | ...... | ...... | 0.02 | 0.01 | 0.00 | 0.00 |
| 15 | Government consumption expenditures and gross investment | 4.8 | 1.6 | 2.3 | 3.0 | 0.80 | 0.27 | 0.38 | 0.50 |
| 16 | Federal | 5.5 | 1.8 | 1.1 | 1.7 | 0.34 | 0.11 | 0.07 | 0.11 |
| 17 | National defense | 4.9 | 1.4 | 0.4 | 1.5 | 0.18 | 0.05 | 0.02 | 0.06 |
| 18 | Nondefense | 6.3 | 2.3 | 2.1 | 2.1 | 0.16 | 0.06 | 0.05 | 0.05 |
| 19 | State and local | 4.4 | 1.5 | 3.0 | 3.8 | 0.46 | 0.16 | 0.31 | 0.39 |
| Addenda: | |||||||||
| 20 | Gross domestic purchases: | ||||||||
| 21 | Food | 0.3 | 2.1 | 0.2 | 0.1 | 0.02 | 0.10 | 0.01 | 0.01 |
| 22 | Energy goods and services | 15.9 | −16.0 | 8.4 | 28.2 | 0.40 | −0.45 | 0.21 | 0.66 |
| 23 | Excluding food and energy | 2.3 | 1.3 | 1.6 | 2.0 | 2.14 | 1.21 | 1.49 | 1.82 |
| 24 | Personal consumption expenditures (PCE): | ||||||||
| 25 | Food and beverages purchased for off-premises consumption | 0.3 | 2.0 | 0.2 | 0.2 | ...... | ...... | ...... | ...... |
| 26 | Energy goods and services | 15.5 | −16.0 | 8.4 | 27.7 | ...... | ...... | ...... | ...... |
| 27 | Excluding food and energy | 1.8 | 0.9 | 1.3 | 1.9 | ...... | ...... | ...... | ...... |
| 28 | Gross domestic product (GDP) | 2.0 | 1.0 | 2.1 | 2.3 | ...... | ...... | ...... | ...... |
| 29 | Exports of goods and services | 2.5 | −0.1 | 3.3 | 5.8 | ...... | ...... | ...... | ...... |
| 30 | Imports of goods and services | 6.2 | −1.0 | 0.4 | 6.1 | ...... | ...... | ...... | ...... |
- The estimates under the contribution columns are also percent changes.
Note. Most percent changes are from NIPA table 1.6.7; percent changes for PCE for food and energy goods and services and for PCE excluding food and energy are from NIPA table 2.3.7. Contributions are from NIPA table 1.6.8. GDP, export, and import prices are from NIPA table 1.1.7.
According to the third estimate of the NIPAs, real GDP increased 2.9 percent in the fourth quarter, an upward revision of 0.4 percentage point from the second estimate (table 3, line 1); the general picture of economic growth remains the same. The upward revision to the growth rate in real GDP reflected upward revisions to consumer spending for services and to inventory investment.
- The revision to consumer spending for services (line 6) was primarily to transportation services, reflecting the incorporation of newly available and revised data from the Census Bureau's Quarterly Services Report.
- The revision to inventory investment (line 14) mainly reflected an upward revision to nonfarm inventory investment that was based on revised wholesale trade inventories of nondurable goods for December from the Census Bureau's Monthly Wholesale Trade Report.
| Line | Change from preceding period (percent) | Contribution to percent change in real GDP (percentage points) | |||||
|---|---|---|---|---|---|---|---|
| Second estimate | Third estimate | Third estimate minus second estimate | Second estimate | Third estimate | Third estimate minus second estimate | ||
| 1 | Gross domestic product1 | 2.5 | 2.9 | 0.4 | 2.5 | 2.9 | 0.4 |
| 2 | Personal consumption expenditures | 3.8 | 4.0 | 0.2 | 2.58 | 2.75 | 0.17 |
| 3 | Goods | 7.5 | 7.8 | 0.3 | 1.61 | 1.67 | 0.06 |
| 4 | Durable goods | 13.8 | 13.7 | −0.1 | 0.99 | 0.98 | −0.01 |
| 5 | Nondurable goods | 4.3 | 4.8 | 0.5 | 0.62 | 0.69 | 0.07 |
| 6 | Services | 2.1 | 2.3 | 0.2 | 0.97 | 1.08 | 0.11 |
| 7 | Gross private domestic investment | 3.5 | 4.7 | 1.2 | 0.59 | 0.78 | 0.19 |
| 8 | Fixed investment | 8.1 | 8.2 | 0.1 | 1.29 | 1.31 | 0.02 |
| 9 | Nonresidential | 6.6 | 6.8 | 0.2 | 0.82 | 0.84 | 0.02 |
| 10 | Structures | 2.5 | 6.3 | 3.8 | 0.07 | 0.18 | 0.11 |
| 11 | Equipment | 11.8 | 11.6 | −0.2 | 0.64 | 0.63 | −0.01 |
| 12 | Intellectual property products | 2.4 | 0.8 | −1.6 | 0.10 | 0.03 | −0.07 |
| 13 | Residential | 13.0 | 12.8 | −0.2 | 0.47 | 0.46 | −0.01 |
| 14 | Change in private inventories | ...... | ...... | ...... | −0.70 | −0.53 | 0.17 |
| 15 | Net exports of goods and services | ...... | ...... | ...... | −1.13 | −1.16 | −0.03 |
| 16 | Exports | 7.1 | 7.0 | −0.1 | 0.84 | 0.83 | −0.01 |
| 17 | Goods | 12.0 | 11.6 | −0.4 | 0.92 | 0.89 | −0.03 |
| 18 | Services | −1.9 | −1.4 | 0.5 | −0.08 | −0.06 | 0.02 |
| 19 | Imports | 14.0 | 14.1 | 0.1 | −1.97 | −1.99 | −0.02 |
| 20 | Goods | 16.9 | 17.3 | 0.4 | −1.92 | −1.96 | −0.04 |
| 21 | Services | 1.9 | 1.1 | −0.8 | −0.05 | −0.03 | 0.02 |
| 22 | Government consumption expenditures and gross investment | 2.9 | 3.0 | 0.1 | 0.49 | 0.51 | 0.02 |
| 23 | Federal | 3.2 | 3.2 | 0.0 | 0.21 | 0.20 | −0.01 |
| 24 | National defense | 5.6 | 5.5 | −0.1 | 0.21 | 0.21 | 0.00 |
| 25 | Nondefense | 0.0 | −0.1 | −0.1 | 0.00 | 0.00 | 0.00 |
| 26 | State and local | 2.7 | 2.9 | 0.2 | 0.28 | 0.31 | 0.03 |
| Addenda: | |||||||
| 27 | Final sales of domestic product | 3.3 | 3.4 | 0.1 | 3.23 | 3.41 | 0.18 |
| 28 | Gross domestic purchases price index | 2.5 | 2.5 | 0.0 | ...... | ...... | ...... |
| 29 | GDP price index | 2.3 | 2.3 | 0.0 | ...... | ...... | ...... |
- The estimates under the contribution columns are also percent changes.
Measured in current dollars, profits from current production (corporate profits with the inventory valuation (IVA) adjustment and the capital consumption adjustment) decreased $1.1 billion, or 0.1 percent at a quarterly rate, in the fourth quarter after increasing $90.2 billion, or 4.3 percent, in the third quarter (table 4, line 1). In the fourth quarter, profits of domestic financial corporations decreased $14.6 billion (line 3), profits of domestic nonfinancial corporations increased $19.4 billion (line 4), and rest-of-the-world profits decreased $5.9 billion (line 5).
The 2017 Tax Cuts and Jobs Act, enacted in December 2017, does not affect corporate profits from current production or gross domestic income, but it does affect corporate net cash flow in the fourth quarter. Net cash flow with IVA (line 12) decreased $792.1 billion in the fourth quarter reflecting a one-time deemed repatriation tax on accumulated foreign earnings that BEA recorded as a capital transfer from business to the federal government. For more information about the act, including provisions that will affect estimates for the first quarter of 2018, see the FAQ “How does the 2017 Tax Cuts and Jobs Act affect BEA's business income statistics?”
| Line | Billions of dollars (annual rate) | Percent change from preceding quarter (quarterly rate) | ||||||||
|---|---|---|---|---|---|---|---|---|---|---|
| Level | Change from preceding quarter | |||||||||
| 2017 | 2017 | 2017 | ||||||||
| IV | I | II | III | IV | I | II | III | IV | ||
| Current production measures: | ||||||||||
| 1 | Corporate profits with IVA and CCAdj | 2,212.5 | −46.2 | 14.4 | 90.2 | −1.1 | −2.1 | 0.7 | 4.3 | −0.1 |
| 2 | Domestic industries | 1,770.9 | −36.9 | 25.2 | 58.2 | 4.8 | −2.1 | 1.5 | 3.4 | 0.3 |
| 3 | Financial | 474.8 | −40.7 | −33.8 | 47.8 | −14.6 | −7.9 | −7.1 | 10.8 | −3.0 |
| 4 | Nonfinancial | 1,296.1 | 3.8 | 59.1 | 10.4 | 19.4 | 0.3 | 4.9 | 0.8 | 1.5 |
| 5 | Rest of the world | 441.6 | −9.3 | −10.8 | 32.0 | −5.9 | −2.1 | −2.5 | 7.7 | −1.3 |
| 6 | Receipts from the rest of the world | 751.9 | 5.4 | 5.5 | 26.9 | 14.9 | 0.8 | 0.8 | 3.8 | 2.0 |
| 7 | Less: Payments to the rest of the world | 310.2 | 14.7 | 16.3 | −5.2 | 20.8 | 5.6 | 5.9 | −1.7 | 7.2 |
| 8 | Less: Taxes on corporate income | 445.6 | −3.2 | 13.3 | −4.2 | −29.9 | −0.7 | 2.9 | −0.9 | −6.3 |
| 9 | Equals: Profits after tax | 1,767.0 | −43.0 | 1.1 | 94.4 | 28.8 | −2.6 | 0.1 | 5.7 | 1.7 |
| 10 | Net dividends | 979.9 | 9.0 | 6.2 | 4.4 | −18.8 | 0.9 | 0.6 | 0.4 | −1.9 |
| 11 | Undistributed profits from current production | 787.1 | −52.0 | −5.1 | 90.0 | 47.5 | −7.4 | −0.8 | 13.9 | 6.4 |
| 12 | Net cash flow with IVA | 1,438.8 | −40.0 | 40.8 | −39.0 | −792.1 | −1.8 | 1.8 | −1.7 | −35.5 |
- CCAdj
- Capital consumption adjustment
- IVA
- Inventory valuation adjustment
Note. Levels of these and other profits series are shown in NIPA tables 1.12 and 6.16D.
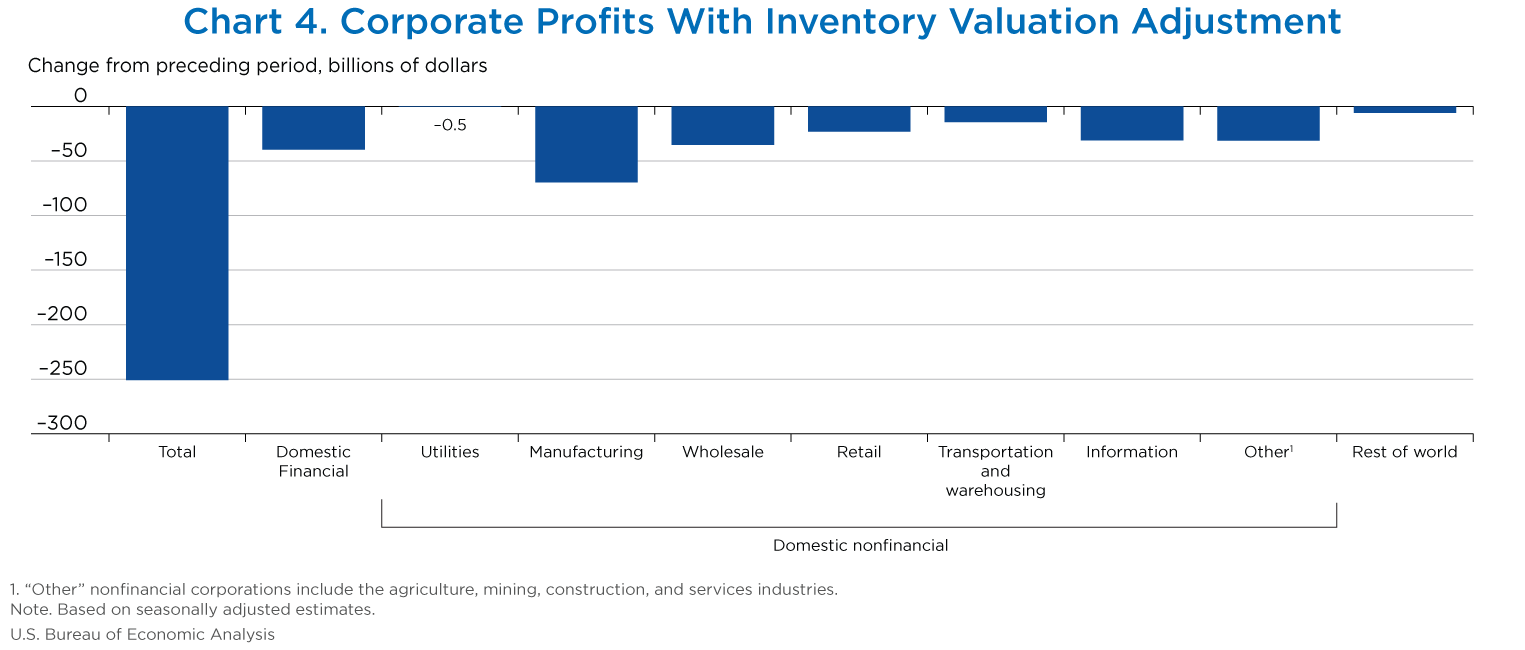
Industry profits (corporate profits by industry with the inventory valuation adjustment) decreased $250.9 billion, or 10.9 percent at a quarterly rate, in the fourth quarter after increasing $90.5 billion, or 4.1 percent, in the third quarter (table 5, line 1).
BEA's estimates of industry profits are affected by the bonus depreciation provisions in the 2017 Tax Cuts and Jobs Act because these estimates of industry profits reflect a deduction for the depreciation of fixed assets reported on a tax-return basis. Because the capital consumption adjustment (CCAdj) is not available by industry, the tax-return-based depreciation cannot be converted to the current-cost economic depreciation used in the featured measures of NIPA corporate profits. The CCAdj (line 16), increased $249.8 billion in the fourth quarter. For a more detailed discussion of the effect of bonus depreciation tax provisions, see the FAQ “How do changes in the tax treatment of depreciation impact NIPA Corporate Profits?”
| Line | Billions of dollars (annual rate) | Percent change from preceding quarter (quarterly rate) | ||||||||
|---|---|---|---|---|---|---|---|---|---|---|
| Level | Change from preceding quarter | |||||||||
| 2017 | 2017 | 2017 | ||||||||
| IV | I | II | III | IV | I | II | III | IV | ||
| Industry profits: | ||||||||||
| 1 | Corporate profits with IVA | 2,060.4 | −37.5 | 18.9 | 90.5 | −250.9 | −1.7 | 0.9 | 4.1 | −10.9 |
| 2 | Domestic industries | 1,618.7 | −28.2 | 29.8 | 58.5 | −245.0 | −1.6 | 1.7 | 3.2 | −13.1 |
| 3 | Financial | 497.3 | −41.1 | −33.8 | 47.0 | −39.6 | −7.3 | −6.4 | 9.6 | −7.4 |
| 4 | Nonfinancial | 1,121.5 | 12.8 | 63.5 | 11.5 | −205.3 | 1.0 | 5.1 | 0.9 | −15.5 |
| 5 | Utilities | 25.8 | 6.5 | 0.6 | −2.0 | −0.5 | 30.6 | 2.1 | −6.9 | −1.9 |
| 6 | Manufacturing | 349.6 | −16.4 | 19.2 | 29.7 | −69.7 | −4.2 | 5.2 | 7.6 | −16.6 |
| 7 | Wholesale trade | 70.1 | −8.0 | 17.5 | −2.4 | −35.3 | −8.2 | 19.4 | −2.2 | −33.5 |
| 8 | Retail trade | 161.7 | −4.2 | 4.4 | 0.9 | −23.1 | −2.3 | 2.4 | 0.5 | −12.5 |
| 9 | Transportation and warehousing | 45.9 | 9.4 | 14.5 | −13.4 | −14.3 | 19.0 | 24.5 | −18.2 | −23.7 |
| 10 | Information | 111.7 | −3.7 | −7.2 | 11.8 | −31.1 | −2.6 | −5.2 | 9.0 | −21.8 |
| 11 | Other nonfinancial | 356.7 | 29.3 | 14.5 | −13.1 | −31.3 | 8.2 | 3.8 | −3.3 | −8.1 |
| 12 | Rest of the world | 441.6 | −9.3 | −10.8 | 32.0 | −5.9 | −2.1 | −2.5 | 7.7 | −1.3 |
| Addenda: | ||||||||||
| 13 | Profits before tax (without IVA and CCAdj) | 2,125.8 | 20.0 | −22.5 | 79.5 | −208.0 | 0.9 | −1.0 | 3.5 | −8.9 |
| 14 | Profits after tax (without IVA and CCAdj) | 1,680.3 | 23.1 | −35.8 | 83.7 | −178.1 | 1.3 | −2.0 | 4.7 | −9.6 |
| 15 | IVA | −65.4 | −57.5 | 41.4 | 11.0 | −42.9 | ...... | ...... | ...... | ...... |
| 16 | CCAdj | 152.2 | −8.7 | −4.5 | −0.2 | 249.8 | ...... | ...... | ...... | ...... |
- CCAdj
- Capital consumption adjustment
- IVA
- Inventory valuation adjustment
Note. Levels of these and other profits series are shown in NIPA tables 1.12, 1.14, and 6.16D.
[Click Chart to Expand]
- “Real” estimates are in chained (2009) dollars, and price indexes are chain-type measures. Each GDP estimate for a quarter (advance, second, and third) incorporates increasingly comprehensive and improved source data; for more information, see “The Revisions to GDP, GDI, and Their Major Components” in the January 2018 Survey of Current Business. Quarterly estimates are expressed at seasonally adjusted annual rates, which reflect a rate of activity for a quarter as if it were maintained for a year.
- In this article, “consumer spending” refers to “personal consumption expenditures,” “inventory investment” refers to “change in private inventories,” and “government spending” refers to “government consumption expenditures and gross investment.”