Government Receipts and Expenditures
Fourth Quarter of 2017
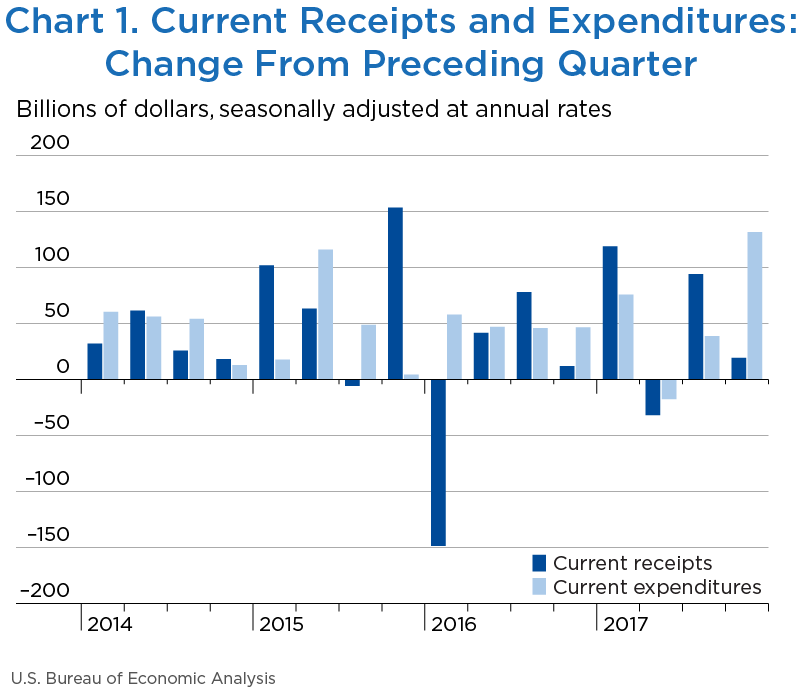
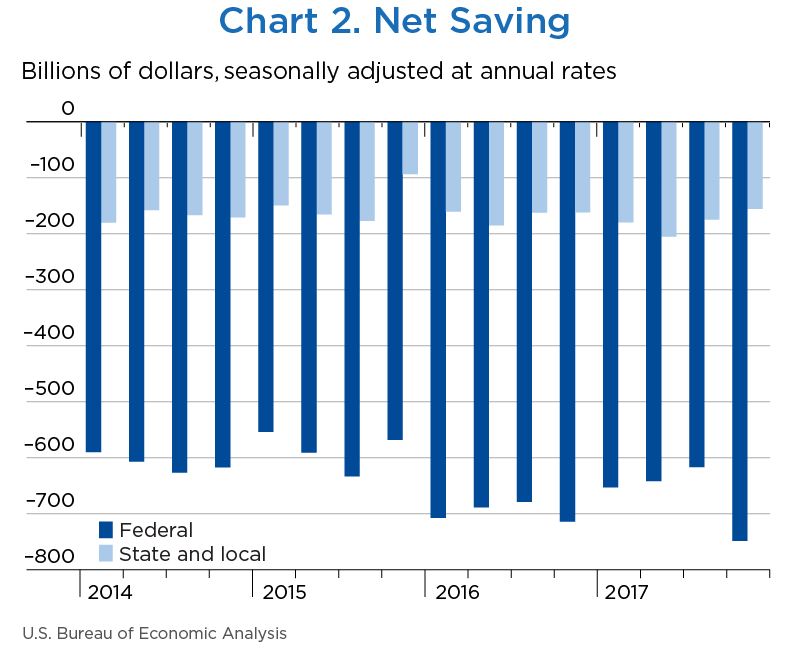
Net government saving, the difference between current receipts and current expenditures in the federal government and state and local governments, was −$904.1 billion in the fourth quarter of 2017, decreasing $112.3 billion from −$791.8 billion in the third quarter of 2017 (charts 1 and 2 and table 1).
“Net lending or net borrowing (−)” is an alternative measure of the government fiscal position. Net borrowing is the financing requirement of the government sector, and it is derived as net government saving plus the consumption of fixed capital and net capital transfers received less gross investment and net purchases of nonproduced assets.
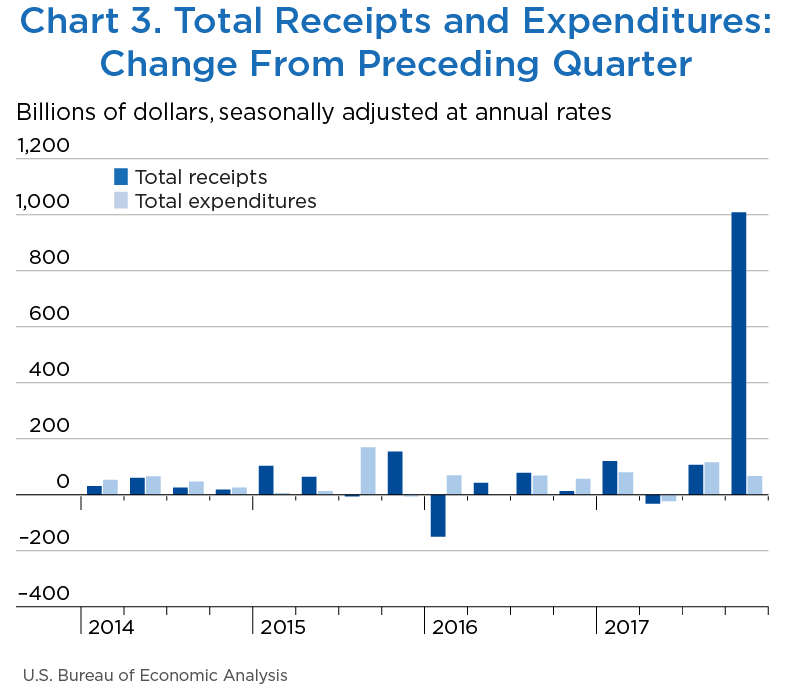
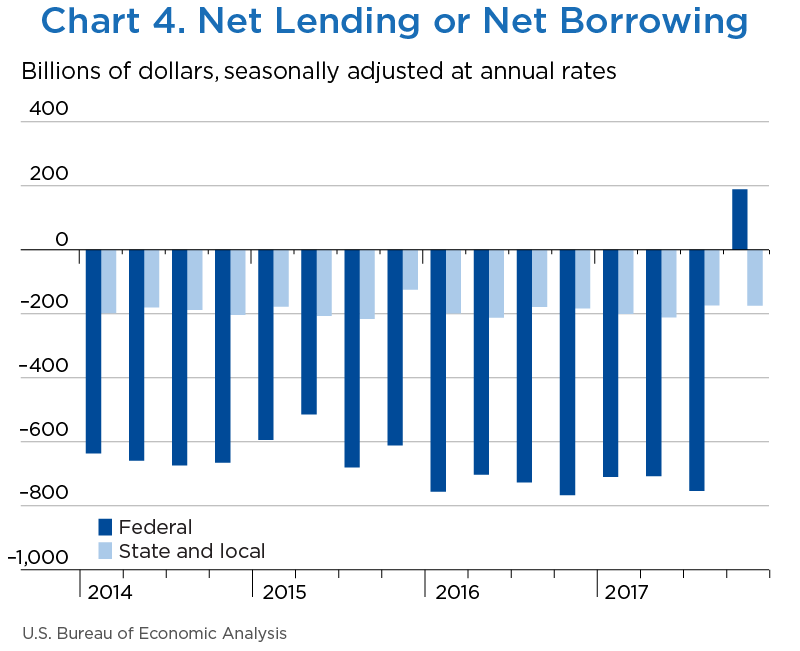
Net lending was $14.7 billion in the fourth quarter, increasing $942.5 billion from −$927.8 billion in the third quarter (charts 3 and 4 and table 1).
| Line | Level | Change from preceding quarter | ||||
|---|---|---|---|---|---|---|
| 2017 | 2017 | |||||
| IV | I | II | III | IV | ||
| 1 | Current receipts | 5,571.7 | 118.9 | −31.8 | 94.0 | 19.3 |
| 2 | Current expenditures | 6,475.8 | 75.7 | −17.5 | 38.9 | 131.5 |
| 3 | Net government saving | −904.1 | 43.3 | −14.5 | 55.3 | −112.3 |
| 4 | Federal | −748.5 | 61.2 | 10.9 | 24.9 | −131.5 |
| 5 | State and local | −155.6 | −17.9 | −25.4 | 30.4 | 19.2 |
| 6 | Net lending or net borrowing (−) | 14.7 | 39.7 | −8.7 | −8.9 | 942.5 |
| 7 | Federal | 189.1 | 56.5 | 2.6 | −46.3 | 942.8 |
| 8 | State and local | −174.4 | −16.7 | −11.4 | 37.4 | −0.3 |
Net federal government saving was −$748.5 billion in the fourth quarter, decreasing $131.5 billion from −$617.0 billion in the third quarter. In the fourth quarter, current receipts turned down, and current expenditures accelerated (table 2).
Federal government net lending was $189.1 billion in the fourth quarter, increasing $942.8 billion from −$753.7 billion in the third quarter. The large increase in federal net lending reflected provisions in the 2017 Tax Cut and Jobs Act. Under the law, a one-time deemed repatriation tax is imposed on foreign earnings accumulated after 1986 through the end of a company's most recent fiscal year. The tax is classified as a capital transfer from business to government, and it was recorded on an accrual basis in the fourth quarter of 2017. BEA's estimate of the one-time repatriation tax is $250 billion at a quarterly rate ($1 trillion at an annual rate). For more information, see “How does the 2017 Tax Cuts and Jobs Act affect BEA's business income statistics?”
- Personal current taxes ( line 3) decelerated in the fourth quarter, reflecting a deceleration in withheld income taxes.
- Taxes on corporate income (line 5) decreased more in the fourth quarter than in the third quarter, reflecting a downturn in corporate profits.
- Income receipts on assets (line 8) decreased more than in the third quarter, reflecting the pattern of dividend payments from Fannie Mae and Freddie Mac.
- Current transfer receipts (line 9) turned down. The third-quarter receipts included $5.5 billion ($22.0 billion at an annual rate) from bank settlements.
- Grants-in-aid to state and local governments (line 20) turned down, reflecting a downturn in Medicaid grants.
- Current transfer payments to the rest of the world (line 21) turned up in the fourth quarter. Third-quarter transfers were boosted by economic support payments to Egypt and Israel and by hurricane relief grants to Puerto Rico and the U.S. Virgin Islands.
- Interest payments (line 22) turned up in the fourth quarter, reflecting an upturn in inflation expense payments on Treasury Inflation-Protected Securities.
| Line | Level | Change from preceding quarter | |||||
|---|---|---|---|---|---|---|---|
| 2017 | 2017 | ||||||
| IV | I | II | III | IV | |||
| 1 | Current receipts | 3,585.6 | 109.8 | −32.8 | 62.0 | −32.8 | |
| 2 | Current tax receipts | 2,176.8 | 20.4 | 17.3 | 26.1 | 0.0 | |
| 3 | Personal current taxes | 1,639.7 | 22.0 | 12.5 | 27.3 | 25.9 | |
| 4 | Taxes on production and imports | 135.9 | −9.7 | 2.8 | 1.2 | 3.1 | |
| 5 | Taxes on corporate income | 378.0 | 8.0 | 1.6 | −2.6 | −29.8 | |
| 6 | Taxes from the rest of the world | 23.3 | −0.1 | 0.4 | 0.3 | 0.9 | |
| 7 | Contributions for government social insurance | 1,307.6 | 34.1 | 9.7 | 14.5 | 14.2 | |
| 8 | Income receipts on assets | 38.3 | 20.6 | −16.6 | −0.5 | −21.1 | |
| 9 | Current transfer receipts | 68.8 | 34.6 | −42.8 | 22.1 | −24.0 | |
| 10 | Current surplus of government enterprises | −5.8 | 0.1 | −0.4 | −0.2 | −1.8 | |
| 11 | Current expenditures | 4,334.1 | 48.7 | −43.7 | 37.2 | 98.6 | |
| 12 | Consumption expenditures | 991.5 | 2.1 | 2.8 | 10.3 | 10.4 | |
| 13 | National defense | 598.5 | −1.6 | 3.1 | 5.4 | 8.4 | |
| 14 | Nondefense | 392.9 | 3.6 | −0.2 | 4.9 | 1.9 | |
| 15 | Current transfer payments | 2,731.0 | 31.6 | −15.3 | 32.7 | 12.7 | |
| 16 | Government social benefits | 2,111.2 | 31.9 | 7.7 | 10.8 | 10.0 | |
| 17 | To persons | 2,088.6 | 31.4 | 7.6 | 10.5 | 9.3 | |
| 18 | To the rest of the world | 22.6 | 0.5 | 0.2 | 0.2 | 0.7 | |
| 19 | Other current transfer payments | 619.8 | −0.3 | −23.0 | 21.9 | 2.7 | |
| 20 | Grants-in-aid to state and local governments | 561.5 | −2.1 | −20.1 | 24.5 | −7.1 | |
| 21 | To the rest of the world | 58.3 | 1.8 | −3.0 | −2.5 | 9.8 | |
| 22 | Interest payments | 549.5 | 15.7 | −30.4 | −7.0 | 74.2 | |
| 23 | Subsidies | 62.1 | −0.6 | −0.9 | 1.2 | 1.3 | |
| 24 | Net federal government saving | −748.5 | 61.2 | 10.9 | 24.9 | −131.5 | |
| 25 | Social insurance funds | −308.5 | 18.3 | −1.0 | 1.3 | 3.0 | |
| 26 | Other | −440.0 | 42.9 | 11.9 | 23.6 | −134.5 | |
| Addenda: | |||||||
| 27 | Total receipts | 4,608.6 | 110.7 | −32.5 | 62.2 | 968.4 | |
| 28 | Current receipts | 3,585.6 | 109.8 | −32.8 | 62.0 | −32.8 | |
| 29 | Capital transfer receipts | 1,022.9 | 0.9 | 0.3 | 0.2 | 1,001.1 | |
| 30 | Total expenditures | 4,419.5 | 54.3 | −35.1 | 108.5 | 25.6 | |
| 31 | Current expenditures | 4,334.1 | 48.7 | −43.7 | 37.2 | 98.6 | |
| 32 | Gross government investment | 287.4 | 6.9 | 8.6 | −2.5 | 4.9 | |
| 33 | Capital transfer payments | 73.5 | 0.2 | 0.8 | 74.0 | −76.7 | |
| 34 | Net purchases of nonproduced assets | −0.7 | −0.2 | −0.2 | 0.3 | −0.4 | |
| 35 | Less: Consumption of fixed capital | 274.9 | 1.2 | 0.8 | 0.3 | 1.0 | |
| 36 | Net lending or net borrowing (−) | 189.1 | 56.5 | 2.6 | −46.3 | 942.8 | |
Net state and local government saving was −$155.6 billion in the fourth quarter, increasing $19.2 billion from −$174.8 billion in the third quarter. In the fourth quarter, both current receipts and current expenditures decelerated (table 3).
State and local government net borrowing was $174.4 billion, increasing $0.3 billion from $174.1 billion in the third quarter.
- Personal current taxes (line 3) accelerated in the fourth quarter because of an acceleration in personal income taxes
- Taxes on production and imports (line 4) accelerated in the fourth quarter, reflecting an acceleration in both sales taxes and property taxes and an upturn in severance taxes (severance taxes are taxes imposed upon the removal of natural resources such as oil and natural gas).
- Federal grants-in-aid (line 9) turned down in the fourth quarter, reflecting a downturn in Medicaid grants.
- Consumption expenditures (line 13) in the fourth quarter, reflecting an acceleration in intermediate goods and services purchased, particularly an acceleration in nondurable goods.
- Government social benefits (line 14) decelerated in the fourth quarter. The third-quarter estimate was boosted by disaster assistance payments due to Hurricanes Harvey and Irma.
- Gross government investment (line 25) accelerated in the fourth quarter because of an acceleration in structures investment
| Line | Level | Change from preceding quarter | ||||
|---|---|---|---|---|---|---|
| 2017 | 2017 | |||||
| IV | I | II | III | IV | ||
| 1 | Current receipts | 2,547.6 | 7.0 | −19.1 | 56.5 | 45.0 |
| 2 | Current tax receipts | 1,747.8 | 24.0 | −1.8 | 29.4 | 48.9 |
| 3 | Personal current taxes | 468.5 | 19.6 | −23.4 | 23.0 | 24.1 |
| 4 | Taxes on production and imports | 1,222.5 | 14.8 | 9.3 | 8.9 | 23.9 |
| 5 | Taxes on corporate income | 56.7 | −10.4 | 12.3 | −2.5 | 0.8 |
| 6 | Contributions for government social insurance | 20.8 | 0.0 | 0.0 | 0.2 | 0.2 |
| 7 | Income receipts on assets | 80.1 | −0.1 | 0.4 | 0.5 | 0.5 |
| 8 | Current transfer receipts | 704.8 | −15.8 | −18.6 | 26.1 | −5.3 |
| 9 | Federal grants-in-aid | 561.5 | −2.1 | −20.1 | 24.5 | −7.1 |
| 10 | Other | 143.3 | −13.8 | 1.6 | 1.6 | 1.8 |
| 11 | Current surplus of government enterprises | −5.9 | −1.0 | 0.8 | 0.3 | 0.7 |
| 12 | Current expenditures | 2,703.2 | 25.0 | 6.2 | 26.1 | 25.8 |
| 13 | Consumption expenditures | 1,780.8 | 21.2 | 10.3 | 16.1 | 21.0 |
| 14 | Government social benefits | 724.0 | 4.1 | −3.2 | 10.2 | 4.8 |
| 15 | Interest payments | 197.9 | −0.3 | −1.0 | −0.2 | 0.1 |
| 16 | Subsidies | 0.6 | 0.0 | 0.0 | 0.1 | 0.0 |
| 17 | Net state and local government saving | −155.6 | −17.9 | −25.4 | 30.4 | 19.2 |
| 18 | Social insurance funds | 5.6 | −0.1 | 0.0 | 0.1 | 0.2 |
| 19 | Other | −161.2 | −17.9 | −25.3 | 30.3 | 19.0 |
| Addenda: | ||||||
| 20 | Total receipts | 2,618.8 | 8.1 | −17.5 | 66.3 | 32.6 |
| 21 | Current receipts | 2,547.6 | 7.0 | −19.1 | 56.5 | 45.0 |
| 22 | Capital transfer receipts | 71.2 | 1.1 | 1.6 | 9.8 | −12.4 |
| 23 | Total expenditures | 2,793.2 | 24.8 | −6.1 | 28.9 | 32.9 |
| 24 | Current expenditures | 2,703.2 | 25.0 | 6.2 | 26.1 | 25.8 |
| 25 | Gross government investment | 346.9 | 3.3 | −10.0 | 0.6 | 13.8 |
| 26 | Capital transfer payments | ................. | ................. | ................. | ................. | ................. |
| 27 | Net purchases of nonproduced assets | 11.1 | 0.1 | 0.1 | 0.1 | 0.2 |
| 28 | Less: Consumption of fixed capital | 268.0 | 3.6 | 2.4 | 2.9 | 1.9 |
| 29 | Net lending or net borrowing (−) | −174.4 | −16.7 | −11.4 | 37.4 | −0.3 |


