
The 2019 Annual Update of the National Income and Product Accounts
The Bureau of Economic Analysis (BEA) released its annual update of the National Income and Product Accounts (NIPAs) for 2014–2018 and for the first quarter of 2019, along with the advance estimates for the second quarter of 2019, on July 26.1 As is usual for NIPA annual updates, the revised estimates reflect newly available source data that are more complete, more detailed, and otherwise more reliable than those that were previously incorporated. The reference year for price and quantity estimates remains 2012.
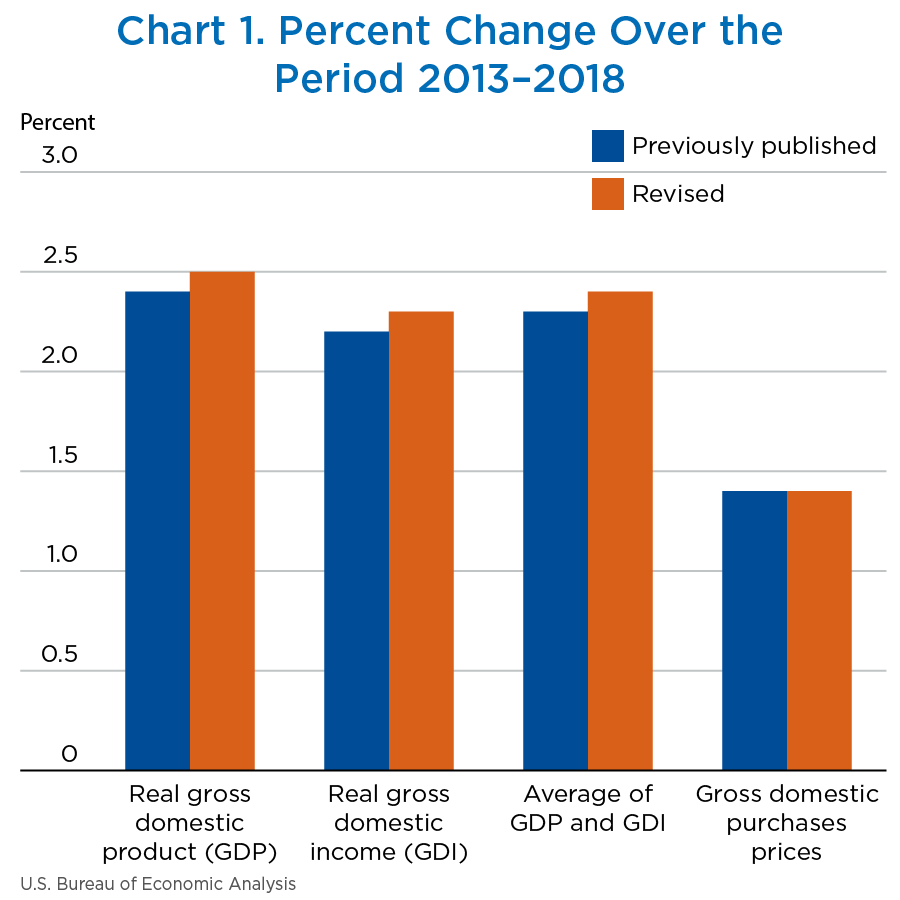
With this update, economic growth from 2013 to 2018 is revised up slightly, but the revised estimates are similar to the previously published estimates (chart 1). Specifically, this year's update includes the following highlights:
[Click chart to expand]
- Real gross domestic product (GDP)—an inflation-adjusted measure of the value of the goods and services produced by the nation's economy less the value of the goods and services used up in production—increased at an average annual rate of 2.5 percent; in the previously published estimates, real GDP increased 2.4 percent.
- Real gross domestic income (GDI)—which measures the value of the production of goods and services in the United States as the incomes earned and the costs incurred in production—increased at an average annual rate of 2.3 percent; in the previously published estimates, real GDI increased at an average annual rate of 2.2 percent.
- The average of real GDP and real GDI increased at an average annual rate of 2.4 percent; in the previously published estimates, the measure increased at an average annual rate of 2.3 percent.
- The price index for gross domestic purchases increased at an average annual rate of 1.4 percent, unrevised from the previously published estimates.
- Contributors to real GDP growth for 2014–2018 are little changed from the earlier estimates. Consumer spending remains the driving force behind the growth in GDP, and the revised estimates continue to show a declining influence of business investment from 2014 to 2016—offsetting growth in 2016—before increasing in 2017 and 2018. Revised estimates show a slightly different pattern for the contribution of state and local spending: it contributes slightly in all years; previously published estimates indicated that it slightly offset the contributions of other components in 2017.
- For the period of expansion from the second quarter of 2009 through the first quarter of 2019, real GDP increased at an average annual rate of 2.3 percent, unrevised from the previously published estimate. The rate of growth in real GDI over this period was also unrevised at 2.4 percent.
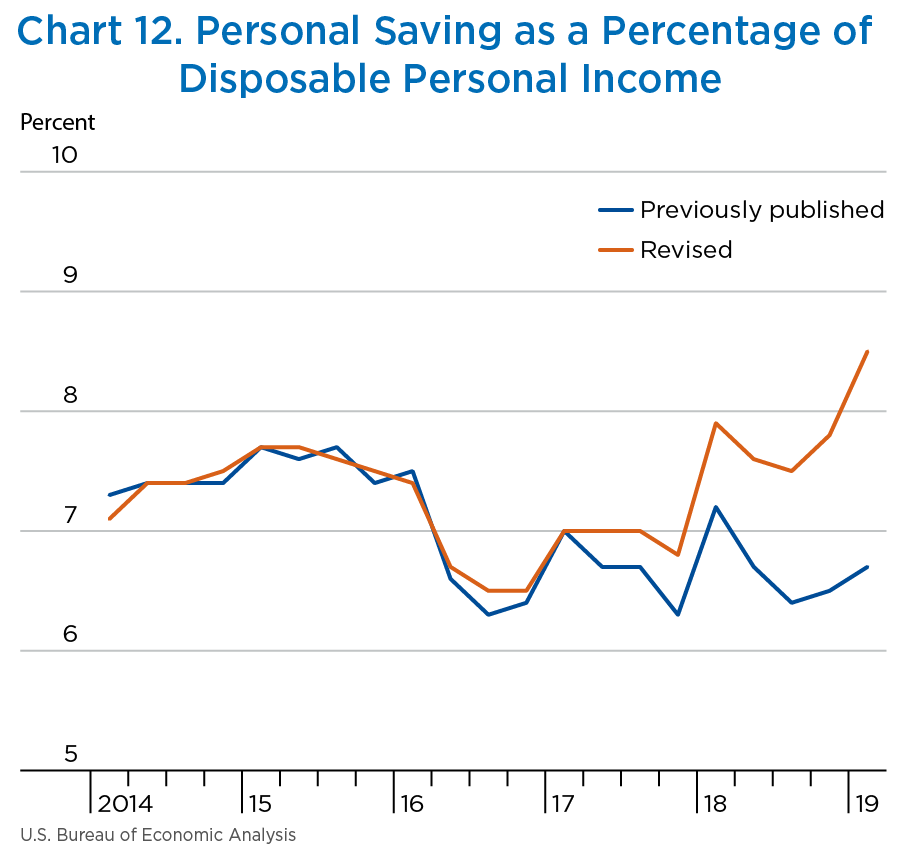
- The personal saving rate (personal saving as a percentage of disposable personal income) was unrevised for 2014 and 2015. It was revised up 0.1 percentage point to 6.8 percent for 2016, revised up 0.3 percentage point to 7.0 percent for 2017, and revised up 1.0 percentage point to 7.7 percent for 2018.
The updated NIPA estimates reflect the incorporation of newly available and revised source data, the adoption of improved estimating methods, and for quarterly and monthly measures, the incorporation of updated seasonal factors.
Major source data
The major source data incorporated as part of this year's update are summarized in table 1, and additional information on the NIPA components affected by the incorporation of newly available and revised source data is provided in table 13.2
Some of the source data that are typically incorporated as part of the annual update of the NIPAs were not available for incorporation this year. Specifically, the Census Bureau Annual Survey of Manufactures (ASM) for 2017 was not available, because the survey is not conducted in years during which the quinquennial Economic Census is conducted; results from the Economic Census for 2017 will be released beginning in the fall of 2019. Typically, data from the ASM would replace data from the Census Bureau monthly survey of Manufacturers' Shipments, Inventories, and Orders (M3). Additionally, the Census Bureau's annual revision of its Value of Construction Put in Place series was not available in time for incorporation into the NIPAs due to the recent partial shutdown of certain federal government agencies.3 Typically, revised data would be incorporated into estimates of investment for nonresidential and residential structures.
Source data that affected the NIPA components include the following:
- New Census Bureau Service Annual Survey (SAS) data for 2018 and revised data for 2016 and 2017, which replace Census Bureau Quarterly Services Report data for 2018 and previous SAS data for 2016 and 2017. SAS data most notably impact estimates of consumer spending for services and private investment in intellectual property products.
- New Census Bureau Annual Retail Trade Survey (ARTS) data for 2017, which replace Census Bureau monthly retail trade survey data, and revised ARTS data for 2016 impact estimates of consumer spending for goods and private inventory investment.
- New Bureau of Labor Statistics (BLS) Quarterly Census of Employment and Wages (QCEW) data for 2018, which replace quarterly extrapolations, and revised QCEW data for 2016–2017 affect estimates of private and government compensation.
- Revised Internal Revenue Service (IRS) tabulations of corporate tax returns for 2016 and new IRS tabulations of corporate and of sole proprietorship and partnership tax return data for 2017 affect estimates of corporate profits, proprietors' income, and net interest.
- New data from the Federal Reserve Board's Financial Accounts of the United States for 2018 and revised data for 2014–2017 impact estimates of interest and dividend payments and receipts and estimates of consumer spending on financial services.
| Agency | Data | Years covered and vintage |
|---|---|---|
| Census Bureau | Annual Capital Expenditures Survey | 2016 (revised), 2017 (new) |
| Annual Wholesale Trade Survey | 2014–2016 (revised), 2017 (new) | |
| Annual Retail Trade Survey | 2014–2016 (revised), 2017 (new) | |
| Monthly indicators of manufactures, merchant wholesale trade, and retail trade | 2014–2018 (revised) | |
| Service Annual Survey | 2016 and 2017 (revised), 2018 (new) | |
| Annual Survey of State and Local Government Finances | Fiscal year (FY) 2014–2016 (revised), FY 2017 (new) | |
| Quarterly Services Report | 2014–2018 (revised) | |
| Current Population Survey/Housing Vacancy Survey | 2014–2017 (revised), 2018 (new) | |
| Office of Management and Budget | Federal budget | Fiscal years 2016–2019 |
| Internal Revenue Service | Tabulations of tax returns for corporations | 2016 (revised), 2017 (new) |
| Tabulations of tax returns for sole proprietorships and partnerships | 2016 (revised), 2017 (new) | |
| Bureau of Labor Statistics | Quarterly Census of Employment and Wages | 2014–2018 (revised) |
| Occupational Employment Statistics program survey | 2018 (new) | |
| Department of Agriculture | Farm statistics | 2014–2018 (revised) |
| Bureau of Economic Analysis | International transactions accounts | 2014–2018 (revised) |
Methodology improvements
This year's update also reflects a number of changes to the estimating methods that underlie BEA's measures. For consumer spending, several new current-dollar indicators were introduced, and the estimates of consumer spending, business investment, and trade are improved with the introduction of better-quality or more appropriate price indexes.
Consumer spending for air transportation
Beginning with 2014, quarterly measures of personal spending for air transportation are improved by introducing Census Bureau data on quarterly revenues as an indicator. These data are benchmarked to, and thus better aligned with, the annual Census revenue data that underlie BEA's annual estimates of spending on air transportation. Moreover, the Census data are now available in time for incorporation into the second release of quarterly GDP. Quarterly Department of Transportation (DOT) data on scheduled air passenger revenues are used to allocate the estimates between domestic and international shares of revenue from air transportation, when they are available; when they are not available, the allocation will be based on the share from the same quarter of the previous year. Prior to this annual update, quarterly measures for this series were extrapolated using only the DOT data.
Consumer spending for video rental and streaming
Beginning with 2014, annual, quarterly, and monthly measures of consumer spending on video streaming and rental services and on cable, satellite, and other live television services are improved by augmenting the underlying Census Bureau revenue data with revenue data from HarrisX that better capture the rapid growth of streaming services. For video streaming and rental services, the annual measures reflect HarrisX data for on-demand video providers. For quarterly and monthly measures, the HarrisX data replace a BEA indicator that was based on the BLS Consumer Price Index (CPI) for rental of video discs and other media and population data. For annual and quarterly estimates of cable, satellite, and live television services, HarrisX data are used to measure the live television streaming component of this category. Previously, this measure was based solely on annual and quarterly Census Bureau revenue data for more traditional cable and satellite television services.
Consumer spending for tobacco
Beginning with 2015, estimates of consumer spending for tobacco and other smoking products are improved by introducing an indicator based on Nielsen point-of-sale data that captures the rapidly increasing use of vaping products and better measures the consumption of tobacco. Previously, tobacco consumption was extrapolated using tobacco shipments data from the Treasury Department Alcohol and Tobacco Tax and Trade Bureau that do not include vaping products. In addition, these data do not necessarily align well with consumption, as shipments are highly volatile and influenced by requirements regarding the payment of excise taxes.
Improved prices
Improved prices for high-tech goods that display rapid rates of innovation and quality improvement were introduced this year (see “BEA's Digital Economy Project”).
Cellular telephones. Real, or inflation-adjusted, measures of consumer spending on telephone and related communication equipment, imports of other household goods, and private fixed investment in communication equipment excluding broadcast—all of which include cellular telephone equipment—are improved through the use of newly available quality-adjusted price indexes that more accurately reflect the rapid change in the quality of cellular telephones.
For 2014–2017, these measures are now deflated using a new quality-adjusted price index that was developed by BEA, the Federal Reserve Board, and private academia based on data from the International Data Corporation. Previously, the measures were deflated using a price index that was prepared by the Federal Reserve Board.4 For 2018 forward, the measures are deflated using a quality-adjusted smartphone price index that is reflected in the BLS CPI for telephone hardware, calculators, and other consumer items.
Cellular telephone services. A related improvement is incorporated into real measures of consumer spending on cellular telephone services. Recent research conducted by BEA, the Federal Reserve Board, and private academia found that a substantial portion of the receipts that are recorded as cellular telephone services are actually receipts for the equipment that is bundled with those services; for 2014 to 2017, equipment comprises about one-fourth of the receipts.5 Beginning with 2014, the aggregate price index used to deflate consumer spending on cellular telephone services now incorporates the index described above for the cellular telephone equipment and the CPI for wireless telephone services for the cellular telephone services.
Telecommunications, computer, and information services. Measures of exports and imports of telecommunications, computer, and information services are improved through the introduction of a new composite price index of BLS Producer Price Indexes (PPIs) that reflect the relative share of each component of the measure. The new composite price index is comprised of PPIs for telecommunication, cable, and internet user services; data processing and related services; and software publishing. Previously, the measure was deflated using the PPI for business switched toll and “other” toll services.
Electromedical equipment. BEA introduced quality-adjusted indexes for the medical diagnostic and medical radiation components of investment and trade in electromedical equipment as part of the 2018 comprehensive update of the accounts. This year, these estimates are further improved by adding quality-adjusted prices for two additional components: (1) medical therapy and patient monitoring equipment and (2) surgical systems. As a result, the measures better account for the rapid innovation and quality change in these goods. These matched-model price indexes are based on ECRI Institute data on purchases of medical equipment by health care providers.
Maintenance and repair services. BEA also improved measures of exports and imports of maintenance and repair services n.i.e., beginning with 2014, by introducing the BLS PPI for commercial and industrial machinery and equipment repair and maintenance, which better reflects the equipment repair services included in this measure. Previously, the measure was deflated with the BLS PPI for inputs to maintenance and repair construction goods.
Updated seasonal factors. As with every annual update of the NIPAs, this year's update includes the incorporation of updated quarterly and monthly seasonal factors that capture changes in seasonal patterns that emerge over time. Following the comprehensive update of the NIPAs in 2018, the revision period was expanded to include the previous 5 years (beginning with 2014) in order to better capture the impact of the most recent time period on the trends in seasonality. The updated seasonal factors reflect a mix of data that are seasonally adjusted by source agencies as well as data directly adjusted by BEA.
- From 2013 to 2018, real GDP increased at an average annual rate of 2.5 percent, an upward revision of 0.1 percentage point from the prior estimate. Measures of current-dollar GDP were revised up for each year; it increased at an average annual rate of 4.2 percent (revised up from 4.1 percent).
- For 2014, 2015, 2016, and 2018, revisions to the components of GDP were offsetting with no resulting revision to the percent change in real GDP (table 2). For 2017, the percent change in real GDP was revised up 0.2 percentage point, due mostly to upward revisions to state and local government spending, exports, personal consumption expenditures (PCE), and inventory investment. These revisions were partly offset by a downward revision to nonresidential investment and an upward revision to imports.
- The revisions to real GDP and its components primarily reflect revisions to current-dollar measures; price measures were not significantly revised (although the incorporation of enhanced price measures did improve the measures for which they were introduced).
- The revisions did not reverse the direction of change in real GDP for any quarter of the revision period (chart 2). The largest upward revision was 1.2 percentage points for the fourth quarter of 2017, and the largest downward revision was 1.1 percentage points for the fourth quarter of 2018.
- The quarterly pattern for real GDP changed for 7 of the 21 quarters in the revision period. The revised estimates indicate that GDP growth decelerated in the second quarter of 2015; in the previously published estimates, the growth rate was unchanged from the previous quarter. GDP growth decelerated in the second quarter of 2016 and accelerated in the third quarter—a reverse in the pattern of the previously published estimates. The revised estimates changed the quarterly pattern for all of 2017; specifically, GDP accelerated in the first quarter of 2017, decelerated in the second quarter, accelerated in the third quarter, and accelerated in the fourth quarter. In the previously published estimates, GDP growth was the same in the first quarter of 2017, accelerated in the second quarter, decelerated in the third quarter, and decelerated in the fourth quarter.
| Share of current-dollar GDP (percent) | Change from preceding period (percent) | Contribution to percent change in real GDP (percentage points) | |||||||||
|---|---|---|---|---|---|---|---|---|---|---|---|
| 2018 | 2014 | 2015 | 2016 | 2017 | 2018 | 2014 | 2015 | 2016 | 2017 | 2018 | |
| Gross domestic product1 | 100.0 | 2.5 | 2.9 | 1.6 | 2.4 | 2.9 | 2.5 | 2.9 | 1.6 | 2.4 | 2.9 |
| Personal consumption expenditures | 68.0 | 3.0 | 3.7 | 2.7 | 2.6 | 3.0 | 2.0 | 2.5 | 1.9 | 1.8 | 2.1 |
| Goods | 21.2 | 4.1 | 4.7 | 3.6 | 3.9 | 4.1 | 0.9 | 1.0 | 0.8 | 0.8 | 0.9 |
| Durable goods | 7.2 | 7.2 | 7.5 | 6.1 | 6.9 | 6.3 | 0.5 | 0.5 | 0.4 | 0.5 | 0.4 |
| Nondurable goods | 14.0 | 2.6 | 3.4 | 2.4 | 2.5 | 3.0 | 0.4 | 0.5 | 0.3 | 0.4 | 0.4 |
| Services | 46.8 | 2.4 | 3.2 | 2.3 | 2.0 | 2.5 | 1.1 | 1.5 | 1.1 | 0.9 | 1.2 |
| Gross private domestic investment | 17.6 | 5.6 | 4.9 | −1.3 | 4.4 | 5.1 | 1.0 | 0.9 | −0.2 | 0.8 | 0.9 |
| Fixed investment | 17.4 | 6.6 | 3.4 | 1.9 | 4.2 | 4.6 | 1.1 | 0.6 | 0.3 | 0.7 | 0.8 |
| Nonresidential | 13.5 | 7.2 | 1.8 | 0.7 | 4.4 | 6.4 | 1.0 | 0.3 | 0.1 | 0.6 | 0.8 |
| Structures | 3.1 | 11.0 | −3.0 | −5.0 | 4.7 | 4.1 | 0.3 | −0.1 | −0.2 | 0.1 | 0.1 |
| Equipment | 5.9 | 7.0 | 3.2 | −1.3 | 4.7 | 6.8 | 0.4 | 0.2 | −0.1 | 0.3 | 0.4 |
| Intellectual property products | 4.5 | 4.8 | 3.6 | 7.9 | 3.7 | 7.4 | 0.2 | 0.2 | 0.3 | 0.2 | 0.3 |
| Residential | 3.8 | 3.8 | 10.2 | 6.5 | 3.5 | −1.5 | 0.1 | 0.3 | 0.2 | 0.1 | −0.1 |
| Change in private inventories | 0.3 | ...... | ...... | ...... | ...... | ...... | −0.1 | 0.3 | −0.6 | 0.0 | 0.1 |
| Net exports of goods and services | −3.1 | ...... | ...... | ...... | ...... | ...... | −0.3 | −0.8 | −0.3 | −0.3 | −0.3 |
| Exports | 12.2 | 4.2 | 0.5 | 0.0 | 3.5 | 3.0 | 0.6 | 0.1 | 0.0 | 0.4 | 0.4 |
| Goods | 8.1 | 4.6 | −0.4 | 0.6 | 3.9 | 4.3 | 0.4 | 0.0 | 0.0 | 0.3 | 0.3 |
| Services | 4.1 | 3.3 | 2.2 | −1.1 | 2.7 | 0.7 | 0.1 | 0.1 | −0.1 | 0.1 | 0.0 |
| Imports | 15.3 | 5.0 | 5.3 | 2.0 | 4.7 | 4.4 | −0.8 | −0.8 | −0.3 | −0.7 | −0.7 |
| Goods | 12.5 | 5.6 | 5.7 | 1.5 | 4.8 | 5.0 | −0.8 | −0.7 | −0.2 | −0.6 | −0.6 |
| Services | 2.8 | 2.3 | 3.5 | 4.4 | 4.4 | 1.6 | −0.1 | −0.1 | −0.1 | −0.1 | −0.1 |
| Government consumption expenditures and gross investment | 17.5 | −0.9 | 1.9 | 1.8 | 0.7 | 1.7 | −0.2 | 0.4 | 0.3 | 0.1 | 0.3 |
| Federal | 6.5 | −2.6 | −0.1 | 0.4 | 0.8 | 2.9 | −0.2 | 0.0 | 0.0 | 0.1 | 0.2 |
| National defense | 3.9 | −4.1 | −2.1 | −0.6 | 0.7 | 3.3 | −0.2 | −0.1 | 0.0 | 0.0 | 0.1 |
| Nondefense | 2.7 | −0.1 | 3.1 | 2.0 | 0.8 | 2.4 | 0.0 | 0.1 | 0.1 | 0.0 | 0.1 |
| State and local | 10.9 | 0.2 | 3.2 | 2.6 | 0.6 | 1.0 | 0.0 | 0.4 | 0.3 | 0.1 | 0.1 |
| Revisions (percentage points) | |||||||||||
| Gross domestic product | ...... | 0.0 | 0.0 | 0.0 | 0.2 | 0.0 | 0.0 | 0.0 | 0.0 | 0.2 | 0.0 |
| Personal consumption expenditures | ...... | 0.1 | 0.0 | 0.0 | 0.1 | 0.4 | 0.0 | 0.0 | 0.0 | 0.1 | 0.3 |
| Gross private domestic investment | ...... | 0.2 | 0.1 | 0.0 | −0.4 | −0.8 | 0.0 | 0.0 | 0.0 | −0.1 | −0.2 |
| Fixed investment | ...... | 0.3 | 0.0 | 0.2 | −0.6 | −0.6 | 0.1 | 0.0 | 0.0 | −0.1 | −0.1 |
| Nonresidential | ...... | 0.3 | 0.0 | 0.2 | −0.9 | −0.5 | 0.0 | 0.0 | 0.0 | −0.1 | −0.1 |
| Residential | ...... | −0.1 | 0.1 | 0.0 | 0.2 | −1.2 | 0.0 | 0.0 | 0.0 | 0.0 | −0.1 |
| Change in private inventories | ...... | ...... | ...... | ...... | ...... | ...... | ...... | ...... | ...... | ...... | ...... |
| Net exports of goods and services | ...... | ...... | ...... | ...... | ...... | ...... | ...... | ...... | ...... | ...... | ...... |
| Exports | ...... | −0.1 | −0.1 | 0.1 | 0.5 | −1.0 | 0.0 | 0.0 | 0.0 | 0.1 | −0.1 |
| Imports | ...... | −0.1 | −0.2 | 0.1 | 0.1 | −0.1 | 0.0 | 0.0 | 0.0 | 0.0 | 0.0 |
| Government consumption expenditures and gross investment | ...... | 0.0 | 0.0 | 0.4 | 0.8 | 0.2 | 0.0 | 0.0 | 0.1 | 0.1 | 0.0 |
| Federal | ...... | 0.0 | −0.1 | 0.0 | 0.1 | 0.3 | 0.0 | 0.0 | 0.0 | 0.0 | 0.0 |
| State and local | ...... | 0.1 | 0.2 | 0.6 | 1.1 | 0.2 | 0.0 | 0.0 | 0.1 | 0.1 | 0.0 |
- The estimates under the contribution columns are also percent changes.

[Click chart to expand]
The change in real PCE was revised up for 2014 (from 2.9 percent to 3.0 percent), was unrevised for 2015 and for 2016, was revised up for 2017 (from 2.5 percent to 2.6 percent) and was revised up for 2018 (from 2.6 percent to 3.0 percent).
- For 2014, both goods and services contributed to the upward revision (table 3). For 2015 and 2016, revisions to the detailed components within goods and within services were offsetting, resulting in no revision to goods, to services, or to total PCE.
- For 2017, the primary contributors to the revision were within goods, particularly food and beverages purchased for off-premises consumption, and other nondurable goods.
- For 2018, both services and goods contributed to the upward revision. Within services, most categories were revised up, most notably food services and accommodations; within goods, the most notable revision was to motor vehicles and parts.
The quarterly pattern of real PCE over the period of the revision was changed in 4 of the 21 quarters in the revision period. Revised estimates indicate that PCE grew at the same rate, rather than accelerating, in the third quarter of 2014. It decelerated, rather than accelerated, in the second quarter of 2016. In the second and third quarters of 2017, PCE growth stayed the same as in the first quarter; in the previously published estimates, PCE growth accelerated in the second quarter and decelerated in the third quarter (chart 3). The largest upward revision was to the first quarter of 2018, and the largest downward revision was to the fourth quarter of 2018.
| Share of current-dollar PCE (percent) | Change from preceding period (percent) | Contribution to percent change in real PCE (percentage points) | |||||||||
|---|---|---|---|---|---|---|---|---|---|---|---|
| 2018 | 2014 | 2015 | 2016 | 2017 | 2018 | 2014 | 2015 | 2016 | 2017 | 2018 | |
| Personal consumption expenditures1 | 100.0 | 3.0 | 3.7 | 2.7 | 2.6 | 3.0 | 3.0 | 3.7 | 2.7 | 2.6 | 3.0 |
| Goods | 31.2 | 4.1 | 4.7 | 3.6 | 3.9 | 4.1 | 1.3 | 1.5 | 1.1 | 1.2 | 1.3 |
| Durable goods | 10.5 | 7.2 | 7.5 | 6.1 | 6.9 | 6.3 | 0.7 | 0.8 | 0.6 | 0.7 | 0.7 |
| Motor vehicles and parts | 3.7 | 5.8 | 7.3 | 3.1 | 5.1 | 4.3 | 0.2 | 0.3 | 0.1 | 0.2 | 0.2 |
| Furnishings and durable household equipment | 2.4 | 8.5 | 9.1 | 7.9 | 8.1 | 6.2 | 0.2 | 0.2 | 0.2 | 0.2 | 0.2 |
| Recreational goods and vehicles | 2.8 | 7.4 | 6.1 | 11.6 | 10.5 | 8.3 | 0.2 | 0.2 | 0.3 | 0.3 | 0.2 |
| Other durable goods | 1.6 | 8.2 | 7.8 | 1.7 | 3.1 | 7.5 | 0.1 | 0.1 | 0.0 | 0.1 | 0.1 |
| Nondurable goods | 20.6 | 2.6 | 3.4 | 2.4 | 2.5 | 3.0 | 0.6 | 0.7 | 0.5 | 0.5 | 0.6 |
| Food and beverages for off-premises consumption | 7.2 | 1.9 | 1.4 | 3.0 | 3.3 | 3.2 | 0.1 | 0.1 | 0.2 | 0.2 | 0.2 |
| Clothing and footwear | 2.8 | 2.6 | 3.5 | 1.9 | 1.1 | 3.9 | 0.1 | 0.1 | 0.1 | 0.0 | 0.1 |
| Gasoline and other energy goods | 2.5 | 0.1 | 4.7 | 0.5 | −0.9 | −0.2 | 0.0 | 0.1 | 0.0 | 0.0 | 0.0 |
| Other nondurable goods | 8.2 | 4.6 | 4.7 | 2.6 | 3.1 | 3.4 | 0.4 | 0.4 | 0.2 | 0.3 | 0.3 |
| Services | 68.8 | 2.4 | 3.2 | 2.3 | 2.0 | 2.5 | 1.6 | 2.2 | 1.6 | 1.4 | 1.7 |
| Household consumption expenditures | 65.7 | 2.5 | 3.5 | 2.3 | 2.1 | 2.4 | 1.6 | 2.2 | 1.5 | 1.4 | 1.6 |
| Housing and utilities | 18.3 | 1.7 | 2.3 | 1.5 | 0.8 | 1.4 | 0.3 | 0.4 | 0.3 | 0.1 | 0.3 |
| Health care | 16.8 | 3.3 | 5.4 | 3.8 | 2.4 | 2.9 | 0.5 | 0.9 | 0.6 | 0.4 | 0.5 |
| Transportation services | 3.3 | 5.0 | 3.8 | 4.2 | 3.6 | 3.0 | 0.2 | 0.1 | 0.1 | 0.1 | 0.1 |
| Recreation services | 4.0 | 2.5 | 3.8 | 3.1 | 1.1 | 2.2 | 0.1 | 0.2 | 0.1 | 0.0 | 0.1 |
| Food services and accommodations | 7.0 | 3.4 | 4.3 | 2.1 | 2.6 | 4.1 | 0.2 | 0.3 | 0.1 | 0.2 | 0.3 |
| Financial services and insurance | 7.9 | 0.3 | 2.2 | −2.2 | 1.9 | 1.0 | 0.0 | 0.2 | −0.2 | 0.1 | 0.1 |
| Other services | 8.3 | 3.5 | 2.3 | 4.2 | 4.3 | 3.4 | 0.3 | 0.2 | 0.3 | 0.4 | 0.3 |
| Final consumption expenditures of NPISHs | 3.2 | −0.1 | −2.1 | 3.6 | 0.3 | 4.9 | 0.0 | −0.1 | 0.1 | 0.0 | 0.2 |
| Gross output of NPISHs | 11.4 | 1.7 | 2.5 | 3.6 | 1.5 | 2.6 | 0.2 | 0.3 | 0.4 | 0.2 | 0.3 |
| Less: Receipts from sales of goods and services by NPISHs | 8.3 | 2.4 | 4.3 | 3.6 | 1.9 | 1.8 | 0.2 | 0.4 | 0.3 | 0.2 | 0.2 |
| Revisions (percentage points) | |||||||||||
| Personal consumption expenditures | ...... | 0.1 | 0.0 | 0.0 | 0.1 | 0.4 | 0.1 | 0.0 | 0.0 | 0.1 | 0.4 |
| Goods | ...... | 0.1 | 0.0 | 0.0 | 0.2 | 0.4 | 0.0 | 0.0 | 0.0 | 0.1 | 0.1 |
| Durable goods | ...... | 0.0 | −0.1 | 0.6 | 0.1 | 0.8 | 0.0 | 0.0 | 0.1 | 0.0 | 0.1 |
| Nondurable goods | ...... | 0.0 | 0.0 | −0.3 | 0.4 | 0.2 | 0.0 | 0.0 | −0.1 | 0.1 | 0.1 |
| Services | ...... | 0.0 | 0.0 | 0.0 | 0.0 | 0.4 | 0.0 | 0.0 | 0.0 | 0.0 | 0.3 |
- NPISHs
- Nonprofit institutions serving households
- The estimates under the contribution columns are also percent changes.

[Click chart to expand]
Source data and major improvements
The updated estimates of PCE primarily reflect the incorporation of newly available and revised source data, including newly available and revised Census Bureau ARTS data and SAS data. Additionally, the use of new source data—such as Census Quarterly Services Report data on air transportation and private source data for consumer spending on tobacco and on video streaming—as well as improved prices for information and communication technology, including cellular telephones and cellular telephone services—result in improved measures of spending (see “Methodology improvements”).
The change in real private fixed investment was revised up 0.3 percentage point for 2014, was unrevised for 2015, was revised up 0.2 percentage point for 2016, and was revised down 0.6 percentage point for both 2017 and 2018 (table 4).
- For 2014, the revision was caused by upward revisions to the components of nonresidential investment. For 2015, an upward revision to nonresidential equipment was offset by downward revisions to intellectual property products and nonresidential structures.
- For 2016, the upward revision primarily reflected upward revisions to intellectual property products and equipment.
- For 2017, the primary contributors to the revision were downward revisions to nonresidential equipment (particularly information processing and related equipment) and to intellectual property products (particularly software).
- For 2018, the primary contributors to the revision were downward revisions to residential structures, to nonresidential equipment, and to nonresidential structures. Within residential structures, the primary contributor was other structures (particularly brokers' commissions) and other ownership transfer costs. Within nonresidential equipment, downward revisions were widespread. Within nonresidential structures, the primary contributor was mining exploration, shafts, and wells.
The quarterly pattern of real private fixed investment was changed in 3 of the 21 quarters (chart 4). For the third quarter of 2015 and the first quarter of 2019, private fixed investment accelerated; in the previously published estimates, it decelerated. In the first quarter of 2018, it decelerated, rather than accelerated. The largest upward revision was to the fourth quarter of 2017, and the largest downward revision was to the first quarter of 2018.
| Share of current-dollar PFI (percent) | Change from preceding period (percent) | Contribution to percent change in real PFI (percentage points) | |||||||||
|---|---|---|---|---|---|---|---|---|---|---|---|
| 2018 | 2014 | 2015 | 2016 | 2017 | 2018 | 2014 | 2015 | 2016 | 2017 | 2018 | |
| Private fixed investment1 | 100.0 | 6.6 | 3.4 | 1.9 | 4.2 | 4.6 | 6.6 | 3.4 | 1.9 | 4.2 | 4.6 |
| Nonresidential | 78.0 | 7.2 | 1.8 | 0.7 | 4.4 | 6.4 | 5.9 | 1.5 | 0.6 | 3.4 | 4.9 |
| Structures | 17.7 | 11.0 | −3.0 | −5.0 | 4.7 | 4.1 | 2.0 | −0.6 | −0.9 | 0.8 | 0.7 |
| Commercial and health care | 5.2 | 12.9 | 10.6 | 17.7 | 3.2 | −0.1 | 0.5 | 0.5 | 0.8 | 0.2 | 0.0 |
| Manufacturing | 1.8 | 12.9 | 33.8 | −5.1 | −15.2 | −6.1 | 0.2 | 0.7 | −0.1 | −0.4 | −0.1 |
| Power and communication | 3.3 | 15.0 | −3.4 | 0.3 | −0.9 | −0.7 | 0.5 | −0.1 | 0.0 | 0.0 | 0.0 |
| Mining exploration, shafts, and wells | 3.9 | 8.0 | −29.2 | −42.9 | 40.9 | 24.2 | 0.5 | −1.9 | −1.9 | 1.0 | 0.8 |
| Other structures | 3.5 | 8.3 | 9.3 | 7.0 | 1.7 | 2.6 | 0.2 | 0.3 | 0.2 | 0.1 | 0.1 |
| Equipment | 34.2 | 7.0 | 3.2 | −1.3 | 4.7 | 6.8 | 2.6 | 1.2 | −0.5 | 1.6 | 2.3 |
| Information processing equipment | 11.4 | 5.2 | 6.6 | 5.3 | 9.8 | 9.2 | 0.6 | 0.8 | 0.6 | 1.1 | 1.0 |
| Computers and peripheral equipment | 3.3 | −0.1 | 0.8 | −0.5 | 8.8 | 9.9 | 0.0 | 0.0 | 0.0 | 0.3 | 0.3 |
| Other | 8.1 | 7.6 | 9.1 | 7.6 | 10.3 | 9.0 | 0.6 | 0.7 | 0.6 | 0.8 | 0.7 |
| Industrial equipment | 6.9 | 3.9 | 0.2 | −1.1 | 6.3 | 4.5 | 0.3 | 0.0 | −0.1 | 0.4 | 0.3 |
| Transportation equipment | 8.4 | 11.1 | 10.6 | −5.5 | −4.9 | 6.4 | 1.0 | 1.0 | −0.6 | −0.5 | 0.5 |
| Other equipment | 7.5 | 7.9 | −6.6 | −5.3 | 7.9 | 5.6 | 0.7 | −0.6 | −0.4 | 0.6 | 0.4 |
| Intellectual property products | 26.1 | 4.8 | 3.6 | 7.9 | 3.7 | 7.4 | 1.2 | 0.9 | 1.9 | 0.9 | 1.9 |
| Software | 10.6 | 6.3 | 4.8 | 8.2 | 8.0 | 10.6 | 0.7 | 0.5 | 0.8 | 0.8 | 1.1 |
| Research and development | 12.9 | 3.9 | 2.6 | 8.7 | 0.4 | 5.3 | 0.5 | 0.3 | 1.1 | 0.1 | 0.7 |
| Entertainment, literary, and artistic originals | 2.5 | 3.4 | 3.8 | 2.9 | 2.6 | 4.6 | 0.1 | 0.1 | 0.1 | 0.1 | 0.1 |
| Residential | 22.0 | 3.8 | 10.2 | 6.5 | 3.5 | −1.5 | 0.7 | 1.9 | 1.4 | 0.8 | −0.3 |
| Structures | 21.7 | 3.7 | 10.2 | 6.4 | 3.4 | −1.5 | 0.7 | 1.9 | 1.3 | 0.8 | −0.3 |
| Permanent site | 9.6 | 9.3 | 11.8 | 6.2 | 3.8 | −0.4 | 0.7 | 1.0 | 0.6 | 0.4 | 0.0 |
| Single family | 8.0 | 6.2 | 11.4 | 5.2 | 6.7 | 0.9 | 0.4 | 0.8 | 0.4 | 0.5 | 0.1 |
| Multifamily | 1.7 | 26.7 | 13.5 | 10.6 | −7.4 | −6.3 | 0.3 | 0.2 | 0.2 | −0.2 | −0.1 |
| Other structures | 12.0 | −0.1 | 9.0 | 6.6 | 3.1 | −2.4 | 0.0 | 1.0 | 0.8 | 0.4 | −0.3 |
| Equipment | 0.4 | 8.7 | 8.5 | 8.6 | 7.2 | 0.8 | 0.0 | 0.0 | 0.0 | 0.0 | 0.0 |
| Revisions (percentage points) | |||||||||||
| Private fixed investment | ...... | 0.3 | 0.0 | 0.2 | −0.6 | −0.6 | 0.3 | 0.0 | 0.2 | −0.6 | −0.6 |
| Nonresidential | ...... | 0.3 | 0.0 | 0.2 | −0.9 | −0.5 | 0.3 | 0.0 | 0.2 | −0.7 | −0.4 |
| Structures | ...... | 0.4 | 0.0 | 0.0 | 0.1 | −0.9 | 0.1 | 0.0 | 0.0 | 0.0 | −0.2 |
| Equipment | ...... | 0.3 | 0.1 | 0.2 | −1.4 | −0.6 | 0.1 | 0.1 | 0.1 | −0.5 | −0.2 |
| Intellectual property products | ...... | 0.5 | −0.1 | 0.4 | −0.9 | −0.1 | 0.1 | 0.0 | 0.1 | −0.3 | 0.0 |
| Residential | ...... | −0.1 | 0.1 | 0.0 | 0.2 | −1.2 | 0.0 | 0.0 | 0.0 | 0.0 | −0.3 |
| Structures | ...... | −0.1 | 0.0 | 0.0 | 0.1 | −1.2 | 0.0 | 0.0 | 0.0 | 0.0 | −0.3 |
| Equipment | ...... | −0.1 | 0.3 | 0.0 | −0.1 | 0.4 | 0.0 | 0.0 | 0.0 | 0.0 | 0.0 |
- The estimates under the contribution columns are also percent changes.

[Click chart to expand]
Source data and major improvements
The updated estimates of private fixed investment primarily reflect the incorporation of newly available and revised source data, including Census Bureau SAS data, data from the National Science Foundation's Business Research and Development Innovation Survey, and revised trade source data on vehicles in operation. Typically, the annual NIPA update would also incorporate revised data from the Census Bureau's annual revision of its construction spending (value put in place) data. (As noted previously, however, that annual revision will be released in September of this year.)
The estimates also reflect improved prices for investment in electromedical equipment and in cellular telephones; each of these are components of “other” information processing equipment (see “Improved prices” ).
Change in real private inventories, or real inventory investment, was revised down $0.3 billion for 2014, revised up $3.4 billion for 2015, revised down $0.4 billion for 2016, revised up $9.2 billion for 2017, and revised up $3.1 billion for 2018 (table 5; additionally, chart 5 shows quarterly changes).
- For 2014, downward revisions to retail trade and to farm inventories were partly offset by upward revisions to wholesale trade and to mining, utilities, and construction.
- For 2015, the leading contributor to the upward revision was wholesale trade; there were partly offsetting downward revisions to retail trade and to farm.
- For 2016, downward revisions to retail trade, farm, and wholesale trade were partly offset by upward revisions to “other” industries and to manufacturing.
- For 2017, the leading contributor to the upward revision was wholesale trade; other contributors included “other” industries, manufacturing, and farm. These revisions were partly offset by downward revisions to mining, utilities, and construction and to retail trade.
- For 2018, upward revisions to “other” industries, to retail trade, to manufacturing, and to mining, utilities, and construction were partly offset by downward revisions to wholesale trade and to farm.
| Level | Change from preceding period | |||||||||
|---|---|---|---|---|---|---|---|---|---|---|
| 2014 | 2015 | 2016 | 2017 | 2018 | 2014 | 2015 | 2016 | 2017 | 2018 | |
| Change in private inventories1 | 86.3 | 132.4 | 23.0 | 31.7 | 48.1 | −22.4 | 46.1 | −109.4 | 8.7 | 16.5 |
| Farm | −3.5 | 1.1 | −6.6 | −4.8 | −9.0 | −14.0 | 4.7 | −7.7 | 1.8 | −4.2 |
| Mining, utilities, and construction | 4.6 | 19.0 | 8.3 | −15.1 | −1.8 | 10.4 | 14.5 | −10.7 | −23.4 | 13.3 |
| Manufacturing | 18.5 | 38.4 | −0.7 | 10.2 | 1.9 | −9.0 | 19.9 | −39.1 | 11.0 | −8.3 |
| Durable-goods industries | 15.7 | 18.5 | −9.8 | 9.9 | 8.0 | −0.3 | 2.7 | −28.3 | 19.7 | −1.8 |
| Nondurable-goods industries | 2.5 | 20.4 | 10.6 | −0.1 | −7.0 | −9.0 | 17.8 | −9.7 | −10.8 | −6.8 |
| Wholesale trade | 39.8 | 37.2 | 3.7 | 23.6 | 26.2 | 7.3 | −2.7 | −33.5 | 19.9 | 2.7 |
| Durable-goods industries | 25.9 | 12.3 | −0.1 | 13.2 | 31.5 | 9.2 | −13.6 | −12.3 | 13.3 | 18.3 |
| Nondurable-goods industries | 13.8 | 25.4 | 3.9 | 10.3 | −5.8 | −2.1 | 11.6 | −21.5 | 6.5 | −16.2 |
| Retail trade | 15.6 | 27.7 | 25.1 | 13.4 | 22.4 | −21.2 | 12.2 | −2.6 | −11.7 | 9.0 |
| Motor vehicle and parts dealers | 9.7 | 10.3 | 18.3 | 12.9 | 23.1 | −10.3 | 0.6 | 8.1 | −5.4 | 10.2 |
| Food and beverage stores | 0.9 | 2.0 | 1.6 | 1.5 | −0.6 | 0.3 | 1.1 | −0.4 | 0.0 | −2.1 |
| General merchandise stores | −1.1 | 1.6 | −0.7 | −3.3 | −1.4 | −3.5 | 2.7 | −2.3 | −2.6 | 1.9 |
| Other retail stores | 6.3 | 14.0 | 6.3 | 2.7 | 2.3 | −7.7 | 7.7 | −7.8 | −3.6 | −0.4 |
| Other industries | 11.6 | 9.4 | −8.4 | 2.3 | 5.4 | 4.5 | −2.1 | −17.8 | 10.7 | 3.1 |
| Residual2 | 0.1 | −1.5 | −0.4 | 2.1 | 3.4 | 0.0 | −1.6 | 1.1 | 2.5 | 1.2 |
| Revisions | ||||||||||
| Change in private inventories | −0.3 | 3.4 | −0.4 | 9.2 | 3.1 | −0.3 | 3.8 | −3.8 | 9.5 | −6.0 |
| Farm | −0.3 | −0.3 | −0.8 | 1.2 | −0.9 | −0.3 | 0.1 | −0.5 | 1.9 | −2.1 |
| Mining, utilities, and construction | 0.2 | 0.4 | −0.2 | −12.1 | 1.2 | 0.2 | 0.2 | −0.6 | −11.9 | 13.3 |
| Manufacturing | −0.1 | 0.0 | 0.5 | 1.3 | 1.4 | −0.1 | 0.0 | 0.5 | 0.8 | 0.1 |
| Wholesale trade | 0.2 | 3.7 | −0.6 | 18.4 | −3.7 | 0.2 | 3.5 | −4.4 | 19.1 | −22.1 |
| Retail trade | −0.6 | −0.7 | −1.4 | −2.4 | 2.3 | −0.6 | −0.1 | −0.7 | −1.0 | 4.7 |
| Other industries | 0.0 | 0.1 | 1.8 | 2.1 | 2.7 | 0.0 | 0.1 | 1.7 | 0.3 | 0.6 |
- The levels are from NIPA table 5.7.6B.
- The residual is the difference between the first line and the sum of the most detailed lines.
Note. The chained-dollar series are calculated as the period-to-period change in end-of-period inventories. Because the formula for the chain-type quantity indexes uses weights of more than one period, chained-dollar estimates are usually not additive.

[Click chart to expand]
Source data and major improvements
Revisions to inventory investment primarily reflect Census Bureau data on inventory book values, including ARTS and Annual Wholesale Trade Survey, and revised monthly inventory data. As noted previously in this article, the ASM, which would typically also provide inventory book values, was not available for incorporation as part of this annual NIPA update as it is not conducted in the years in which the Census Bureau conducts its Economic Census. Revisions also reflect newly available and revised IRS Statistics of Income data and revised data from the Department of Agriculture for farm inventories.
The percent change in real exports was revised down 0.1 percentage point for both 2014 and 2015, revised up 0.1 percentage point for 2016, revised up 0.5 percentage point for 2017, and revised down 1.0 percentage point for 2018 (table 6).
- For 2014, the revision was due primarily to a downward revision to exports of services. For 2015, the revision was due to downward revisions to both services and to goods.
- For 2016, the revision reflected an upward revision to exports of goods (mostly in capital goods, except automotive) that was partly offset by a downward revision to exports of services (mostly “other” business services).
- For 2017, the revision reflected upward revisions to both exports of goods and services. For goods, the revision primarily reflected an upward revision to capital goods, except automotive. For services, the revision primarily reflected an upward revision to “other” business services.
- For 2018, the revision reflected downward revisions to both exports of services and goods. For services, the revision primarily reflected downward revisions to “other” business services, charges for the use of intellectual property not elsewhere classified (which comprises royalties and license fees), and to travel, that were partly offset by an upward revision to government goods and services. For goods, the revision primarily reflected downward revisions to foods, feeds, and beverages and to other goods.
The quarterly pattern of real exports was changed for only 1 of the 21 quarters of the revision period (chart 6). For the third quarter of 2017, the revised estimates show an acceleration; the previously published estimates showed a deceleration. The largest upward revision was to the fourth quarter of 2017, and the largest downward revision was to the second quarter of 2018.
| Share of current-dollar exports (percent) | Change from preceding period (percent) | Contribution to percent change in real exports (percentage points) | |||||||||
|---|---|---|---|---|---|---|---|---|---|---|---|
| 2018 | 2014 | 2015 | 2016 | 2017 | 2018 | 2014 | 2015 | 2016 | 2017 | 2018 | |
| Exports of goods and services1 | 100.0 | 4.2 | 0.5 | 0.0 | 3.5 | 3.0 | 4.2 | 0.5 | 0.0 | 3.5 | 3.0 |
| Exports of goods | 66.2 | 4.6 | −0.4 | 0.6 | 3.9 | 4.3 | 3.2 | −0.2 | 0.4 | 2.5 | 2.8 |
| Foods, feeds, and beverages | 5.3 | 8.0 | 1.9 | 5.7 | 0.5 | −0.1 | 0.5 | 0.1 | 0.3 | 0.0 | 0.0 |
| Industrial supplies and materials | 21.3 | 3.5 | 0.0 | 1.7 | 8.0 | 7.0 | 0.8 | 0.0 | 0.3 | 1.4 | 1.4 |
| Capital goods, except automotive | 22.4 | 3.6 | −1.3 | −2.0 | 2.5 | 4.6 | 0.8 | −0.3 | −0.5 | 0.6 | 1.0 |
| Automotive vehicles, engines, and parts | 6.3 | 4.1 | −4.9 | −0.2 | 4.7 | −0.2 | 0.3 | −0.3 | 0.0 | 0.3 | 0.0 |
| Consumer goods, except food and automotive | 8.2 | 6.9 | 1.6 | 0.2 | 3.4 | 3.2 | 0.6 | 0.1 | 0.0 | 0.3 | 0.3 |
| Other | 2.6 | 10.6 | 6.0 | 7.7 | −4.8 | 4.5 | 0.3 | 0.2 | 0.2 | −0.1 | 0.1 |
| Exports of services | 33.8 | 3.3 | 2.2 | −1.1 | 2.7 | 0.7 | 1.1 | 0.7 | −0.4 | 1.0 | 0.2 |
| Transport | 3.7 | 3.1 | 2.8 | −0.3 | 3.1 | 3.3 | 0.1 | 0.1 | 0.0 | 0.1 | 0.1 |
| Travel (for all purposes including education) | 8.6 | 6.0 | 8.7 | −1.0 | 0.0 | −0.4 | 0.5 | 0.7 | −0.1 | 0.0 | 0.0 |
| Charges for the use of intellectual property n.e.c. | 5.1 | −0.7 | −4.1 | −1.0 | −0.2 | −0.6 | 0.0 | −0.2 | −0.1 | 0.0 | 0.0 |
| Other business services | 14.7 | 4.7 | 0.6 | −0.7 | 5.9 | 0.7 | 0.6 | 0.1 | −0.1 | 0.9 | 0.1 |
| Government goods and services n.e.c. | 0.8 | −12.3 | 3.1 | −6.5 | 3.5 | 5.6 | −0.1 | 0.0 | −0.1 | 0.0 | 0.1 |
| Other | 0.9 | 1.9 | 1.8 | −7.3 | −4.5 | 2.8 | 0.0 | 0.0 | −0.1 | 0.0 | 0.0 |
| Revisions (percentage points) | |||||||||||
| Exports of goods and services | ...... | −0.1 | −0.1 | 0.1 | 0.5 | −1.0 | −0.1 | −0.1 | 0.1 | 0.5 | −1.0 |
| Exports of goods | ...... | 0.0 | −0.1 | 0.3 | 0.6 | −0.4 | 0.0 | 0.0 | 0.1 | 0.4 | −0.3 |
| Exports of services | ...... | −0.3 | −0.2 | −0.2 | 0.2 | −1.9 | −0.1 | −0.1 | −0.1 | 0.1 | −0.7 |
- The estimates under the contribution columns are also percent changes.

[Click chart to expand]
The percent change in real imports was revised down 0.1 percentage point for 2014, down 0.2 percentage point for 2015, up 0.1 percentage point for 2016 and 2017, and down 0.1 percentage point for 2018 (table 7). Like the revisions to exports, the revisions to imports primarily reflect updated data from the BEA's international transaction accounts (ITAs).
- For 2014 and 2015, the revisions were mostly due to downward revisions to services; imports of goods was also revised downward.
- For 2016, both goods and services imports contributed to the upward revision. Within goods, the most notable upward revision was to capital goods, except automotive; within services, the most notable upward revision was to “other” business services.
- For 2017, upward revisions to imports of “other” goods and to capital goods, except automotive, were the primary contributors to the revision.
- For 2018, the revision was due to a downward revisions to imports of services, primarily royalties and license fees, and to “other” business services; these were partly offset by an upward revision to goods, primarily capital goods, except automotive.
| Share of current-dollar imports (percent) | Change from preceding period (percent) | Contribution to percent change in real imports (percentage points) | |||||||||
|---|---|---|---|---|---|---|---|---|---|---|---|
| 2018 | 2014 | 2015 | 2016 | 2017 | 2018 | 2014 | 2015 | 2016 | 2017 | 2018 | |
| Imports of goods and services1 | 100 | 5 | 5.3 | 2 | 4.7 | 4.4 | 5 | 5.3 | 2 | 4.7 | 4.4 |
| Imports of goods | 81.6 | 5.6 | 5.7 | 1.5 | 4.8 | 5 | 4.6 | 4.7 | 1.2 | 3.9 | 4.1 |
| Foods, feeds, and beverages | 4.7 | 5.2 | 4 | 1.4 | 2.3 | 7.8 | 0.2 | 0.2 | 0.1 | 0.1 | 0.4 |
| Industrial supplies and materials | 18.3 | 1 | 1.5 | 2.9 | 1.7 | −0.1 | 0.2 | 0.3 | 0.5 | 0.3 | 0 |
| Capital goods, except automotive | 22.1 | 8.6 | 4.3 | 1.1 | 9.5 | 8.4 | 1.7 | 0.9 | 0.2 | 2 | 1.8 |
| Automotive vehicles, engines, and parts | 11.9 | 7.1 | 8.4 | 1 | 2.8 | 3.9 | 0.8 | 1 | 0.1 | 0.4 | 0.5 |
| Consumer goods, except food and automotive | 20.6 | 7.1 | 9.3 | 0.2 | 4.5 | 7.8 | 1.4 | 1.9 | 0.1 | 1 | 1.6 |
| Other | 4 | 7.2 | 10.7 | 5.5 | 3.5 | −3.3 | 0.3 | 0.4 | 0.2 | 0.2 | −0.1 |
| Imports of services | 18.4 | 2.3 | 3.5 | 4.4 | 4.4 | 1.6 | 0.4 | 0.6 | 0.8 | 0.8 | 0.3 |
| Transport | 3.4 | 0.2 | 4.6 | 4.8 | 2.5 | 0.7 | 0 | 0.2 | 0.2 | 0.1 | 0 |
| Travel (for all purposes including education) | 4.6 | 6.9 | 12.7 | 9.9 | 7.9 | 5.4 | 0.3 | 0.5 | 0.4 | 0.4 | 0.3 |
| Charges for the use of intellectual property n.e.c. | 1.8 | 5.9 | −3.6 | 14.8 | 11.6 | 2.6 | 0.1 | −0.1 | 0.2 | 0.2 | 0.1 |
| Other business services | 7.5 | 1.2 | 0.8 | 0.2 | 1.9 | −0.9 | 0.1 | 0.1 | 0 | 0.2 | −0.1 |
| Government goods and services n.e.c. | 0.7 | −4.8 | −1.5 | −2.3 | −1.8 | −0.4 | 0 | 0 | 0 | 0 | 0 |
| Other | 0.3 | 1.7 | −5.9 | 1.1 | 21.8 | 21.4 | 0 | 0 | 0 | 0.1 | 0.1 |
| Revisions (percentage points) | |||||||||||
| Imports of goods and services | ...... | −0.1 | −0.2 | 0.1 | 0.1 | −0.1 | −0.1 | −0.2 | 0.1 | 0.1 | −0.1 |
| Imports of goods | ...... | 0 | −0.1 | 0.1 | 0.2 | 0.2 | 0 | −0.1 | 0.1 | 0.1 | 0.1 |
| Imports of services | ...... | −0.3 | −0.5 | 0.2 | 0 | −1.7 | −0.1 | −0.1 | 0 | 0 | −0.3 |
- The estimates under the contribution columns are also percent changes.
The quarterly pattern of real imports over the period of the revision was changed in 6 of the 21 quarters. Revised estimates indicate that real imports decelerated in the fourth quarter of 2015, accelerated in the first quarter of 2016, and decelerated in the second quarter of 2016. In the previously published estimates, real imports turned down in the fourth quarter, turned up in the first quarter, and accelerated in the second quarter. Imports decelerated, rather than accelerated, in the third quarter of 2017, and in the second quarter of 2018, imports decelerated; the previously published estimates showed a downturn. The largest upward revision was to the fourth quarter of 2017, and the largest downward revision was to the first quarter of 2018 (chart 7).

[Click chart to expand]
Source data and major improvements
Estimates of exports and imports are primarily based on data from BEA's ITAs. As with the NIPAs, the ITAs are updated each year; the most recent update was released in June 2019.6 Revisions to the ITAs, and therefore to NIPA estimates of exports and imports for 2014–2018, primarily reflect revised source data from the Census Bureau, newly available and revised source data from BEA's quarterly surveys of international services transactions, and from other sources, including the U.S. Customs and Border Protection.
The revisions to exports (in the previous section) and to imports also reflect the new quality-adjusted prices for electromedical equipment, which is included in “other” capital goods, except automotive, and the improved prices for telecommunication, computer, and information services and for maintenance and repair services, which is reflected in “other” business services. Imports are also improved by the introduction of the newly available quality-adjusted price indexes for cellular telephones (see “Improved prices”).
The percent change in real government spending was unrevised for 2014 and 2015, revised up 0.4 percentage point for 2016, revised up 0.8 percentage point for 2017, and revised up 0.2 percentage point for 2018 (table 8).
- For 2016, the revision was primarily due to upward revisions to state and local government consumption expenditures and to state and local government investment.
- For 2017, the revision was primarily due to upward revisions to state and local government consumption expenditures, to state and local government investment, and to federal defense consumption expenditures.
- For 2018, the revision was primarily due to upward revisions to state and local consumption expenditures and to federal nondefense consumption expenditures.
The quarterly pattern of real government spending was changed for only 1 of the 21 quarters of the revision period. In the third quarter of 2018, the revised estimates decelerated, rather than accelerated. The largest upward revision was to the second quarter of 2017, and the largest downward revision was to the third quarter of 2018 (chart 8).
| Share of current-dollar CEGI (percent) | Change from preceding period (percent) | Contribution to percent change in real CEGI (percentage points) | |||||||||
|---|---|---|---|---|---|---|---|---|---|---|---|
| 2018 | 2014 | 2015 | 2016 | 2017 | 2018 | 2014 | 2015 | 2016 | 2017 | 2018 | |
| Government consumption expenditures and gross investment1 | 100.0 | −0.9 | 1.9 | 1.8 | 0.7 | 1.7 | −0.9 | 1.9 | 1.8 | 0.7 | 1.7 |
| Consumption expenditures | 80.9 | −0.8 | 1.8 | 1.8 | 0.6 | 1.7 | −0.6 | 1.5 | 1.5 | 0.5 | 1.3 |
| Gross investment | 19.1 | −1.4 | 2.4 | 1.8 | 1.2 | 2.0 | −0.3 | 0.5 | 0.4 | 0.2 | 0.4 |
| Federal | 37.5 | −2.6 | −0.1 | 0.4 | 0.8 | 2.9 | −1.0 | 0.0 | 0.2 | 0.3 | 1.1 |
| National defense | 22.1 | −4.1 | −2.1 | −0.6 | 0.7 | 3.3 | −1.0 | −0.5 | −0.1 | 0.2 | 0.7 |
| Consumption expenditures | 17.7 | −3.5 | −2.2 | −0.3 | 0.1 | 2.9 | −0.7 | −0.4 | −0.1 | 0.0 | 0.5 |
| Gross investment | 4.3 | −6.5 | −1.6 | −1.8 | 3.6 | 5.1 | −0.3 | −0.1 | −0.1 | 0.2 | 0.2 |
| Nondefense | 15.4 | −0.1 | 3.1 | 2.0 | 0.8 | 2.4 | 0.0 | 0.5 | 0.3 | 0.1 | 0.4 |
| Consumption expenditures | 11.7 | −0.3 | 3.3 | 1.9 | 0.4 | 3.1 | 0.0 | 0.4 | 0.2 | 0.0 | 0.4 |
| Gross investment | 3.7 | 0.4 | 2.5 | 2.2 | 2.2 | 0.5 | 0.0 | 0.1 | 0.1 | 0.1 | 0.0 |
| State and local | 62.5 | 0.2 | 3.2 | 2.6 | 0.6 | 1.0 | 0.1 | 2.0 | 1.7 | 0.4 | 0.6 |
| Consumption expenditures | 51.4 | 0.2 | 3.0 | 2.5 | 0.8 | 0.9 | 0.1 | 1.5 | 1.3 | 0.4 | 0.5 |
| Gross investment | 11.0 | 0.2 | 4.0 | 3.2 | −0.1 | 1.3 | 0.0 | 0.4 | 0.4 | 0.0 | 0.1 |
| Revisions (percentage points) | |||||||||||
| Government consumption expenditures and gross investment | ...... | 0.0 | 0.0 | 0.4 | 0.8 | 0.2 | 0.0 | 0.0 | 0.4 | 0.8 | 0.2 |
| Federal | ...... | 0.0 | −0.1 | 0.0 | 0.1 | 0.3 | 0.0 | 0.0 | 0.0 | 0.0 | 0.1 |
| National defense | ...... | 0.1 | −0.1 | 0.0 | 0.0 | −0.1 | 0.0 | 0.0 | 0.0 | 0.0 | 0.0 |
| Nondefense | ...... | 0.0 | 0.0 | 0.1 | 0.0 | 0.9 | 0.0 | 0.0 | 0.0 | 0.0 | 0.1 |
| State and local | ...... | 0.1 | 0.2 | 0.6 | 1.1 | 0.2 | 0.0 | 0.1 | 0.4 | 0.8 | 0.1 |
- The estimates under the contribution columns are also percent changes.

[Click chart to expand]
Source data
The revisions to the estimates of state and local government spending primarily reflect the incorporation of revised and newly available data from Census Bureau surveys of government finances, which are used to estimate most components of spending by state and local governments, and BLS QCEW data, which are used to prepare estimates of government compensation. Revisions to federal government spending primarily reflect the incorporation of revised allocations of Office of Management and Budget (OMB) data from the federal budget for fiscal year (FY) 2016 and FY 2017, revised FY 2018 OMB budget data for 2017 and 2018, and newly available preliminary OMB budget data for FY 2018.
Revisions to BEA's various price measures—such as gross domestic purchases, GDP, and PCE—were small and reflect revised and newly available source data and the regular incorporation of annual weights for the most recent year (2018) (table 9).
- The percent changes in the gross domestic purchases price index—a measure of the prices paid by consumers, businesses, and governments—were revised down 0.1 percentage point for 2014, unrevised for 2015, revised down 0.1 percentage point for 2016, unrevised for 2017, and revised up 0.2 percentage point for 2018. The quarterly pattern was changed for 4 of the 21 quarters of the revision period. The index turned down in the fourth quarter of 2014 and showed a larger decrease in the first quarter of 2015; in the previously published estimates, the index decelerated in the fourth quarter of 2014 and turned down in the first quarter of 2015. In the revised estimates, there was no change in the index from the fourth quarter of 2015 to the first quarter of 2016; in the previously published estimates, the decrease was larger in the first quarter of 2016. In the first quarter of 2018, the index accelerated; in the previously published estimates, it decelerated. The largest upward revision was to the first quarter of 2018. From the fourth quarter of 2013 to the first quarter of 2019, the average annual rate of increase in the index was 1.4 percent, revised up 0.1 percentage point.
- The percent changes in GDP prices were revised down 0.1 percentage point for 2014, unrevised for 2015, revised down 0.1 percentage point for 2016, unrevised for 2017, and revised up 0.2 percentage point for 2018.
- The percent changes in PCE prices were unrevised for 2014, revised down 0.1 percentage point for 2015 and 2016, unrevised for 2017, and revised up 0.1 percentage point for 2018.
- From the fourth quarter of 2013 to the first quarter of 2019, the average annual rate of increase in the price index for PCE was unrevised at 1.3 percent. The average annual rate of increase in the “core” PCE price index (which excludes food and energy) was unrevised at 1.6 percent.
The quarterly patterns of price indexes for GDP, PCE, and the PCE core index were similar to the patterns in the previously published estimates (chart 9).
| Change from preceding period (percent) | Contribution to percent change in gross domestic purchases prices (percentage points) | |||||||||
|---|---|---|---|---|---|---|---|---|---|---|
| 2014 | 2015 | 2016 | 2017 | 2018 | 2014 | 2015 | 2016 | 2017 | 2018 | |
| Gross domestic purchases1 | 1.6 | 0.3 | 0.7 | 1.9 | 2.4 | 1.6 | 0.3 | 0.7 | 1.9 | 2.4 |
| Personal consumption expenditures | 1.5 | 0.2 | 1.0 | 1.8 | 2.1 | 1.0 | 0.1 | 0.7 | 1.2 | 1.4 |
| Goods | −0.5 | −3.1 | −1.6 | 0.3 | 0.7 | −0.1 | −0.7 | −0.4 | 0.1 | 0.1 |
| Durable goods | −2.6 | −2.2 | −2.4 | −2.3 | −1.7 | −0.2 | −0.2 | −0.2 | −0.2 | −0.1 |
| Nondurable goods | 0.5 | −3.5 | −1.3 | 1.6 | 1.9 | 0.1 | −0.5 | −0.2 | 0.2 | 0.3 |
| Services | 2.4 | 1.8 | 2.3 | 2.4 | 2.7 | 1.1 | 0.8 | 1.0 | 1.1 | 1.2 |
| Gross private domestic investment | 1.9 | 0.7 | −0.1 | 1.7 | 2.3 | 0.3 | 0.1 | 0.0 | 0.3 | 0.4 |
| Fixed investment | 2.1 | 1.0 | 0.0 | 1.7 | 2.3 | 0.3 | 0.2 | 0.0 | 0.3 | 0.4 |
| Nonresidential | 1.2 | 0.6 | −0.9 | 1.0 | 1.4 | 0.2 | 0.1 | −0.1 | 0.1 | 0.2 |
| Structures | 5.7 | 2.2 | 0.3 | 2.7 | 3.6 | 0.2 | 0.1 | 0.0 | 0.1 | 0.1 |
| Equipment | −0.6 | −0.5 | −1.3 | −0.2 | 0.1 | 0.0 | 0.0 | −0.1 | 0.0 | 0.0 |
| Intellectual property products | 0.7 | 0.9 | −1.2 | 1.3 | 1.5 | 0.0 | 0.0 | −0.1 | 0.1 | 0.1 |
| Residential | 5.8 | 2.7 | 3.5 | 4.5 | 5.6 | 0.2 | 0.1 | 0.1 | 0.2 | 0.2 |
| Change in private inventories | ...... | ...... | ...... | ...... | ...... | 0.0 | 0.0 | 0.0 | 0.0 | 0.0 |
| Government consumption expenditures and gross investment | 2.1 | 0.3 | 0.3 | 2.5 | 3.5 | 0.4 | 0.1 | 0.1 | 0.4 | 0.6 |
| Federal | 1.7 | 0.6 | 0.6 | 2.1 | 3.1 | 0.1 | 0.0 | 0.0 | 0.1 | 0.2 |
| National defense | 1.4 | 0.3 | 0.4 | 1.7 | 3.0 | 0.1 | 0.0 | 0.0 | 0.1 | 0.1 |
| Nondefense | 2.1 | 1.1 | 0.9 | 2.6 | 3.3 | 0.1 | 0.0 | 0.0 | 0.1 | 0.1 |
| State and local | 2.3 | 0.0 | 0.2 | 2.7 | 3.7 | 0.3 | 0.0 | 0.0 | 0.3 | 0.4 |
| Addenda | ||||||||||
| Gross domestic purchases: | ||||||||||
| Food | 1.7 | 1.1 | −1.1 | −0.1 | 0.5 | 0.1 | 0.1 | −0.1 | 0.0 | 0.0 |
| Energy goods and services | −0.9 | −18.2 | −7.4 | 8.7 | 7.9 | 0.0 | −0.7 | −0.2 | 0.2 | 0.2 |
| Excluding food and energy | 1.7 | 1.0 | 1.1 | 1.8 | 2.3 | 1.6 | 0.9 | 1.0 | 1.7 | 2.1 |
| Personal consumption expenditures (PCE): | ||||||||||
| Food and beverages purchased for off-premises consumption | 1.9 | 1.1 | −1.0 | −0.1 | 0.5 | ...... | ...... | ...... | ...... | ...... |
| Energy goods and services | −0.8 | −18.0 | −7.3 | 8.7 | 8.0 | ...... | ...... | ...... | ...... | ...... |
| Excluding food and energy | 1.6 | 1.2 | 1.6 | 1.6 | 1.9 | ...... | ...... | ...... | ...... | ...... |
| Gross domestic product (GDP) | 1.8 | 1.0 | 1.0 | 1.9 | 2.4 | ...... | ...... | ...... | ...... | ...... |
| Exports of goods and services | 0.1 | −4.9 | −2.0 | 2.6 | 3.4 | ...... | ...... | ...... | ...... | ...... |
| Imports of goods and services | −0.8 | −8.1 | −3.6 | 2.2 | 2.9 | ...... | ...... | ...... | ...... | ...... |
| Revisions (percentage points) | ||||||||||
| Gross domestic purchases | −0.1 | 0.0 | −0.1 | 0.0 | 0.2 | −0.1 | 0.0 | −0.1 | 0.0 | 0.2 |
| Food | 0.0 | 0.0 | 0.0 | 0.0 | −0.1 | 0.0 | 0.0 | 0.0 | 0.0 | 0.0 |
| Energy goods and services | 0.0 | 0.0 | 0.1 | 0.0 | −0.1 | 0.0 | 0.0 | 0.0 | 0.0 | 0.0 |
| Excluding food and energy | −0.1 | 0.0 | 0.0 | 0.0 | 0.2 | 0.0 | 0.0 | −0.1 | 0.0 | 0.2 |
| PCE | 0.0 | −0.1 | −0.1 | 0.0 | 0.1 | ...... | ...... | ...... | ...... | ...... |
| Food and beverages purchased for off-premises consumption | 0.0 | 0.0 | 0.0 | 0.0 | 0.0 | ...... | ...... | ...... | ...... | ...... |
| Energy goods and services | 0.1 | 0.0 | 0.0 | 0.0 | 0.1 | ...... | ...... | ...... | ...... | ...... |
| Excluding food and energy | 0.0 | −0.1 | −0.1 | 0.0 | 0.0 | ...... | ...... | ...... | ...... | ...... |
| GDP | −0.1 | 0.0 | −0.1 | 0.0 | 0.2 | ...... | ...... | ...... | ...... | ...... |
| Exports of goods and services | 0.1 | 0.1 | 0.0 | −0.3 | −0.2 | ...... | ...... | ...... | ...... | ...... |
| Imports of goods and services | 0.1 | 0.1 | 0.0 | −0.1 | −0.2 | ...... | ...... | ...... | ...... | ...... |
- The estimates under the contribution columns are also percent changes.

[Click chart to expand]
National income was revised by less than 0.1 percent for 2014 (down), 2015 (up), and 2016 (down). For 2017, it was revised down 0.3 percent and was revised up 0.1 percent for 2018 (table 10).
- For 2014, downward revisions to rental income of persons and net interest were partly offset by upward revisions to corporate profits and compensation.
- For 2015, upward revisions to taxes on production and imports, corporate profits, and compensation were partly offset by downward revisions to net interest and rental income of persons.
- For 2016, downward revisions to corporate profits and rental income of persons were partly offset by upward revisions to net interest, taxes on production and imports, proprietors' income, and compensation.
- For 2017, downward revisions to corporate profits, business current transfer payments, and rental income of persons were partly offset by upward revisions to net interest, proprietors' income, taxes on production and imports, and compensation.
- For 2018, upward revisions to net interest, compensation, taxes on production and imports, proprietors' income, and the current surplus of government enterprises were partly offset by a large downward revision to corporate profits.
| Level | Change from preceding period | |||||||||
|---|---|---|---|---|---|---|---|---|---|---|
| 2014 | 2015 | 2016 | 2017 | 2018 | 2014 | 2015 | 2016 | 2017 | 2018 | |
| National income | 15242.5 | 15787.9 | 16053.6 | 16708.8 | 17545.9 | 747.8 | 545.4 | 265.7 | 655.2 | 837.1 |
| Compensation of employees | 9249.1 | 9698.2 | 9960.3 | 10411.6 | 10928.5 | 414.9 | 449.1 | 262.2 | 451.3 | 516.8 |
| Wages and salaries | 7475.2 | 7856.7 | 8083.5 | 8462.1 | 8888.5 | 362.0 | 381.5 | 226.8 | 378.6 | 426.4 |
| Government | 1236.9 | 1275.6 | 1308.0 | 1348.0 | 1402.6 | 28.9 | 38.7 | 32.4 | 40.0 | 54.6 |
| Other | 6238.3 | 6581.0 | 6775.5 | 7114.1 | 7485.9 | 333.1 | 342.7 | 194.4 | 338.6 | 371.8 |
| Supplements to wages and salaries | 1773.9 | 1841.5 | 1876.8 | 1949.5 | 2040.0 | 52.8 | 67.6 | 35.4 | 72.7 | 90.4 |
| Employer contributions for employee pension and insurance funds | 1227.5 | 1272.3 | 1295.6 | 1343.9 | 1417.2 | 32.7 | 44.8 | 23.4 | 48.3 | 73.3 |
| Employer contributions for government social insurance | 546.4 | 569.2 | 581.2 | 605.7 | 622.8 | 20.1 | 22.8 | 12.0 | 24.4 | 17.2 |
| Proprietors' income with IVA and CCAdj | 1447.7 | 1422.2 | 1423.7 | 1518.2 | 1588.8 | 44.2 | −25.5 | 1.5 | 94.5 | 70.5 |
| Farm | 69.8 | 56.0 | 35.6 | 38.1 | 27.2 | −18.5 | −13.8 | −20.4 | 2.5 | −10.9 |
| Nonfarm | 1377.9 | 1366.2 | 1388.1 | 1480.1 | 1561.6 | 62.6 | −11.7 | 21.9 | 92.0 | 81.4 |
| Rental income of persons with CCAdj | 604.6 | 648.1 | 681.4 | 718.8 | 756.8 | 47.7 | 43.5 | 33.3 | 37.4 | 38.0 |
| Corporate profits with IVA and CCAdj | 2120.2 | 2061.5 | 2011.5 | 2005.9 | 2074.6 | 109.5 | −58.7 | −50.0 | −5.5 | 68.7 |
| Taxes on corporate income | 407.3 | 396.6 | 377.6 | 319.4 | 219.8 | 44.5 | −10.7 | −19.0 | −58.2 | −99.6 |
| Profits after tax with IVA and CCAdj | 1712.9 | 1664.9 | 1633.9 | 1686.5 | 1854.9 | 65.0 | −48.0 | −31.0 | 52.6 | 168.3 |
| Net dividends | 1096.1 | 1164.9 | 1175.9 | 1239.6 | 1312.6 | 87.1 | 68.8 | 11.0 | 63.7 | 73.0 |
| Undistributed profits with IVA and CCAdj | 616.8 | 500.0 | 458.0 | 446.9 | 542.3 | −22.1 | −116.8 | −42.1 | −11.1 | 95.4 |
| Net interest and miscellaneous payments | 516.1 | 586.8 | 560.0 | 608.0 | 672.6 | 50.2 | 70.7 | −26.8 | 48.0 | 64.6 |
| Taxes on production and imports | 1240.8 | 1277.1 | 1312.8 | 1364.5 | 1441.8 | 52.2 | 36.3 | 35.7 | 51.7 | 77.3 |
| Less: Subsidies | 58.1 | 57.3 | 61.8 | 61.1 | 64.4 | −1.6 | −0.8 | 4.6 | −0.7 | 3.3 |
| Business current transfer payments (net) | 132.9 | 156.7 | 168.2 | 145.4 | 153.7 | 22.6 | 23.8 | 11.5 | −22.8 | 8.3 |
| To persons (net) | 42.9 | 50.3 | 59.7 | 48.1 | 53.2 | 4.5 | 7.3 | 9.4 | −11.6 | 5.1 |
| To government (net) | 98.1 | 109.5 | 103.8 | 97.1 | 101.4 | 13.4 | 11.4 | −5.7 | −6.6 | 4.3 |
| To the rest of the world (net) | −8.1 | −3.0 | 4.8 | 0.2 | −0.9 | 4.7 | 5.1 | 7.8 | −4.6 | −1.1 |
| Current surplus of government enterprises | −11.0 | −5.5 | −2.6 | −2.5 | −6.5 | 5.0 | 5.4 | 3.0 | 0.1 | −4.0 |
| Revisions | ||||||||||
| National income | −3.0 | 4.9 | −5.3 | −47.2 | 16.5 | −3.0 | 7.9 | −10.2 | −41.9 | 63.8 |
| Compensation of employees | 1.0 | 1.3 | 4.1 | 4.4 | 87.1 | 1.0 | 0.3 | 2.8 | 0.3 | 82.7 |
| Proprietors' income with IVA and CCAdj | 0.1 | 0.3 | 4.4 | 17.3 | 10.0 | 0.1 | 0.2 | 4.1 | 12.9 | −7.3 |
| Rental income of persons with CCAdj | −3.8 | −3.7 | −13.4 | −11.4 | −3.1 | −3.8 | 0.1 | −9.7 | 2.0 | 8.3 |
| Corporate profits with IVA and CCAdj | 1.4 | 4.3 | −23.5 | −93.3 | −188.1 | 1.4 | 2.9 | −27.8 | −69.8 | −94.8 |
| Net interest and miscellaneous payments | −1.8 | −5.0 | 14.1 | 31.6 | 95.6 | −1.8 | −3.2 | 19.0 | 17.6 | 63.9 |
| Taxes on production and imports | −0.1 | 7.2 | 9.0 | 17.3 | 12.9 | −0.1 | 7.3 | 1.8 | 8.2 | −4.4 |
| Less: Subsidies | 0.0 | 0.0 | 0.0 | −0.2 | −1.9 | 0.0 | 0.0 | 0.0 | −0.2 | −1.7 |
| Business current transfer payments (net) | 0.0 | 0.1 | 0.2 | −15.8 | −5.8 | 0.0 | 0.1 | 0.1 | −15.9 | 10.0 |
| Current surplus of government enterprises | 0.1 | 0.3 | −0.2 | 2.5 | 6.1 | 0.1 | 0.2 | −0.5 | 2.7 | 3.6 |
- CCAdj
- Capital consumption adjustment
- IVA
- Inventory valuation adjustment
Note. Dollar levels are from NIPA table 1.12.
Source Data
Revisions to the components of national income reflect the incorporation of a variety of newly available and revised source data. For this annual update, major source data include IRS tabulations of tax return data for corporations and for sole proprietorships and partnerships, Census Bureau data on government finances, revised OMB federal budget data, Federal Reserve Board data from the Financial Accounts of the United States, and revised QCEW data.
Current-dollar GDI was revised down for 2014, revised up for 2015, and revised down for 2016; these revisions were less than 0.1 percent. GDI was revised down by about 2 percent for 2017, and it was revised up by about 1 percent for 2018 (table 11).
The percent change in real GDI was unrevised for 2014, revised up 0.1 percentage point for 2015, unrevised for 2016, revised down 0.2 percentage point for 2017, and revised up 0.2 percentage point for 2018. From 2013 to 2018, the average of real GDI and real GDP increased at an average annual rate of 2.4 percent, an upward revision of 0.1 percentage point from the previously published estimates. The sources of revision are the same as those for national income, and they primarily reflect the revisions to the current-dollar estimates of GDI; the revisions to the implicit price deflator for GDP, which is used to deflate GDI, were small.
The statistical discrepancy—current-dollar GDP less current-dollar GDI as a percentage of GDP—was −1.6 percent for 2014, −1.4 percent for 2015, −0.6 percent for 2016, −0.3 percent for 2017, and 0.1 percent for 2018 (chart 11).
The quarterly pattern of real GDI growth was changed in 3 of the 21 quarters (chart 10). In the first quarter of 2014 and the fourth quarter of 2016, real GDI decelerated; in the previously published estimates, it accelerated. In the first quarter of 2015, real GDI decelerated; the previously published estimates showed no change in its growth.
The largest upward revision to real GDI was 2.2 percentage points for the first quarter of 2019; the largest downward revision was 1.3 percentage points for the third quarter of 2018.
| [Billions of dollars] | ||||||||||
|---|---|---|---|---|---|---|---|---|---|---|
| Level | Change from preceding period | |||||||||
| 2014 | 2015 | 2016 | 2017 | 2018 | 2014 | 2015 | 2016 | 2017 | 2018 | |
| Gross domestic product | 17527.3 | 18224.8 | 18715.0 | 19519.4 | 20580.2 | 742.4 | 697.5 | 490.3 | 804.4 | 1060.8 |
| Less: Statistical discrepancy | −289.2 | −254.9 | −112.0 | −67.6 | 10.8 | −128.9 | 34.3 | 143.0 | 44.4 | 78.3 |
| Equals: Gross domestic income | 17816.4 | 18479.7 | 18827.0 | 19587.0 | 20569.4 | 871.3 | 663.3 | 347.3 | 760.0 | 982.5 |
| Plus: Income receipts from the rest of the world | 853.5 | 837.7 | 861.7 | 957.9 | 1106.2 | 30.1 | −15.9 | 24.0 | 96.2 | 148.3 |
| Less: Income payments to the rest of the world | 612.5 | 613.1 | 643.5 | 714.6 | 838.3 | 19.8 | 0.6 | 30.5 | 71.1 | 123.7 |
| Equals: Gross national income | 18057.5 | 18704.3 | 19045.2 | 19830.3 | 20837.3 | 881.6 | 646.8 | 340.8 | 785.1 | 1007.1 |
| Less: Consumption of fixed capital | 2815.0 | 2916.5 | 2991.6 | 3121.4 | 3291.4 | 133.8 | 101.4 | 75.1 | 129.9 | 170.0 |
| Equals: National income | 15242.5 | 15787.9 | 16053.6 | 16708.8 | 17545.9 | 747.8 | 545.4 | 265.7 | 655.2 | 837.1 |
| Less: | ||||||||||
| Corporate profits with IVA and CCAdj | 2120.2 | 2061.5 | 2011.5 | 2005.9 | 2074.6 | 109.5 | −58.7 | −50.0 | −5.5 | 68.7 |
| Taxes on production and imports less subsidies | 1182.7 | 1219.9 | 1251.0 | 1303.3 | 1377.4 | 53.8 | 37.1 | 31.1 | 52.4 | 74.1 |
| Contributions for government social insurance, domestic | 1153.6 | 1204.7 | 1239.9 | 1299.6 | 1356.5 | 49.3 | 51.2 | 35.2 | 59.7 | 56.9 |
| Net interest and miscellaneous payments on assets | 516.1 | 586.8 | 560.0 | 608.0 | 672.6 | 50.2 | 70.7 | −26.8 | 48.0 | 64.6 |
| Business current transfer payments (net) | 132.9 | 156.7 | 168.2 | 145.4 | 153.7 | 22.6 | 23.8 | 11.5 | −22.8 | 8.3 |
| Current surplus of government enterprises | −11.0 | −5.5 | −2.6 | −2.5 | −6.5 | 5.0 | 5.4 | 3.0 | 0.1 | −4.0 |
| Plus: Personal income receipts on assets | 2302.2 | 2470.8 | 2521.4 | 2681.6 | 2930.1 | 235.9 | 168.5 | 50.6 | 160.2 | 248.5 |
| Plus: Personal current transfer receipts | 2541.5 | 2683.3 | 2774.2 | 2848.1 | 2971.5 | 117.2 | 141.7 | 90.9 | 73.9 | 123.4 |
| Equals: Personal income | 14991.7 | 15717.8 | 16121.2 | 16878.8 | 17819.2 | 810.6 | 726.0 | 403.4 | 757.6 | 940.4 |
| Revisions | ||||||||||
| Gross domestic product | 5.5 | 5.5 | 7.9 | 34.0 | 86.1 | 5.5 | 0.0 | 2.4 | 26.2 | 52.1 |
| Statistical discrepancy | 9.8 | 0.0 | 15.0 | 75.6 | 58.5 | 9.8 | −9.8 | 14.9 | 60.6 | −17.1 |
| Gross domestic income | −4.3 | 5.5 | −7.1 | −41.6 | 27.6 | −4.3 | 9.8 | −12.6 | −34.5 | 69.2 |
- CCAdj
- Capital consumption adjustment
- IVA
- Inventory valuation adjustment
Note. Dollar levels are from NIPA table 1.7.5.

[Click chart to expand]

[Click chart to expand]
Personal income was revised down (by less than 0.1 percent) for 2014, 2015, and 2016; it was revised up for 2017 and 2018 (table 12).
- For 2014, a downward revision to rental income of persons was offset by upward revisions to personal current transfer receipts, compensation, and income receipts on assets.
- For 2015, downward revisions to rental income of persons and income receipts on assets were partly offset by an upward revision to compensation and a downward revision to contributions to government social insurance.
- For 2016, downward revisions to rental income of persons and personal current transfer receipts were partly offset by upward revisions to income receipts on assets, compensation, and proprietors' income.
- For 2017, the revision reflected upward revisions to income receipts on assets, proprietors' income, and compensation that were partly offset by downward revisions to personal current transfer receipts and rental income of persons.
- For 2018, the revision primarily reflected upward revisions to income receipts on assets, including both interest and dividends receipts, and to compensation.
- Personal saving was revised up for all years of the revision period. The significant revision for 2018 reflected an upward revision to personal income of almost $250 billion that was partly offset by upward revisions to personal current taxes and to personal outlays.
- The personal saving rate (personal saving as a percentage of disposable personal income) was unrevised for 2014 and 2015, revised up to 6.8 percent for 2016, revised up to 7.0 percent for 2017, and revised up to 7.7 percent in 2018 (an upward revision of 1.0 percentage point).
- For the first quarter of 2014 through the first quarter of 2019, the personal saving rate was revised up for 16 quarters and revised down for 3 quarters; it was unrevised for 2 quarters. The average quarterly saving rate over this period was revised up from 7.0 percent to 7.3 percent.
| Level | Change from preceding period | |||||||||
|---|---|---|---|---|---|---|---|---|---|---|
| 2014 | 2015 | 2016 | 2017 | 2018 | 2014 | 2015 | 2016 | 2017 | 2018 | |
| Personal income | 14991.7 | 15717.8 | 16121.2 | 16878.8 | 17819.2 | 810.6 | 726.0 | 403.4 | 757.6 | 940.4 |
| Compensation of employees | 9249.1 | 9698.2 | 9960.3 | 10411.6 | 10928.5 | 414.9 | 449.1 | 262.2 | 451.3 | 516.8 |
| Wages and salaries | 7475.2 | 7856.7 | 8083.5 | 8462.1 | 8888.5 | 362.0 | 381.5 | 226.8 | 378.6 | 426.4 |
| Private industries | 6238.3 | 6581.0 | 6775.5 | 7114.1 | 7485.9 | 333.1 | 342.7 | 194.4 | 338.6 | 371.8 |
| Government | 1236.9 | 1275.6 | 1308.0 | 1348.0 | 1402.6 | 28.9 | 38.7 | 32.4 | 40.0 | 54.6 |
| Supplements to wages and salaries | 1773.9 | 1841.5 | 1876.8 | 1949.5 | 2040.0 | 52.8 | 67.6 | 35.4 | 72.7 | 90.4 |
| Proprietors' income with IVA and CCAdj | 1447.7 | 1422.2 | 1423.7 | 1518.2 | 1588.8 | 44.2 | −25.5 | 1.5 | 94.5 | 70.5 |
| Farm | 69.8 | 56.0 | 35.6 | 38.1 | 27.2 | −18.5 | −13.8 | −20.4 | 2.5 | −10.9 |
| Nonfarm | 1377.9 | 1366.2 | 1388.1 | 1480.1 | 1561.6 | 62.6 | −11.7 | 21.9 | 92.0 | 81.4 |
| Rental income of persons with CCAdj | 604.6 | 648.1 | 681.4 | 718.8 | 756.8 | 47.7 | 43.5 | 33.3 | 37.4 | 38.0 |
| Personal income receipts on assets | 2302.2 | 2470.8 | 2521.4 | 2681.6 | 2930.1 | 235.9 | 168.5 | 50.6 | 160.2 | 248.5 |
| Personal interest income | 1349.0 | 1437.9 | 1457.4 | 1551.6 | 1702.7 | 76.1 | 88.8 | 19.5 | 94.2 | 151.1 |
| Personal dividend income | 953.2 | 1032.9 | 1064.0 | 1130.0 | 1227.5 | 159.9 | 79.7 | 31.1 | 66.0 | 97.4 |
| Personal current transfer receipts | 2541.5 | 2683.3 | 2774.2 | 2848.1 | 2971.5 | 117.2 | 141.7 | 90.9 | 73.9 | 123.4 |
| Government social benefits to persons | 2498.6 | 2633.0 | 2714.6 | 2800.1 | 2918.3 | 112.7 | 134.4 | 81.5 | 85.5 | 118.2 |
| Other current transfer receipts, from business (net) | 42.9 | 50.3 | 59.7 | 48.1 | 53.2 | 4.5 | 7.3 | 9.4 | −11.6 | 5.1 |
| Less: Contributions for government social insurance | 1153.6 | 1204.7 | 1239.9 | 1299.6 | 1356.5 | 49.3 | 51.2 | 35.2 | 59.7 | 56.9 |
| Less: Personal current taxes | 1784.0 | 1937.8 | 1956.1 | 2045.8 | 2077.6 | 108.2 | 153.8 | 18.3 | 89.7 | 31.9 |
| Equals: Disposable personal income (DPI) | 13207.7 | 13780.0 | 14165.1 | 14833.0 | 15741.5 | 702.5 | 572.3 | 385.1 | 667.9 | 908.5 |
| Less: Personal outlays | 12237.0 | 12731.2 | 13206.3 | 13802.1 | 14531.1 | 533.1 | 494.3 | 475.1 | 595.8 | 729.0 |
| Equals: Personal saving | 970.8 | 1048.8 | 958.8 | 1030.9 | 1210.4 | 169.4 | 78.0 | −90.0 | 72.1 | 179.5 |
| Personal saving as a percentage of DPI (percent) | 7.3 | 7.6 | 6.8 | 7.0 | 7.7 | 0.9 | 0.3 | −0.8 | 0.2 | 0.7 |
| Revisions | ||||||||||
| Personal income | −0.1 | −1.8 | −4.0 | 47.9 | 249.6 | −0.1 | −1.6 | −2.2 | 51.8 | 201.8 |
| Less: Personal current taxes | −1.5 | 2.6 | 1.8 | 11.2 | 29.9 | −1.5 | 4.0 | −0.8 | 9.4 | 18.7 |
| Equals: DPI | 1.3 | −4.3 | −5.8 | 36.7 | 219.7 | 1.3 | −5.7 | −1.4 | 42.5 | 183.0 |
| Less: Personal outlays | 0.9 | −8.9 | −16.4 | −7.4 | 46.4 | 0.9 | −9.8 | −7.5 | 9.0 | 53.8 |
| Equals: Personal saving | 0.4 | 4.6 | 10.6 | 44.1 | 173.4 | 0.4 | 4.1 | 6.0 | 33.5 | 129.3 |
| Personal saving as a percentage of DPI (percentage points) | 0.0 | 0.0 | 0.1 | 0.3 | 1.0 | 0.0 | 0.0 | 0.1 | 0.2 | 0.7 |
- CCAdj
- Capital consumption adjustment
- IVA
- Inventory valuation adjustment
Note. Dollar levels are from NIPA table 2.1.
[Click chart to expand]
Source Data
Most of the components of personal income are also components of national income and of gross domestic income, and the revisions reflect the incorporation of much of the same newly available and revised source data, including tabulations of tax return data from the IRS, Federal Reserve Board data from the Financial Accounts of the United States, and wage and salary data from BLS' QCEW.
Table 13 presents the updated NIPA components with revisions of $5.0 billion or more (in absolute value) and lists the major source data that were incorporated as part of this year's update. Note that the incorporation of newly available and revised source data for a given year usually results in a revision to the level of an estimate both for that year and for subsequent years.
Table A. Summary National Income and Product Accounts, 2018
[Billions of dollars]
| Account 1. Domestic Income and Product Account | |||||
|---|---|---|---|---|---|
| Line | Line | ||||
| 1 | Compensation of employees, paid | 10,941.4 | 15 | Personal consumption expenditures (3-3) | 13,998.7 |
| 2 | Wages and salaries | 8,901.4 | 16 | Goods | 4,364.8 |
| 3 | Domestic (3-12) | 8,881.8 | 17 | Durable goods | 1,475.6 |
| 4 | Rest of the world (5-15) | 19.6 | 18 | Nondurable goods | 2,889.2 |
| 5 | Supplements to wages and salaries (3-14) | 2,040.0 | 19 | Services | 9,633.9 |
| 6 | Taxes on production and imports (4-15) | 1,441.8 | 20 | Gross private domestic investment | 3,628.3 |
| 7 | Less: Subsidies (4-8) | 64.4 | 21 | Fixed investment (6-2) | 3,573.6 |
| 8 | Net operating surplus | 4,959.2 | 22 | Nonresidential | 2,786.9 |
| 9 | Private enterprises (2-19) | 4,965.7 | 23 | Structures | 633.2 |
| 10 | Current surplus of government enterprises (4-28) | −6.5 | 24 | Equipment | 1,222.6 |
| 11 | Consumption of fixed capital (6-14) | 3,291.4 | 25 | Intellectual property products | 931.1 |
| 26 | Residential | 786.7 | |||
| 12 | Gross domestic income | 20,569.4 | 27 | Change in private inventories (6-4) | 54.7 |
| 28 | Net exports of goods and services | −638.2 | |||
| 13 | Statistical discrepancy (6-20) | 10.8 | 29 | Exports (5-1) | 2,510.2 |
| 30 | Imports (5-13) | 3,148.5 | |||
| 31 | Government consumption expenditures and gross investment (4-1 plus 6-3) | 3,591.5 | |||
| 32 | Federal | 1,347.3 | |||
| 33 | National defense | 793.6 | |||
| 34 | Nondefense | 553.7 | |||
| 35 | State and local | 2,244.2 | |||
| 14 | Gross domestic product | 20,580.2 | 36 | Gross domestic product | 20,580.2 |
| Account 2. Private Enterprise Income Account | |||||
|---|---|---|---|---|---|
| Line | Line | ||||
| 1 | Income payments on assets | 3,389.9 | 19 | Net operating surplus, private enterprises (1-9) | 4,965.7 |
| 2 | Interest and miscellaneous payments (2-21 and 3-20 and 4-22 and 5-17) | 3,039.5 | 20 | Income receipts on assets | 2,998.1 |
| 3 | Dividend payments to the rest of the world (5-18) | 203.5 | 21 | Interest (2-2 and 3-4 and 4-7 and 5-5) | 2,146.0 |
| 4 | Reinvested earnings on foreign direct investment in the United States (5-19) | 146.9 | 22 | Dividend receipts from the rest of the world (5-6) | 1,049.7 |
| 5 | Business current transfer payments (net) | 153.7 | 23 | Reinvested earnings on U.S. direct investment abroad (5-7) | −197.7 |
| 6 | To persons (net) (3-24) | 53.2 | |||
| 7 | To government (net) (4-25) | 101.4 | |||
| 8 | To the rest of the world (net) (5-23 minus 5-11) | −0.9 | |||
| 9 | Proprietors' income with IVA and CCAdj (3-17) | 1,588.8 | |||
| 10 | Rental income of persons with CCAdj (3-18) | 756.8 | |||
| 11 | Corporate profits with IVA and CCAdj | 2,074.6 | |||
| 12 | Taxes on corporate income | 219.8 | |||
| 13 | To government (4-16) | 205.8 | |||
| 14 | To the rest of the world (5-23) | 14.0 | |||
| 15 | Profits after tax with IVA and CCAdj | 1,854.9 | |||
| 16 | Net dividends (3-21 plus 4-23) | 1,312.6 | |||
| 17 | Undistributed corporate profits with IVA and CCAdj (6-12) | 542.3 | |||
| 18 | Uses of private enterprise income | 7,963.8 | 24 | Sources of private enterprise income | 7,963.8 |
| Account 3. Personal Income and Outlay Account | |||||
|---|---|---|---|---|---|
| Line | Line | ||||
| 1 | Personal current taxes (4-14) | 2,077.6 | 10 | Compensation of employees, received | 10,928.5 |
| 2 | Personal outlays | 14,531.1 | 11 | Wages and salaries | 8,888.5 |
| 3 | Personal consumption expenditures (1-15) | 13,998.7 | 12 | Domestic (1-3) | 8,881.8 |
| 4 | Personal interest payments (2-21 and 3-20 and 4-22 and 5-17) | 336.7 | 13 | Rest of the world (5-3) | 6.7 |
| 5 | Personal current transfer payments | 195.8 | 14 | Supplements to wages and salaries (1-5) | 2,040.0 |
| 6 | To government (4-26) | 106.9 | 15 | Employer contributions for employee pension and insurance funds | 1,417.2 |
| 7 | To the rest of the world (net) (5-21 minus 5-9) | 88.9 | 16 | Employer contributions for government social insurance | 622.8 |
| 8 | Personal saving (6-11) | 1,210.4 | 17 | Proprietors' income with IVA and CCAdj (2-9) | 1,588.8 |
| 18 | Rental income of persons with CCAdj (2-10) | 756.8 | |||
| 19 | Personal income receipts on assets | 2,930.1 | |||
| 20 | Personal interest income (2-2 plus 3-4 plus 4-7 plus 5-5 less 2-21 less 4-22 less 5-17) | 1,702.7 | |||
| 21 | Personal dividend income (2-16 less 4-23) | 1,227.5 | |||
| 22 | Personal current transfer receipts | 2,971.5 | |||
| 23 | Government social benefits (4-4) | 2,918.3 | |||
| 24 | From business (net) (2-6) | 53.2 | |||
| 25 | Less: Contributions for government social insurance, domestic (4-19) | 1,356.5 | |||
| 9 | Personal taxes, outlays, and saving | 17,819.2 | 26 | Personal income | 17,819.2 |
| Account 4. Government Receipts and Expenditures Account | |||||
|---|---|---|---|---|---|
| Line | Line | ||||
| 1 | Consumption expenditures (1-31) | 2,904.3 | 13 | Current tax receipts | 3,752.9 |
| 2 | Current transfer payments | 2,999.7 | 14 | Personal current taxes (3-1) | 2,077.6 |
| 3 | Government social benefits | 2,940.8 | 15 | Taxes on production and imports (1-6) | 1,441.8 |
| 4 | To persons (3-23) | 2,918.3 | 16 | Taxes on corporate income (2-13) | 205.8 |
| 5 | To the rest of the world (5-22) | 22.5 | 17 | Taxes from the rest of the world (5-10) | 27.7 |
| 6 | Other current transfer payments to the rest of the world (5-22) | 58.9 | 18 | Contributions for government social insurance | 1,361.6 |
| 7 | Interest payments (2-21 and 3-20 and 4-22 and 5-17) | 818.2 | 19 | From persons (3-25) | 1,356.5 |
| 8 | Subsidies (1-7) | 64.4 | 20 | From the rest of the world (5-10) | 5.2 |
| 9 | Net government saving (6-13) | −1,248.9 | 21 | Income receipts on assets | 210.0 |
| 10 | Federal | −1,009.8 | 22 | Interest and miscellaneous receipts (2-2 and 3-4 and 4-7 and 5-5) | 124.9 |
| 11 | State and local | −239.2 | 23 | Dividends (2-16 less 3-21) | 85.1 |
| 24 | Current transfer receipts | 219.6 | |||
| 25 | From business (net) (2-7) | 101.4 | |||
| 26 | From persons (3-6) | 106.9 | |||
| 27 | From the rest of the world (5-10) | 11.3 | |||
| 28 | Current surplus of government enterprises (1-10) | −6.5 | |||
| 12 | Government current expenditures and net saving | 5,537.7 | 29 | Government current receipts | 5,537.7 |
| Account 5. Foreign Transactions Current Account | |||||
|---|---|---|---|---|---|
| Line | Line | ||||
| 1 | Exports of goods and services (1-29) | 2510.2 | 13 | Imports of goods and services (1-30) | 3148.5 |
| 2 | Income receipts from the rest of the world | 1106.2 | 14 | Income payments to the rest of the world | 838.3 |
| 3 | Wage and salary receipts (3-13) | 6.7 | 15 | Wage and salary payments (1-4) | 19.6 |
| 4 | Income receipts on assets | 1099.6 | 16 | Income payments on assets | 818.8 |
| 5 | Interest (2-21 and 3-20 and 4-20) | 247.5 | 17 | Interest (2-2 and 3-4 and 4-7) | 468.4 |
| 6 | Dividends (2-22) | 1049.7 | 18 | Dividends (2-3) | 203.5 |
| 7 | Reinvested earnings on U.S. direct investment abroad (2-23) | −197.7 | 19 | Reinvested earnings on foreign direct investment in the United States (2-4) | 146.9 |
| 8 | Current taxes, contributions for government social insurance, and transfer receipts from the rest of the world | 155.4 | 20 | Current taxes and transfer payments to the rest of the world | 294.5 |
| 9 | To persons (3-7) | 111.7 | 21 | From persons (3-7) | 200.6 |
| 10 | To government (4-17 plus 4-20 plus 4-27) | 44.2 | 22 | From government (4-5 plus 4-6) | 81.4 |
| 11 | To business (2-8) | −0.5 | 23 | From business (2-8 and 2-14) | 12.5 |
| 24 | Balance on current account, NIPAs (7-1) | −509.5 | |||
| 12 | Current receipts from the rest of the world | 3771.8 | 25 | Current payments to the rest of the world and balance on current account, NIPAs | 3771.8 |
| Account 6. Domestic Capital Account | |||||
|---|---|---|---|---|---|
| Line | Line | ||||
| 1 | Gross domestic investment | 4,315.5 | 10 | Net saving | 503.8 |
| 2 | Private fixed investment (1-21) | 3,573.6 | 11 | Personal saving (3-8) | 1,210.4 |
| 3 | Government fixed investment (1-31) | 687.2 | 12 | Undistributed corporate profits with IVA and CCAdj (2-17) | 542.3 |
| 4 | Change in private inventories (1-27) | 54.7 | 13 | Net government saving (4-9) | −1,248.9 |
| 5 | Capital account transactions (net) | −2.8 | 14 | Plus: Consumption of fixed capital (1-11) | 3,291.4 |
| 6 | Transfer payments for catastrophic losses (7-3) | −3.2 | 15 | Private | 2,725.8 |
| 7 | Other capital account transactions (7-4) | 0.4 | 16 | Government | 565.7 |
| 8 | Net lending or net borrowing (-), NIPAs (7-5) | −506.7 | 17 | General government | 490.3 |
| 18 | Government enterprises | 75.4 | |||
| 19 | Equals: Gross saving | 3,795.2 | |||
| 20 | Statistical discrepancy (1-13) | 10.8 | |||
| 9 | Gross domestic investment, capital account transactions (net), and net lending, NIPAs | 3,806.0 | 21 | Gross saving and statistical discrepancy | 3,806.0 |
| Account 7. Foreign Transactions Capital Account | |||||
|---|---|---|---|---|---|
| Line | Line | ||||
| 2 | Capital account transactions (net) | −2.8 | |||
| 3 | Transfer payments for catastrophic losses (6-6) | −3.2 | |||
| 4 | Other capital account transactions (6-7) | 0.4 | |||
| 5 | Net lending or net borrowing (-), NIPAs (6-8) | −506.7 | |||
| 1 | Balance on current account, NIPAs (5-24) | −509.5 | 6 | Capital account transactions (net) and net lending, NIPAs | −509.5 |
- CCAdj
- Capital consumption adjustment
- IVA
- Inventory valuation adjustment
- NIPAs
- National Income and Product Accounts
Note. The seven summary accounts constitute a double-entry accounting system in which each of the entries in a summary account appears again in that account or in one of the other summary accounts. The numbers in parentheses indicate these “counterentries.” In some cases, an entry may be equal to another entry in the summary accounts. For example, supplements to wages and salaries appears in account 1, line 5 and in account 3, line 14. In other cases, an entry may be equal to a combination of other entries (or of parts of other entries). For example, for private enterprise interest payments (account 2, line 2), the counterentry includes parts of private enterprise interest receipts (account 2, line 21), of personal interest income (account 3, line 20), of government interest receipts (account 4, line 22), and of interest payments to the rest of the world (account 5, line 17).
| Line | 2014 | 2015 | 2016 | 2017 | 2018 | Seasonally adjusted at annual rates | |||||
|---|---|---|---|---|---|---|---|---|---|---|---|
| 2018 | 2019 | ||||||||||
| I | II | III | IV | I | |||||||
| Production in the United States: | |||||||||||
| 1 | Gross domestic product (GDP) | 2.5 | 2.9 | 1.6 | 2.4 | 2.9 | 2.6 | 3.5 | 2.9 | 1.1 | 3.1 |
| 2 | Gross domestic income (GDI) | 3.2 | 2.7 | 0.8 | 2.1 | 2.5 | 4.7 | 0.7 | 3.3 | 0.8 | 3.2 |
| 3 | Average of GDP and GDI1 | 2.9 | 2.8 | 1.2 | 2.2 | 2.7 | 3.6 | 2.1 | 3.1 | 0.9 | 3.1 |
| 4 | Net domestic product2 | 2.5 | 2.9 | 1.5 | 2.3 | 3.0 | 2.5 | 3.6 | 2.9 | 0.7 | 3.1 |
| 5 | Net domestic income2 | 3.3 | 2.6 | 0.5 | 2.0 | 2.5 | 5.0 | 0.3 | 3.3 | 0.3 | 3.2 |
| Production by labor and capital supplied by U.S. residents: | |||||||||||
| 6 | Gross national product | 2.5 | 2.8 | 1.6 | 2.5 | 3.0 | 2.8 | 3.1 | 3.0 | 0.7 | 3.1 |
| 7 | Gross national income | 3.2 | 2.5 | 0.8 | 2.2 | 2.6 | 4.9 | 0.4 | 3.3 | 0.4 | 3.2 |
| 8 | Net national product2 | 2.5 | 2.8 | 1.4 | 2.5 | 3.1 | 2.9 | 3.1 | 3.0 | 0.2 | 3.1 |
| Final expenditures by U.S. residents: | |||||||||||
| 9 | Gross domestic purchases | 2.7 | 3.6 | 1.9 | 2.6 | 3.1 | 2.5 | 2.8 | 4.9 | 1.4 | 2.3 |
| 10 | Final sales to domestic purchasers3 | 2.8 | 3.3 | 2.4 | 2.5 | 3.0 | 2.4 | 4.0 | 2.8 | 1.3 | 1.8 |
| 11 | Final sales to private domestic purchasers4 | 3.7 | 3.6 | 2.6 | 2.9 | 3.3 | 2.4 | 4.2 | 2.9 | 1.7 | 1.6 |
| Purchasing power of income:5 | |||||||||||
| 12 | Command-basis gross domestic product | 2.7 | 3.7 | 2.0 | 2.4 | 3.0 | 2.0 | 4.4 | 2.8 | 1.4 | 3.1 |
| 13 | Command-basis net domestic product2 | 2.7 | 3.8 | 1.9 | 2.3 | 3.0 | 1.9 | 4.6 | 2.7 | 1.0 | 3.1 |
| 14 | Command-basis gross national product | 2.7 | 3.5 | 1.9 | 2.5 | 3.1 | 2.2 | 4.0 | 2.8 | 1.0 | 3.2 |
| 15 | Command-basis net national product2 | 2.7 | 3.7 | 1.8 | 2.4 | 3.1 | 2.2 | 4.1 | 2.8 | 0.6 | 3.1 |
| After-tax income received by the personal sector: | |||||||||||
| 16 | Disposable personal income | 4.1 | 4.1 | 1.8 | 2.9 | 4.0 | 6.9 | 2.7 | 3.3 | 2.8 | 4.4 |
- The arithmetic average of gross domestic product and of gross domestic income, deflated by the implicit price deflator for GDP.
- In this table, the net measures are the corresponding gross measures excluding the depreciation of fixed assets as measured by the consumption of fixed capital.
- Gross domestic purchases excluding change in private inventories.
- Final sales to domestic purchasers less government consumption expenditures and gross investment.
- The command-basis estimates (lines 12-15) measure the purchasing power of the income generated by the sale of goods and services produced; they reflect gains or losses in real income resulting from changes in the terms of trade for exports and imports. For more detail on the command-basis measures, see NIPA tables 1.8.3 and 1.8.6.
| Line | 2014 | 2015 | 2016 | 2017 | 2018 | Seasonally adjusted at annual rates | |||||
|---|---|---|---|---|---|---|---|---|---|---|---|
| 2018 | 2019 | ||||||||||
| I | II | III | IV | I | |||||||
| Production in the United States: | |||||||||||
| 1 | Gross domestic product (GDP) | 16,912.0 | 17,403.8 | 17,688.9 | 18,108.1 | 18,638.2 | 18,438.3 | 18,598.1 | 18,732.7 | 18,783.5 | 18,927.3 |
| 2 | Gross domestic income (GDI) | 17,191.1 | 17,647.3 | 17,794.7 | 18,170.8 | 18,628.4 | 18,519.7 | 18,552.7 | 18,703.1 | 18,739.3 | 18,886.7 |
| 3 | Average of GDP and GDI1 | 17,051.5 | 17,525.6 | 17,741.8 | 18,139.4 | 18,633.3 | 18,479.0 | 18,575.4 | 18,717.9 | 18,761.4 | 18,907.0 |
| 4 | Net domestic product2 | 14,187.8 | 14,605.5 | 14,818.4 | 15,165.1 | 15,612.6 | 15,447.4 | 15,584.7 | 15,695.7 | 15,722.5 | 15,841.7 |
| 5 | Net domestic income2 | 14,466.7 | 14,848.7 | 14,924.0 | 15,227.6 | 15,602.8 | 15,528.6 | 15,539.4 | 15,666.1 | 15,678.4 | 15,801.1 |
| Production by labor and capital supplied by U.S. residents: | |||||||||||
| 6 | Gross national product | 17,146.5 | 17,624.7 | 17,902.2 | 18,344.6 | 18,897.8 | 18,711.6 | 18,855.9 | 18,995.6 | 19,028.0 | 19,173.6 |
| 7 | Gross national income | 17,425.6 | 17,868.2 | 18,008.1 | 18,407.3 | 18,888.0 | 18,793.2 | 18,810.5 | 18,965.9 | 18,983.8 | 19,132.9 |
| 8 | Net national product2 | 14,422.3 | 14,826.4 | 15,031.8 | 15,401.6 | 15,872.1 | 15,720.6 | 15,842.4 | 15,958.5 | 15,966.9 | 16,087.9 |
| Final expenditures by U.S. residents: | |||||||||||
| 9 | Gross domestic purchases | 17,487.7 | 18,114.2 | 18,455.9 | 18,931.2 | 19,523.2 | 19,290.7 | 19,422.1 | 19,656.0 | 19,724.2 | 19,836.1 |
| 10 | Final sales to domestic purchasers3 | 17,398.0 | 17,977.1 | 18,415.5 | 18,882.3 | 19,456.8 | 19,233.5 | 19,421.1 | 19,554.0 | 19,618.8 | 19,705.7 |
| 11 | Final sales to private domestic purchasers4 | 14,366.5 | 14,888.0 | 15,270.8 | 15,716.4 | 16,237.8 | 16,036.7 | 16,204.4 | 16,320.9 | 16,389.2 | 16,452.7 |
| Purchasing power of income:5 | |||||||||||
| 12 | Command-basis gross domestic product | 16,994.0 | 17,616.5 | 17,963.2 | 18,389.0 | 18,942.3 | 18,709.5 | 18,910.2 | 19,040.2 | 19,106.1 | 19,252.3 |
| 13 | Command-basis net domestic product2 | 14,269.6 | 14,817.6 | 15,092.4 | 15,445.7 | 15,916.2 | 15,718.5 | 15,896.6 | 16,002.9 | 16,044.3 | 16,165.6 |
| 14 | Command-basis gross national product | 17,227.8 | 17,833.7 | 18,172.6 | 18,618.2 | 19,188.9 | 18,970.2 | 19,155.2 | 19,290.2 | 19,337.0 | 19,487.6 |
| 15 | Command-basis net national product2 | 14,503.4 | 15,035.0 | 15,301.8 | 15,674.8 | 16,162.9 | 15,979.2 | 16,141.6 | 16,252.9 | 16,275.3 | 16,401.1 |
| After-tax income received by the personal sector: | |||||||||||
| 16 | Disposable personal income | 12,844.3 | 13,372.7 | 13,608.4 | 14,002.8 | 14,556.2 | 14,400.3 | 14,495.9 | 14,613.3 | 14,715.2 | 14,875.8 |
- The arithmetic average of gross domestic product and of gross domestic income, deflated by the implicit price deflator for GDP.
- In this table, the net measures are the corresponding gross measures excluding the depreciation of fixed assets as measured by the consumption of fixed capital.
- Gross domestic purchases excluding change in private inventories.
- Final sales to domestic purchasers less government consumption expenditures and gross investment.
- The command-basis estimates (lines 12-15) measure the purchasing power of the income generated by the sale of goods and services produced; they reflect gains or losses in real income resulting from changes in the terms of trade for exports and imports. For more detail on the command-basis measures, see NIPA tables 1.8.3 and 1.8.6.
| Line | 2014 | 2015 | 2016 | 2017 | 2018 | Seasonally adjusted at annual rates | |||||
|---|---|---|---|---|---|---|---|---|---|---|---|
| 2018 | 2019 | ||||||||||
| I | II | III | IV | I | |||||||
| Production in the United States: | |||||||||||
| 1 | Gross domestic product (GDP) | 17,527.3 | 18,224.8 | 18,715.0 | 19,519.4 | 20,580.2 | 20,163.2 | 20,510.2 | 20,749.8 | 20,897.8 | 21,098.8 |
| 2 | Gross domestic income (GDI) | 17,816.4 | 18,479.7 | 18,827.0 | 19,587.0 | 20,569.4 | 20,252.2 | 20,460.1 | 20,716.9 | 20,848.6 | 21,053.5 |
| 3 | Average of GDP and GDI1 | 17,671.8 | 18,352.2 | 18,771.0 | 19,553.2 | 20,574.8 | 20,207.7 | 20,485.1 | 20,733.3 | 20,873.2 | 21,076.2 |
| 4 | Net domestic product2 | 14,712.2 | 15,308.3 | 15,723.5 | 16,398.0 | 17,288.8 | 16,942.9 | 17,238.5 | 17,433.9 | 17,539.7 | 17,696.7 |
| 5 | Net domestic income2 | 15,001.4 | 15,563.2 | 15,835.4 | 16,465.5 | 17,278.0 | 17,032.0 | 17,188.4 | 17,401.1 | 17,490.5 | 17,651.4 |
| Production by labor and capital supplied by U.S. residents: | |||||||||||
| 6 | Gross national product | 17,768.3 | 18,449.4 | 18,933.2 | 19,762.7 | 20,848.1 | 20,444.1 | 20,775.8 | 21,022.1 | 21,150.4 | 21,356.7 |
| 7 | Gross national income | 18,057.5 | 18,704.3 | 19,045.2 | 19,830.3 | 20,837.3 | 20,533.2 | 20,725.7 | 20,989.3 | 21,101.2 | 21,311.4 |
| 8 | Net national product2 | 14,953.3 | 15,532.9 | 15,941.6 | 16,641.3 | 17,556.7 | 17,223.9 | 17,504.2 | 17,706.3 | 17,792.3 | 17,954.5 |
| 9 | National income3 | 15,242.5 | 15,787.9 | 16,053.6 | 16,708.8 | 17,545.9 | 17,313.0 | 17,454.0 | 17,673.5 | 17,743.1 | 17,909.3 |
| Final expenditures by U.S. residents: | |||||||||||
| 10 | Gross domestic purchases | 18,034.9 | 18,744.6 | 19,233.8 | 20,094.8 | 21,218.4 | 20,792.1 | 21,078.6 | 21,421.1 | 21,582.0 | 21,732.7 |
| 11 | Final sales to domestic purchasers4 | 17,951.0 | 18,612.8 | 19,206.8 | 20,064.6 | 21,163.7 | 20,750.7 | 21,088.5 | 21,333.8 | 21,481.9 | 21,619.4 |
| 12 | Final sales to private domestic purchasers5 | 14,783.0 | 15,375.5 | 15,900.1 | 16,652.6 | 17,572.2 | 17,229.3 | 17,511.4 | 17,711.2 | 17,837.1 | 17,936.3 |
| After-tax income received by the personal sector: | |||||||||||
| 13 | Disposable personal income | 13,207.7 | 13,780.0 | 14,165.1 | 14,833.0 | 15,741.5 | 15,465.4 | 15,653.3 | 15,842.0 | 16,005.4 | 16,196.0 |
- The arithmetic average of gross domestic product and of gross domestic income.
- In this table, the net measures are the corresponding gross measures excluding the depreciation of fixed assets as measured by the consumption of fixed capital.
- Equals gross national income less the depreciation of fixed assets as measured by the consumption of fixed capital.
- Equals gross domestic purchases less change in private inventories.
- Final sales to domestic purchasers less government consumption expenditures and gross investment.
- As part of the 2018 comprehensive update of the NIPAs, the typical period for revision during annual updates was expanded to 5 years. See Pamela A. Kelly, Stephanie H. McCulla, and David B. Wasshausen, “Improved Estimates of the National Income and Product Accounts: Results of the 2018 Comprehensive Update,” Survey of Current Business 98 (September 2018).
- For more information on the source data used to prepare the successive vintages of the NIPA estimates, see the chapters for each component in BEA's NIPA Handbook: Concepts and Methods of the U.S. National Income and Product Accounts, which is available on BEA's website, and see Alyssa E. Holdren, “Gross Domestic Product and Gross Domestic Income: Revisions and Source Data,” Survey 94 (June 2014).
- Certain federal government agencies were shut down from December 22, 2018, through January 25, 2019, due to a lapse in appropriations; as a result, the annual revision of Census Bureau construction data will be released in September 2019. BEA incorporated construction data that were revised as part of the Census Bureau's previous monthly updates that impacted periods that were not open for revision in the NIPAs at that time.
- For more information on the new historical index, see Ana Aizcorbe, David M. Byrne, and Daniel E. Sichel, “Getting Smart About Phones: New Price Indexes and the Allocation of Spending Between Devices and Services Plans in Personal Expenditures,” NBER Working Paper No. 25645, March 2019.
- See Ana Aizcorbe, David Byrne and Dan Sichel, March 2019.
- See Eric Bryda, C. Omar Kebbeh, and Ted Peck, “Annual Update of the U.S. International Transactions Accounts,” Survey 99 (July 2019).