
U.S. International Services
Trade in Services in 2018 and Services Supplied Through Affiliates in 2017
This article highlights statistics on international services that the Bureau of Economic Analysis (BEA) releases annually. These statistics cover both U.S. international trade in services and services supplied by majority-owned U.S. and foreign affiliates of multinational enterprises (MNEs).1 Trade in services refers to exports and imports of services—that is, services traded between U.S. residents and nonresidents—that are included in the broader set of U.S. international transactions accounts (ITAs) released by BEA. Services supplied through affiliates refers to services supplied by MNEs through the channel of direct investment. This set of statistics covers services supplied by majority-owned foreign affiliates of U.S. companies to foreign residents, both in the host country and in other foreign markets, and services supplied by majority-owned U.S. affiliates of foreign companies to U.S. residents.2
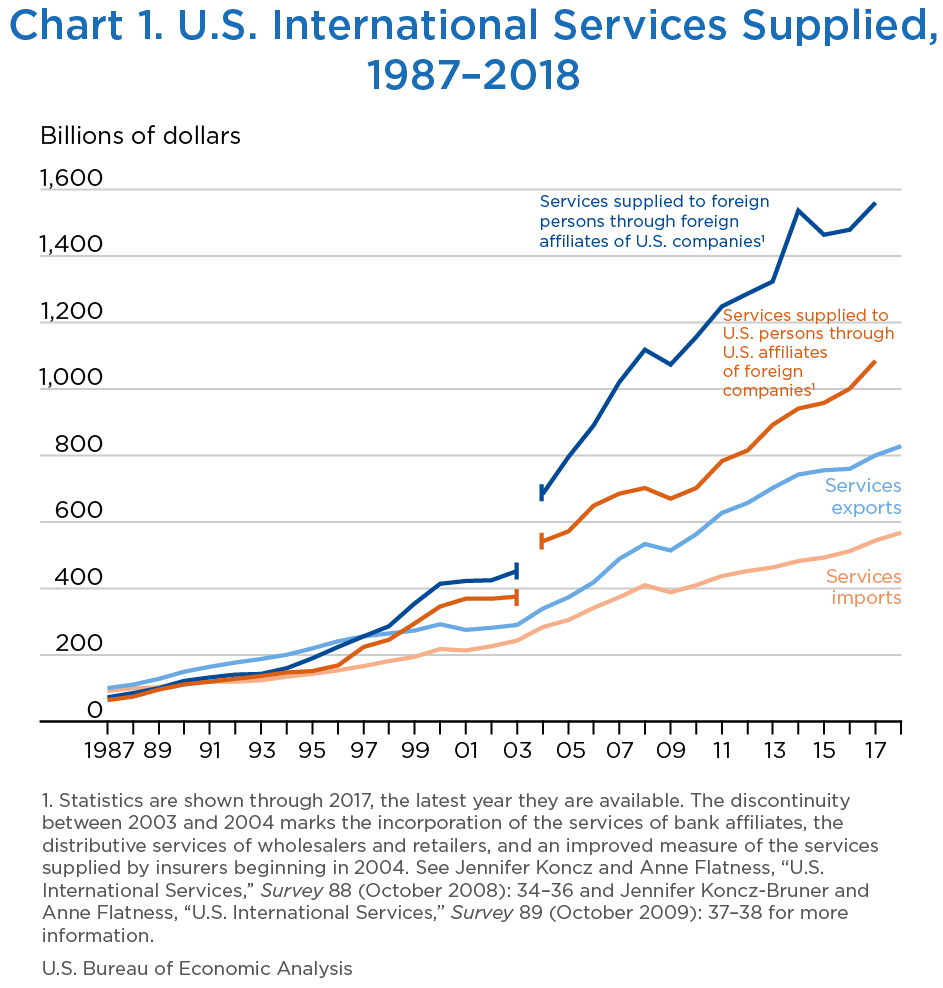
Because of the importance of physical proximity to customers in the delivery of certain types of services, many MNEs serve foreign markets partly or wholly through their affiliates located in, or close to, the markets they serve rather than through trade. As in recent years, about two-thirds of the services provided internationally both by and to the United States in 2017—the latest year for which statistics on services supplied through affiliates are available—were through affiliates (table A and chart 1).3
| Services supplied to foreign persons | Services supplied to U.S. persons | |||||
|---|---|---|---|---|---|---|
| Total | Through trade (U.S. exports) |
Through foreign affiliates of U.S. companies | Total | Through trade (U.S. imports) |
Through U.S. affiliates of foreign companies | |
| Billions of dollars | ||||||
| 2016 | 2,235.4 | 758.4 | 1,477.0 | 1,511.0 | 511.6 | 999.4 |
| 2017 | 2,357.3 | 799.0 | 1,558.4 | 1,626.5 | 543.9 | 1,082.6 |
| 2018 | n.a. | 827.0 | n.a. | n.a. | 567.3 | n.a. |
| Percent change from preceding year | ||||||
| 2016 | 0.8 | 0.4 | 1.0 | 4.2 | 4.0 | 4.3 |
| 2017 | 5.5 | 5.3 | 5.5 | 7.6 | 6.3 | 8.3 |
| 2018 | n.a. | 3.5 | n.a. | n.a. | 4.3 | n.a. |
- n.a.
- Not available
[Click chart to expand]
In 2017, total services supplied by the United States to foreign persons through both trade and foreign affiliates of U.S. companies was $2.4 trillion, and total services supplied to the United States from foreign persons through both trade and U.S. affiliates of foreign companies was $1.6 trillion. The difference between total services supplied to foreign persons and supplied to U.S. persons was $730.8 billion. Total services supplied to foreign persons increased $121.9 billion, or 5 percent, in 2017 after increasing $17.3 billion, or 1 percent, in 2016. Total services supplied to U.S. persons increased $115.5 billion, or 8 percent, in 2017 after increasing $61.2 billion, or 4 percent, in 2016.
In 2018, U.S. exports of services were $827.0 billion, and U.S. imports of services were $567.3 billion (chart 1), resulting in a services trade surplus of $259.7 billion. The United States accounted for an estimated 14 percent of the world’s services exports and for an estimated 10 percent of the world’s services imports in 2018.4 In comparison, in 2018, the United States accounted for 15 percent of world gross domestic product (GDP).5
Exports of services increased $28.0 billion, or 4 percent, in 2018 after increasing $40.5 billion, or 5 percent, in 2017. The largest increase in exports occurred in other business services, primarily professional and management consulting services. Although U.S. exports grew, the U.S. share of worldwide exports was estimated to fall slightly.
Imports of services increased $23.4 billion, or 4 percent, in 2018 after increasing $32.3 billion, or 6 percent, in 2017. The largest increases in imports occurred in “travel (for all purposes including education)” (henceforth “travel”), primarily other personal travel, and in other business services, primarily professional and management consulting services.6 The increase in travel abroad by U.S. residents and in imports of other business services continues the upward trend in these categories since 2009 after the Great Recession, coinciding with expanding U.S. economic activity over this period. The U.S. share of worldwide services imports was estimated to fall slightly in 2018.
In 2017, services supplied to foreign markets through foreign affiliates of U.S. MNEs were $1.6 trillion, up $81.4 billion, or 6 percent, from 2016, reflecting increases in several industries including finance and insurance; professional, scientific, and technical services; and real estate and rental and leasing.
In 2017, services supplied to the United States through U.S. affiliates of foreign MNEs were $1.1 trillion, up $83.3 billion, or 8 percent, from 2016, reflecting increases in services supplied by U.S. affiliates of foreign MNEs in various industries including other industries, particularly in transportation and warehousing and accommodation and food services, and in professional, scientific, and technical services.
The remainder of this article includes a “Services Spotlight” highlighting new information on services by mode of supply, discussions of U.S. trade in services in 2018, U.S. trade in information and communications technology (ICT) and potentially ICT-enabled services (presenting an alternate aggregation of part of the trade in services statistics) in 2018, services supplied through affiliates in 2017, and future enhancements to BEA’s international services statistics.
Trade in services can be defined based on their characteristics as intangible economic outputs, or functionally, as arising from productive activities that change the condition of the consumer or that facilitate the exchange of products and financial assets. The statistics in this article are consistent with statistics published in table 3.1 of the ITAs.7
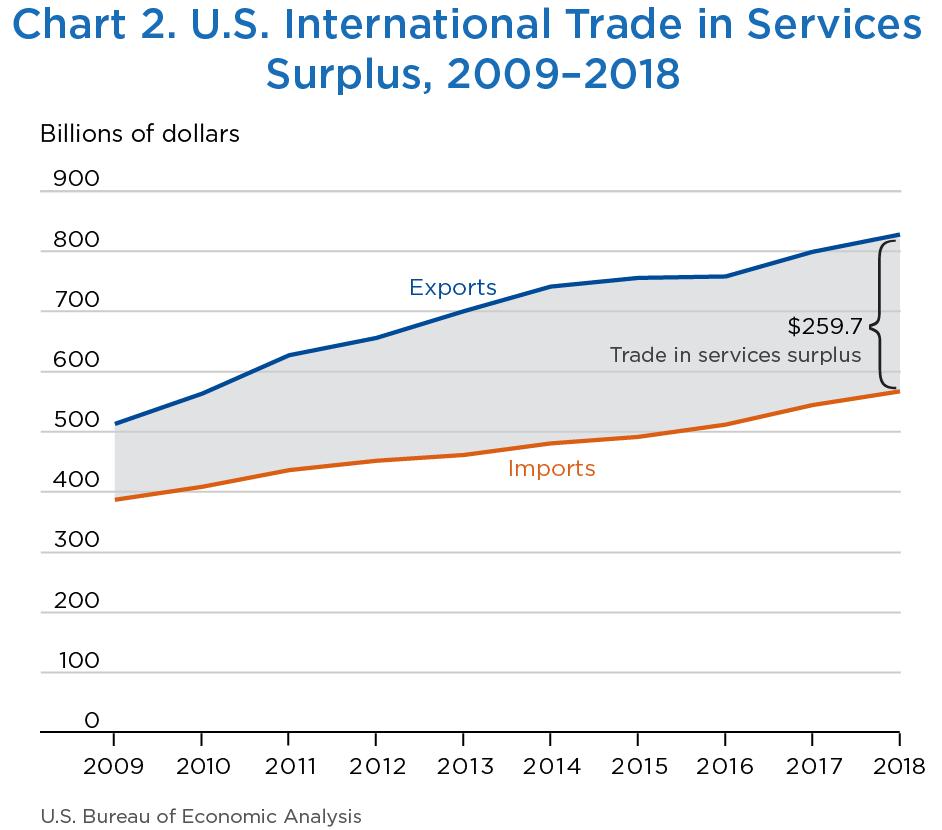
In 2018, U.S. exports of services were $827.0 billion, and U.S. imports of services were $567.3 billion, resulting in a services trade surplus of $259.7 billion (chart 2). Historically, the United States has recorded a surplus on trade in services, as the value of exports has exceeded the value of imports. The surplus increased $4.6 billion in 2018 after increasing $8.3 billion in 2017. The increase in 2018 reflected a $28.0 billion, or 4 percent, increase in exports of services and a $23.4 billion, or 4 percent, increase in imports of services.
[Click chart to expand]
The remainder of this section discusses trade in services in 2018 by service type, by trading partner, and by affiliation. Tables that accompany this article and others that are available on BEA’s website provide additional detail broken out in these dimensions and as combinations of these dimensions.
Trade by service type
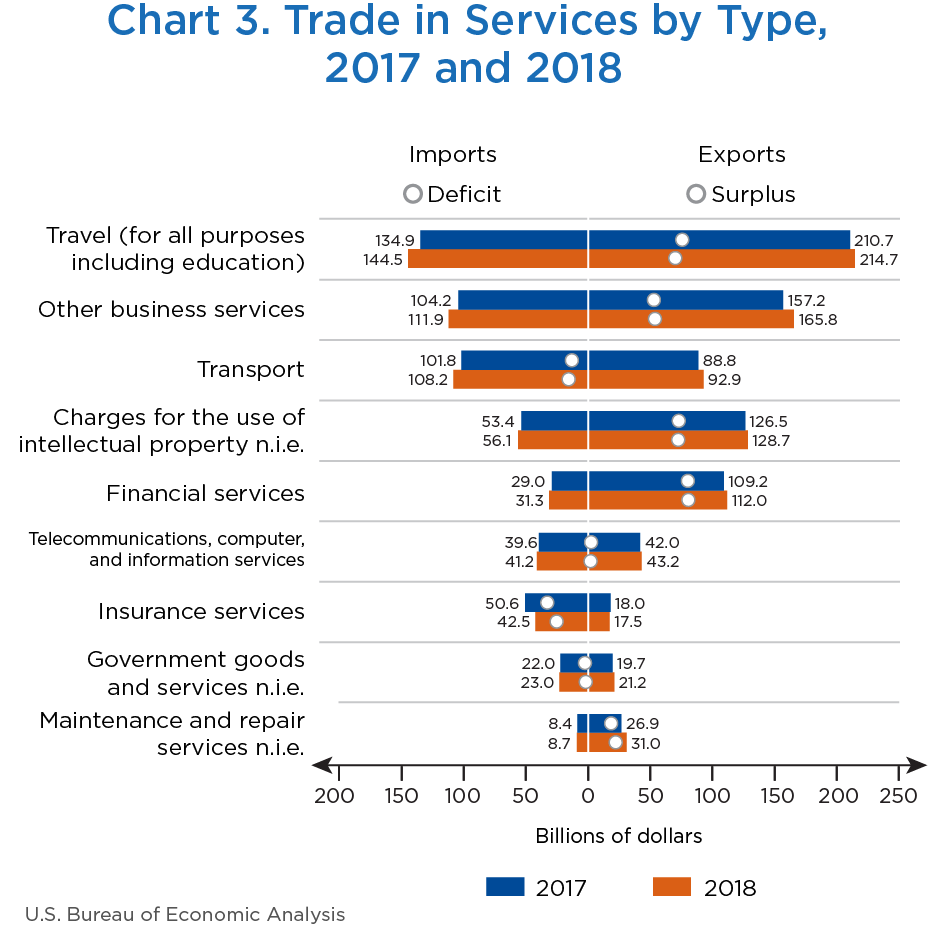
BEA classifies services trade transactions into nine major service-type categories. In 2018, travel accounted for the largest share of both exports and imports (table B). Six of the nine major service types recorded surpluses, while three recorded deficits (chart 3). Surpluses were largest in financial services, charges for the use of intellectual property, and travel.
[Click chart to expand]
| Total services | Maintenance and repair services n.i.e. | Transport | Travel (for all purposes including education)2 |
Insurance services | Financial services | Charges for the use of intellectual property n.i.e. | Telecommunications, computer, and information services | Other business services | Government goods and services n.i.e. | |
|---|---|---|---|---|---|---|---|---|---|---|
| Exports | ||||||||||
| All countries | 826,980 | 30,968 | 92,852 | 214,680 | 17,466 | 112,015 | 128,748 | 43,196 | 165,821 | 21,235 |
| Total for the top 10 countries1 | 459,085 | 11,435 | 48,868 | 110,067 | 9,978 | 73,771 | 78,047 | 24,083 | 99,889 | 2,947 |
| United Kingdom | 74,064 | 2,687 | 8,224 | 12,889 | 3,132 | 16,993 | 10,886 | 4,683 | 14,111 | 459 |
| Canada | 64,057 | 1,338 | 8,017 | 18,164 | 1,828 | 7,236 | 8,538 | 4,313 | 14,215 | 409 |
| China | 57,140 | 1,863 | 5,328 | 32,068 | 335 | 4,171 | 8,467 | 945 | 3,532 | 430 |
| Ireland | 48,483 | 491 | 649 | 1,845 | 370 | 3,482 | 15,519 | 2,504 | 23,611 | 12 |
| Japan | 45,197 | 1,496 | 9,810 | 10,283 | 2,777 | 3,722 | 6,606 | 2,066 | 7,662 | 775 |
| Switzerland | 39,298 | 206 | 2,352 | 1,722 | 194 | 1,465 | 14,074 | 1,591 | 17,631 | 62 |
| Germany | 34,764 | 1,788 | 5,281 | 6,575 | 330 | 3,130 | 6,443 | 1,670 | 9,366 | 180 |
| United Kingdom Islands, Caribbean3 | 34,028 | 7 | 68 | 195 | 263 | 29,818 | 181 | 113 | 3,382 | 1 |
| Mexico | 33,804 | 778 | 4,202 | 17,884 | 421 | 1,566 | 3,895 | 1,508 | 3,120 | 430 |
| Brazil | 28,250 | 782 | 4,937 | 8,440 | 328 | 2,188 | 3,439 | 4,689 | 3,259 | 189 |
| Other countries | 367,895 | 19,533 | 43,983 | 104,613 | 7,488 | 38,243 | 50,702 | 19,113 | 65,932 | 18,288 |
| Imports | ||||||||||
| All countries | 567,322 | 8,718 | 108,202 | 144,463 | 42,485 | 31,298 | 56,117 | 41,190 | 111,874 | 22,975 |
| Total for the top 10 countries1 | 303,429 | (D) | 46,119 | 58,249 | 34,310 | 18,301 | 39,607 | 30,952 | 60,141 | (D) |
| United Kingdom | 60,717 | 1,948 | 9,269 | 11,106 | 2,905 | 10,464 | 5,325 | 2,883 | 16,087 | 730 |
| Canada | 35,859 | 1,673 | 5,535 | 9,164 | 679 | 2,424 | 2,347 | 4,993 | 8,822 | 224 |
| Japan | 34,727 | 100 | 9,186 | 3,586 | 320 | 1,641 | 11,813 | 338 | 3,415 | 4,330 |
| Germany | 33,613 | 178 | 8,937 | 3,632 | 2,079 | 655 | 7,039 | 1,498 | 5,730 | 3,865 |
| India | 29,586 | 19 | 650 | 3,262 | 81 | 473 | 1,227 | 15,335 | 8,483 | 56 |
| Mexico | 25,799 | 238 | 3,370 | 17,375 | 7 | 400 | 917 | 948 | 2,408 | 135 |
| Bermuda | 24,046 | (*) | 1,193 | 392 | 21,856 | 228 | 1 | 193 | 175 | 9 |
| Switzerland | 21,533 | (D) | 2,328 | 1,340 | 3,435 | 623 | 5,236 | 639 | 6,354 | (D) |
| Ireland | 19,042 | 25 | 964 | 2,759 | 2,394 | 425 | 3,019 | 3,518 | 5,926 | 12 |
| France | 18,507 | 462 | 4,687 | 5,631 | 554 | 969 | 2,685 | 608 | 2,741 | 170 |
| Other countries | 263,893 | (D) | 62,084 | 86,214 | 8,175 | 12,997 | 16,510 | 10,238 | 51,733 | (D) |
- (*)
- Transactions between zero and $500,000.
- n.i.e.
- Not included elsewhere
- (D)
- Suppressed to avoid the disclosure of data of individual companies.
- The rank is based on the total value of services exports or imports in 2018.
- All travel purposes include (1) business travel, including expenditures by border, seasonal, and other short-term workers and (2) personal travel, including health-related and education-related travel.
- United Kingdom Islands, Caribbean comprises the British Virgin Islands, the Cayman Islands, Montserrat, and the Turks and Caicos Islands.
These three categories have been the largest contributors to the services surplus since 2006; 2018 was the second year in which the surplus on financial services, which was $80.7 billion in 2018, was the largest. The surplus in financial services partly reflects the fact the United States is a major hub for global securities trading. In 2018, U.S. stock exchanges accounted for over half (55 percent) of the value of equities traded on all the world’s exchanges.8 The surplus in charges for the use of intellectual property partly reflects the high level of research and development (R&D) performed in the United States. In 2015 (the most recent year for which statistics are available), the United States accounted for 26 percent of R&D performed worldwide.9
U.S. exports of services were $827.0 billion in 2018. Of the nine major service types, the top four—travel (26 percent of the total), other business services (20 percent), charges for the use of intellectual property (16 percent), and financial services (14 percent)—accounted for three-fourths of total exports of services. U.S. imports of services were $567.3 billion. The top four major service types—travel (25 percent of the total), other business services (20 percent), transport (19 percent), and charges for the use of intellectual property (10 percent)—accounted for nearly three-fourths of total imports of services.
In 2018, exports increased for all but one of the major service types, but four service types accounted for almost three-quarters of the aggregate increase: other business services, maintenance and repair, travel, and transport. Exports of insurance services decreased slightly.
- Other business services. Exports of other business services have increased every year since 2001. Exports increased $8.6 billion, or 5 percent, to $165.8 billion in 2018, led by an increase in professional and management consulting services, mainly business and management consulting and public relations services. Increases in exports to Canada and the United Kingdom combined accounted for more than half of the increase in other business services exports.
- Maintenance and repair services. Exports of maintenance and repair services increased $4.1 billion, or 15 percent, to $31.0 billion. Increases in exports to Taiwan and France combined accounted for more than a quarter of the increase in maintenance and repair services.
- Travel. Exports of travel services increased $4.0 billion, or 2 percent, to $214.7 billion, led by an increase in education-related travel. Increases in exports to India and Canada combined accounted for over half of the increase in total travel exports.
- Transport. Exports of transport services increased $4.0 billion, or 5 percent, to $92.9 billion. The increase partly reflected an increase in air transport services, led by air freight services. The increase in exports of air freight services reflects an increase in U.S. goods exports in 2018. Increases in exports to Canada and the United Kingdom together accounted for a third of the increase in total transport exports.
Imports increased in eight of the nine major service types. The largest increase was in travel, followed by other business services and transport. Insurance services decreased significantly.
- Travel. Imports of travel services increased $9.6 billion, or 7 percent, to $144.5 billion. The increase mostly reflected an increase in other personal travel. By country, the largest increases in travel were in imports from the United Kingdom, Italy, and Canada, which combined accounted for more than one-quarter of the increase.
- Other business services. Imports of other business services increased $7.7 billion, or 7 percent, to $111.9 billion. An increase in professional and management consulting services, mainly business and management consulting and public relations services, accounted for most of the increase. Imports from the United Kingdom, Singapore, and India combined accounted for more than half of the increase in other business services.
- Transport. Imports of transport services increased $6.4 billion, or 6 percent, to $108.2 billion, mostly reflecting an increase in air transport services. The increase in air transport mainly reflected an increase in air passenger transport services. Imports from Germany, the United Kingdom, and the Republic of Korea combined accounted for more than one-quarter of the increase in transport services.
- Insurance services. Imports of insurance services decreased $8.1 billion, or 16 percent, to $42.5 billion, mainly reflecting a decrease in reinsurance services. In response to certain provisions of the 2017 Tax Cuts and Jobs Act, many U.S.-domiciled insurance companies terminated intracompany reinsurance agreements with foreign affiliates. Imports from Switzerland and Ireland combined accounted for nearly all of the decrease in insurance services.
Trade by partner country
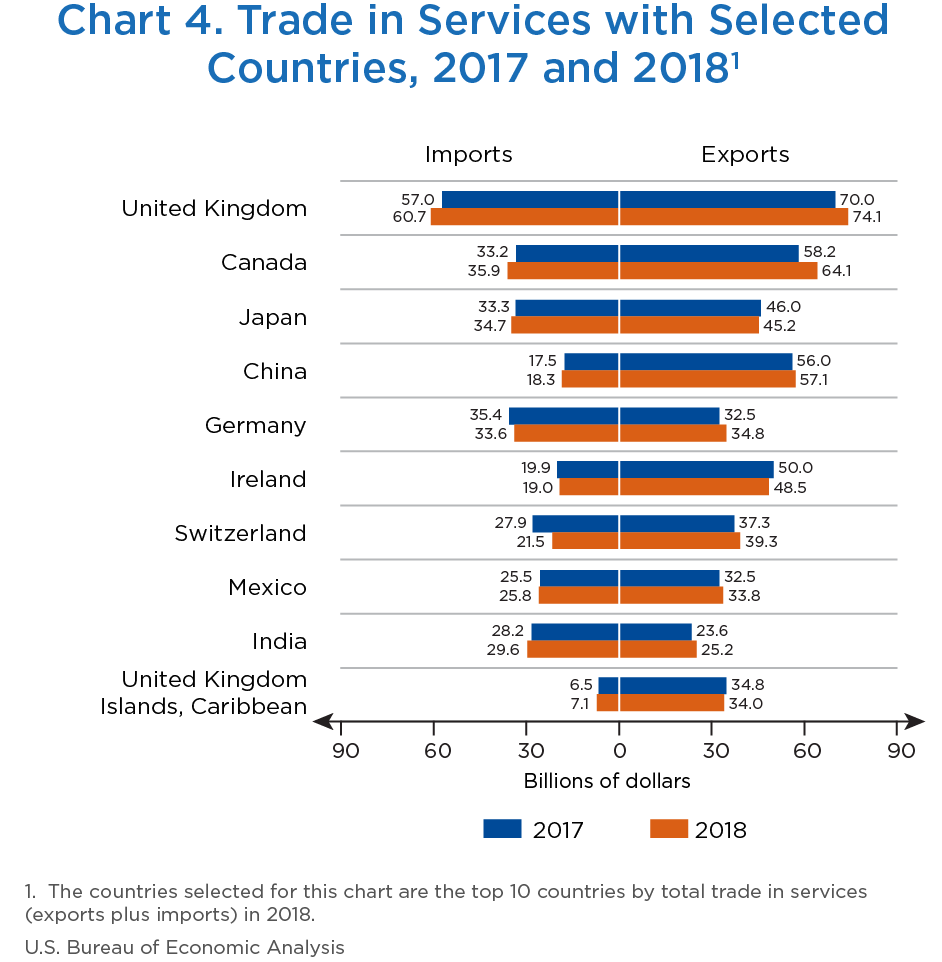
The top 10 trading partners of the United States based on total trade (exports plus imports) for 2018 are shown in chart 4. The top 10 trading partners accounted for 55 percent of services exports and 50 percent of services imports. The United Kingdom remained the largest trading partner for services in 2018; it was both the largest market for U.S. exports and the largest source for U.S. imports (table B). The top categories of exports to the United Kingdom were financial services and other business services, mainly professional and management consulting services, while the top categories for imports were other business services, mainly professional and management consulting services, and travel. Canada was the second-largest trading partner; it was both the second-largest market for U.S. exports and the second-largest source for U.S. imports. For imports, it jumped ahead of Germany and Japan in 2018. The top categories of exports to Canada were travel and other business services, primarily professional and management consulting services, while the top import categories were travel and other business services, primarily professional and management consulting services and technical, trade-related, and other business services.
[Click chart to expand]
Exports to the top 10 trading partners (the countries shown in chart 4) accounted for $15.0 billion, or 54 percent, of the $28.0 billion increase in total services exports in 2018. Exports to Canada, the United Kingdom, and Germany increased the most. Among the notable increases in exports were the following:
- Canada. Exports to Canada increased $5.8 billion, or 10 percent, to $64.1 billion, primarily reflecting an increase of $3.1 billion in other business services, primarily professional and management consulting services. The increase in professional and management consulting services reflects increases in advertising services and in business and management consulting and public relations services.
- United Kingdom. Exports to the United Kingdom increased $4.1 billion, or 6 percent, to $74.1 billion, primarily reflecting increases in other business services and in charges for the use of intellectual property. Other business services increased $1.7 billion, mainly reflecting an increase in professional and management consulting services, primarily in business and management consulting and public relations services. Charges for the use of intellectual property increased $0.9 billion, largely reflecting an increase in charges associated with computer software.
- Germany. Exports to Germany increased $2.2 billion, or 7 percent, to $34.8 billion, mainly reflecting an increase of $1.0 billion in other business services, primarily professional and management consulting services. The increase in professional and management consulting services was largely due to an increase in business and management consulting and public relations services.
- Hong Kong. Exports to Hong Kong (not shown in chart 4) increased $2.2 billion, or 21 percent, to $12.8 billion, mainly reflecting an increase of $1.6 billion in charges for the use of intellectual property. The increase in charges for the use of intellectual property primarily reflected an increase in charges associated with industrial processes.
- Switzerland. Exports to Switzerland increased $2.0 billion, or 5 percent, to $39.3 billion in 2018, largely reflecting a $1.5 billion increase in charges for the use of intellectual property, which was more than accounted for by increases in charges associated with industrial processes and in charges associated with trademarks.
Imports from the top 10 trading partners accounted for $1.9 billion, or 8 percent, of the $23.4 billion increase in total services imports in 2018 (chart 4). While the increase in imports was widespread across many partner countries, imports from the United Kingdom, Canada, and Singapore (not shown in chart 4) increased the most. Among the notable changes in imports are the following:
- United Kingdom. Imports from the United Kingdom increased $3.7 billion, or 6 percent, to $60.7 billion, mainly reflecting increases in other business services and travel. Imports of other business services increased $1.6 billion, mostly reflecting an increase in professional and management consulting services, primarily business and management consulting and public relations services. Imports of travel increased $1.0 billion, largely reflecting increases in other business travel and other personal travel.
- Canada. Imports from Canada increased $2.7 billion, or 8 percent, to $35.9 billion, mainly reflecting increases of $0.6 billion each in travel, in charges for the use of intellectual property, and in telecommunications, computer, and information services. The increase in imports of travel mostly reflected increases in other business travel and other personal travel. The increase in imports of charges for the use of intellectual property reflected increases in charges associated with audio-visual and related products and charges associated with industrial processes. The increase in imports of telecommunications, computer, and information services mostly reflected an increase in computer services.
- Switzerland. Imports from Switzerland decreased $6.3 billion, or 23 percent, to $21.5 billion, mostly reflecting a $5.1 billion decrease in insurance services, which was more than accounted for by a decrease in reinsurance services.
Trade by affiliation
U.S. services trade includes trade between unaffiliated parties and trade within MNEs (affiliated trade). Affiliated trade accounted for 30 percent of U.S. services exports and 29 percent of U.S. services imports in 2018 (table C). Unaffiliated services exports grew at nearly twice the rate of affiliated services exports in 2018. Unaffiliated services imports grew at more than twice the rate of affiliated services imports. U.S. parents’ imports from their foreign affiliates increased, while U.S. affiliates’ imports from their foreign groups declined. The decline in U.S. affiliates’ imports from their foreign groups is the first since 2009. This is primarily due to a decline in U.S. affiliates’ imports from their foreign groups of charges associated with intellectual property, primarily charges associated with industrial processes, and of other business services, primarily business and management consulting and public relations services and technical, trade-related and other business services.
| Millions of dollars | Percent change from preceding year | Percent of total trade in services | ||
|---|---|---|---|---|
| 2017 | 2018 | 2018 | 2018 | |
| Exports of services | ||||
| Total exports of services | 798,957 | 826,980 | 3.5 | ..... |
| Unaffiliated | 553,505 | 576,471 | 4.1 | 69.7 |
| Affiliated | 245,452 | 250,510 | 2.1 | 30.3 |
| U.S. parents’ exports to their foreign affiliates | 196,574 | 200,175 | 1.8 | 24.2 |
| U.S. affiliates’ exports to their foreign parent groups | 48,878 | 50,335 | 3.0 | 6.1 |
| Imports of services | ||||
| Total imports of services | 543,880 | 567,322 | 4.3 | ..... |
| Unaffiliated | 381,847 | 402,226 | 5.3 | 70.9 |
| Affiliated | 162,034 | 165,096 | 1.9 | 29.1 |
| U.S. parents’ imports from their foreign affiliates | 106,848 | 112,543 | 5.3 | 19.8 |
| U.S. affiliates’ imports from their foreign parent groups | 55,185 | 52,553 | −4.8 | 9.3 |
BEA’s statistics on trade in ICT and potentially ICT-enabled services complement BEA’s standard presentation of international trade in services statistics by providing insight into the extent to which ICT may be used to facilitate trade in services. ICT services facilitate information processing and communication; ICT-enabled services are services delivered over ICT networks.10 BEA’s statistics on ICT services include three categories of services from BEA’s published statistics on international trade in services: telecommunications services, computer services, and charges for the use of intellectual property associated with computer software.
It is not possible to precisely identify services trade that is ICT-enabled because BEA collects data on trade in services by category based on the Extended Balance of Payments Services Classification (EBOPS 2010), which is based on the type of service traded and not on the mode of delivery.11 BEA, therefore, measures a related but more broadly defined concept of potentially ICT-enabled services, which include services that can predominantly be delivered remotely over ICT networks, without identifying the services that are delivered over ICT networks. BEA’s statistics on potentially ICT-enabled services are composed of BEA’s published statistics on international trade in five major categories: insurance services; financial services; charges for the use of intellectual property; telecommunications, computer, and information services; and certain other services included in other business services. Potentially ICT-enabled services include ICT services.
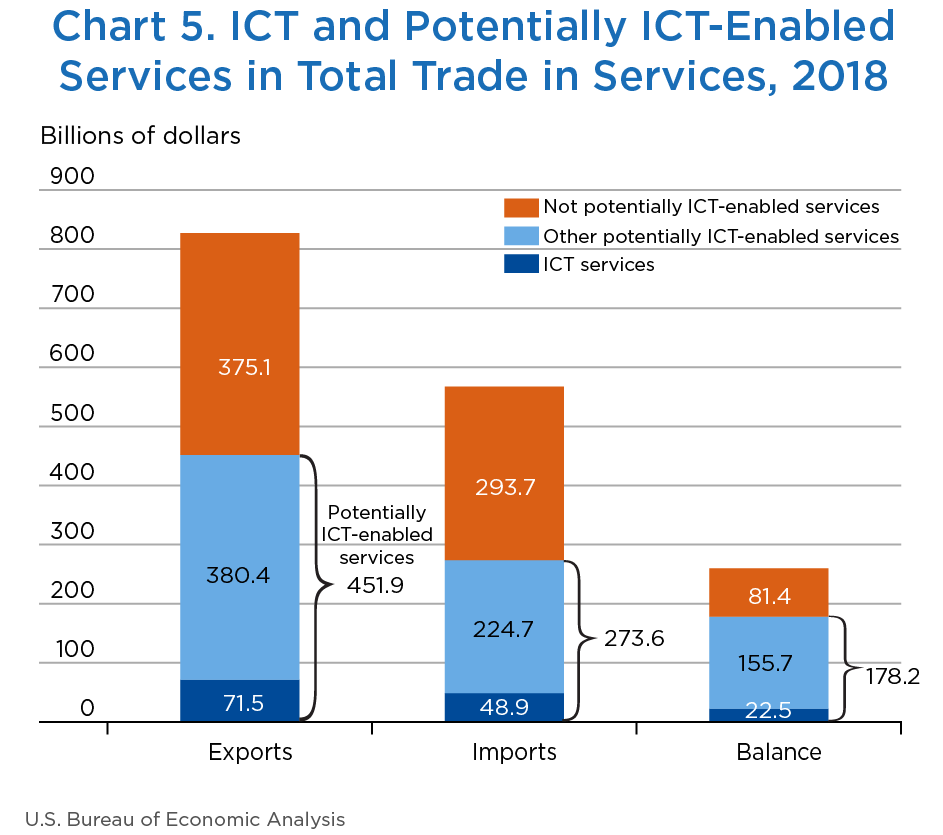
In 2018, U.S. exports of ICT services were $71.5 billion, and U.S. imports of ICT services were $48.9 billion, resulting in an ICT services trade surplus of $22.5 billion (chart 5). The surplus decreased $0.5 billion from 2017, as imports of ICT services increased $1.9 billion, and exports of ICT services increased $1.3 billion. U.S. exports of potentially ICT-enabled services were $451.9 billion, and U.S. imports of potentially ICT-enabled services were $273.6 billion, resulting in a potentially ICT-enabled services trade surplus of $178.2 billion. The surplus increased $7.3 billion from 2017, as exports of potentially ICT-enabled services increased $12.9 billion, and imports of potentially ICT-enabled services increased $5.6 billion. Potentially ICT-enabled services accounted for 55 percent of total services exports and 48 percent of imports in 2018. Both shares decreased slightly from their 2017 values of 55 and 49 percent, respectively. The remainder of this section discusses trade in potentially ICT-enabled services in 2018 by service type, by trading partner, and by affiliation. Tables that accompany this article and that are available on BEA’s website provide additional detail on trade in ICT and potentially ICT-enabled services.
[Click chart to expand]
Trade by service type
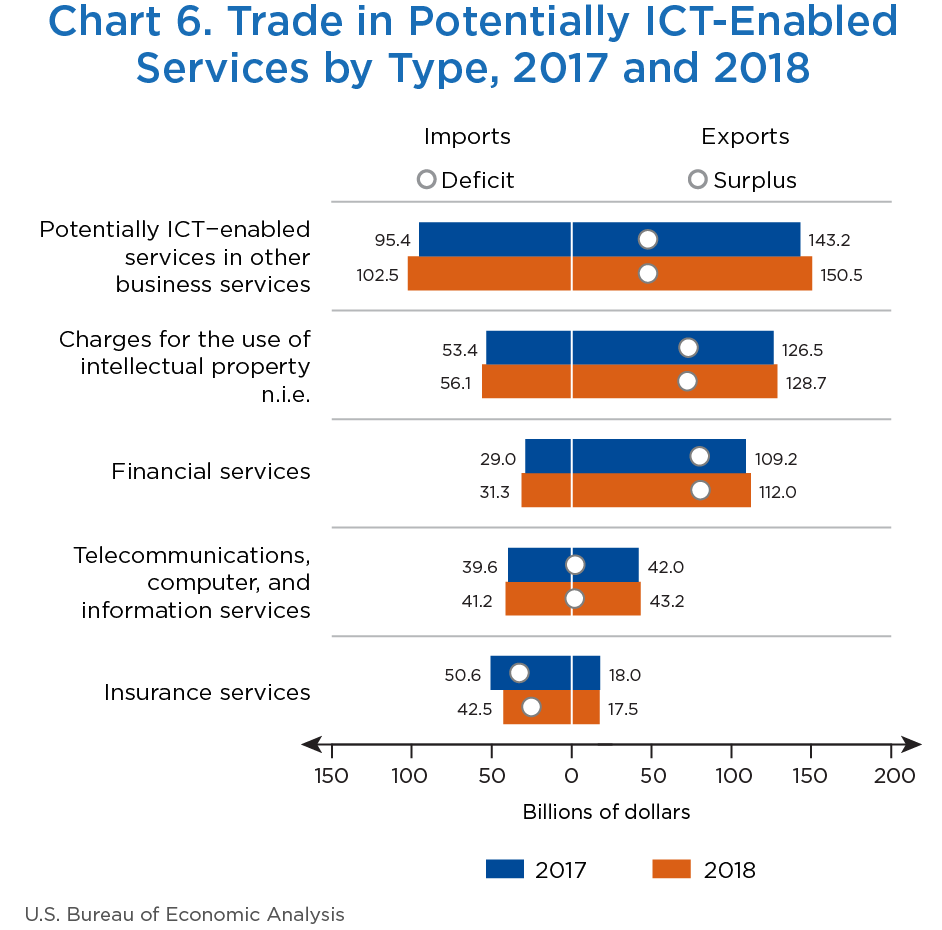
In 2018, potentially ICT-enabled services in other business services, primarily professional and management consulting services and research and development services, accounted for the largest share of exports (33 percent) and imports (37 percent) (chart 6). Exports in four of the major categories exceeded imports, with the largest surplus occurring in financial services. The combined surpluses in these four categories more than offset a deficit in insurance services.
Exports and imports increased in four of the five major categories in 2018; exports and imports of insurance services decreased. The largest increases for exports were in potentially ICT-enabled services in other business services, which increased $7.2 billion to $150.5 billion, and in financial services, which increased $2.8 billion to $112.0 billion. The largest increases for imports were in potentially ICT-enabled services in other business services, which increased $7.1 billion to $102.5 billion, and in charges for the use of intellectual property, which increased $2.7 billion to $56.1 billion. These increases more than offset a substantial drop in insurance services imports, which decreased $8.1 billion to $42.5 billion.
[Click chart to expand]
Trade by partner country
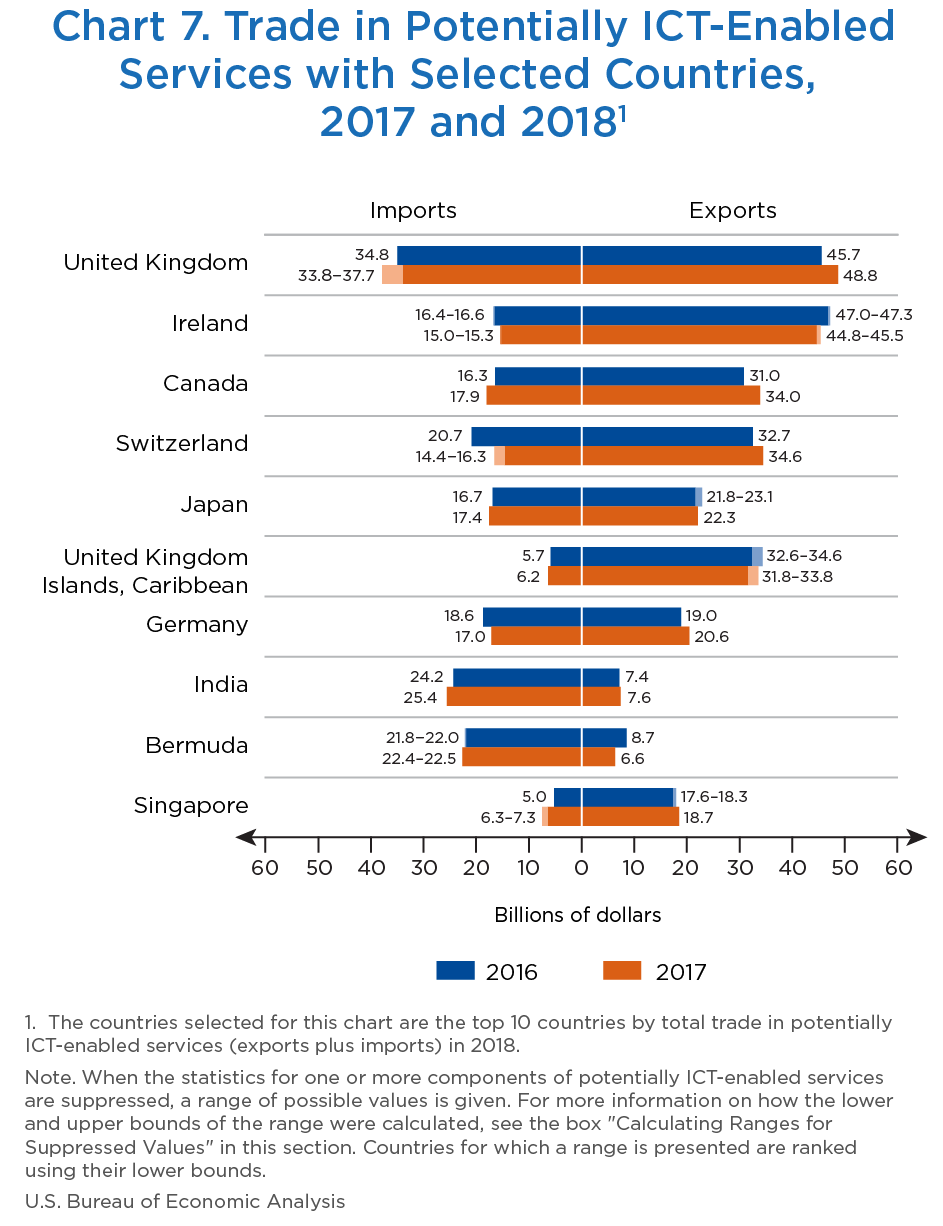
Exports and imports in potentially ICT-enabled services for the top 10 trading-partner countries by total trade (exports plus imports) are shown in chart 7.
In 2018, the United Kingdom was the top trading partner in potentially ICT-enabled services. Exports to the United Kingdom were $48.8 billion, led by exports of financial services and potentially ICT-enabled services in other business services, and imports from the United Kingdom were between $33.8 and $37.7 billion (see “Calculating Ranges for Suppressed Values”),12 led by potentially ICT-enabled services in other business services. The United Kingdom took over as the top recipient country for exports of potentially ICT-enabled services in 2018, replacing Ireland, which held the top spot in 2017; the United Kingdom was also the top source of imports. India was the second largest source of imports of potentially ICT-enabled services in 2018; more than half of its imports were in computer services.
[Click chart to expand]
The largest increases in 2018 in potentially ICT-enabled services exports were in exports to the United Kingdom and Canada. Exports to the United Kingdom increased $3.2 billion, or 7 percent, to $48.8 billion, and exports to Canada increased $3.0 billion, or 10 percent, to $34.0 billion; the largest increases for both countries were in potentially ICT-enabled services in other business services, mostly professional and management consulting services. The largest increase in 2018 in potentially ICT-enabled services imports was in imports from Canada, which increased $1.6 billion, or 10 percent, to $17.9 billion. The increase in imports from Canada, combined with increases in imports from other countries, particularly countries in Asia and Pacific, exceeded a large decrease in imports from Switzerland of between $4.4 and $6.3 billion, or 21 to 30 percent, to between $14.4 and $16.3 billion.
Trade by affiliation
Affiliated trade accounted for 54 percent of exports of potentially ICT-enabled services and for 58 percent of imports of potentially ICT-enabled services in 2018 (table D). These shares are much higher than the affiliated shares of total services exports and imports, highlighting the importance of providing services over ICT networks for intrafirm trade. Unaffiliated exports of potentially ICT-enabled services increased 4 percent in 2018, and affiliated exports increased 2 percent. Unaffiliated imports of potentially ICT-enabled services and affiliated services imports both increased 2 percent; the latter reflects a 5 percent increase in imports by U.S. parents from their foreign affiliates and a 4 percent decrease in imports by U.S. affiliates from their foreign parent groups.
| Millions of dollars | Percent change from preceding year | Percent of total trade in potentially ICT-enabled services | ||
|---|---|---|---|---|
| 2017 | 2018 | 2018 | 2018 | |
| Exports of potentially ICT-enabled services | ||||
| Total exports of potentially ICT-enabled services | 438,992 | 451,884 | 2.9 | ..... |
| Unaffiliated | 200,264 | 208,303 | 4.0 | 46.1 |
| Affiliated | 238,728 | 243,581 | 2.0 | 53.9 |
| U.S. parents’ exports to their foreign affiliates | 191,702 | 195,511 | 2.0 | 43.3 |
| U.S. affiliates’ exports to their foreign parent groups | 47,026 | 48,070 | 2.2 | 10.6 |
| Imports of potentially ICT-enabled services | ||||
| Total imports of potentially ICT-enabled services | 268,045 | 273,637 | 2.1 | ..... |
| Unaffiliated | 113,848 | 115,839 | 1.7 | 42.3 |
| Affiliated | 154,197 | 157,798 | 2.3 | 57.7 |
| U.S. parents’ imports from their foreign affiliates | 102,191 | 107,788 | 5.5 | 39.4 |
| U.S. affiliates’ imports from their foreign parent groups | 52,006 | 50,010 | −3.8 | 18.3 |
- ICT
- Information and communications technology
U.S. international services delivered via the channel of direct investment consist of (1) services supplied to foreign residents by foreign affiliates of U.S. MNEs and (2) services supplied to U.S. residents by U.S. affiliates of foreign MNEs. The statistics in this article are consistent with services supplied statistics published in BEA’s statistics on the activities of multinational enterprises (“AMNE statistics”), except that the AMNE statistics primarily focus on services supplied to all customers regardless of the residency of the customer.
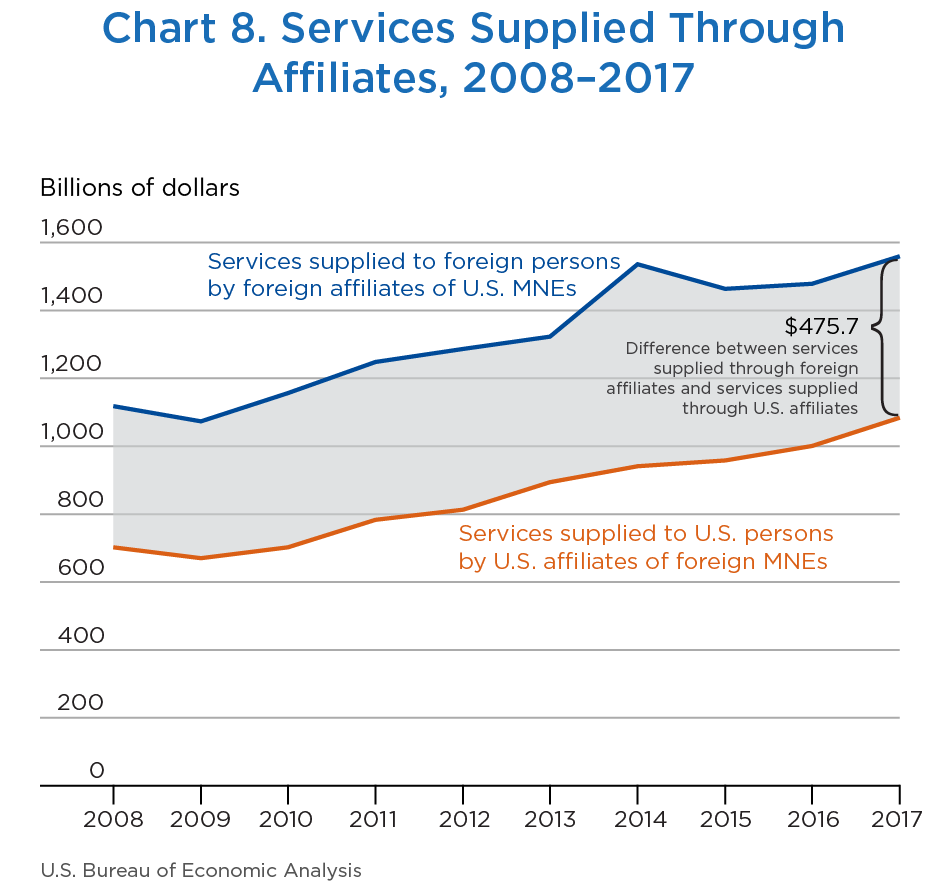
In 2017, the latest year for which statistics are available, services supplied by U.S. MNEs to foreign markets through their affiliates increased $81.4 billion, or 6 percent, to $1.6 trillion (chart 8). Services supplied by foreign MNEs to the U.S. market through their U.S. affiliates increased $83.3 billion, or 8 percent, to $1.1 trillion. The difference between international services supplied through affiliates to foreign markets and the services supplied to the U.S. market was $475.7 billion in 2017, compared with $477.6 billion in 2016.
[Click chart to expand]
The remainder of this section discusses services supplied through affiliates in 2017 by industry of affiliate, by country of affiliate or country of ultimate beneficial owner (UBO), and by destination.13 Tables that accompany this article and that are available on BEA’s website provide additional detail on services provided by affiliates of MNEs, along with detail cross classified by country and industry.
Services supplied through affiliates by industry
In the international services statistics, BEA classifies services supplied through affiliates into nine major industry categories (table E). In 2017, the broad category other industries (primarily transportation and warehousing; administration, support, and waste management; and accommodation and food services) accounted for the largest share (19 percent) of the services supplied by U.S. MNEs to foreign markets through their foreign affiliates. Four other industries—professional, scientific, and technical services; information; finance and insurance; and wholesale trade—accounted for a significant share of the total. Together, these five industry categories accounted for 83 percent of services supplied by U.S. MNEs through foreign affiliates.
| All industries | Mining | Manufac- turing |
Wholesale trade | Retail trade | Information | Finance and insurance | Real estate and rental and leasing | Professional, scientific, and technical services | Other Industries | |
|---|---|---|---|---|---|---|---|---|---|---|
| Services supplied to foreign persons by U.S. MNEs through their majority-owned foreign affiliates by country of the foreign affiliate |
||||||||||
| All countries | 1,558,359 | 37,300 | 31,725 | 237,003 | 111,889 | 259,624 | 249,745 | 78,342 | 259,853 | 292,878 |
| Total for the top 10 countries | 1,005,558 | 13,175 | 23,241 | 165,964 | 76,165 | 185,073 | 141,931 | 56,823 | 163,770 | 179,417 |
| United Kingdom | 247,226 | 5,655 | 6,588 | 20,207 | 23,094 | 39,002 | 62,952 | 7,245 | 40,245 | 42,238 |
| Ireland | 142,114 | (D) | (D) | 7,229 | 261 | 68,405 | 9,871 | 18,228 | 28,863 | (D) |
| Canada | 122,147 | 4,090 | 2,241 | 18,965 | 24,898 | 9,105 | 11,225 | 4,288 | 15,329 | 32,006 |
| Singapore | 82,634 | 675 | (D) | 26,939 | 2,661 | 13,722 | 14,708 | (D) | 9,207 | (D) |
| Switzerland | 81,219 | (D) | 377 | 28,323 | 4,188 | 6,390 | 1,927 | (D) | 18,174 | (D) |
| Netherlands | 76,797 | 1,394 | 4,036 | 13,347 | 1,844 | 17,175 | 7,425 | 3,068 | 9,108 | 19,401 |
| Japan | 74,614 | 0 | 281 | 13,809 | 4,975 | 9,953 | 21,500 | 1,088 | 14,031 | 8,978 |
| Germany | 71,603 | 721 | 2,614 | 13,092 | 6,825 | 12,247 | 5,232 | 2,349 | 12,468 | 16,055 |
| China | 54,874 | 324 | 1,819 | 15,584 | 5,203 | 2,990 | 2,357 | 1,418 | 7,158 | 18,021 |
| France | 52,330 | 113 | 2,166 | 8,468 | 2,216 | 6,084 | 4,734 | 2,061 | 9,188 | 17,300 |
| Other countries | 552,801 | 24,125 | 8,484 | 71,040 | 35,724 | 74,551 | 107,814 | 21,519 | 96,082 | 113,461 |
| Services supplied to U.S. persons by foreign MNEs through their majority-owned U.S. affiliates by country of the UBO |
||||||||||
| All countries | 1,082,632 | 27,981 | 86,635 | 201,898 | 75,443 | 137,387 | 180,065 | 26,118 | 135,382 | 211,724 |
| Total for the top 10 countries | 883,680 | 17,949 | 78,736 | 157,499 | 66,319 | 118,952 | 156,765 | 19,407 | 108,552 | 159,500 |
| Japan | 165,121 | (D) | 16,559 | 64,266 | 7,248 | (D) | 25,787 | 1,937 | 5,195 | (D) |
| United Kingdom | 152,627 | (D) | 10,773 | 9,437 | 11,419 | 25,179 | 20,680 | 6,894 | 19,363 | (D) |
| Germany | 147,510 | (D) | 27,871 | 16,322 | 9,267 | (D) | 16,050 | 1,574 | 9,211 | (D) |
| Canada | 126,167 | 1,199 | 1,944 | 16,758 | 19,963 | 8,465 | 34,940 | 6,914 | 11,264 | 24,720 |
| France | 99,427 | (D) | 4,626 | 9,134 | 703 | 1,788 | 18,475 | (D) | 39,519 | (D) |
| Netherlands | 66,216 | (D) | 5,778 | 7,868 | 16,894 | (D) | (D) | 1,227 | 2,365 | (D) |
| Switzerland | 48,368 | (D) | 7,878 | 3,713 | 707 | (D) | 17,174 | 724 | 577 | (D) |
| Ireland | 28,191 | (D) | 2,546 | 1,815 | (D) | 208 | (D) | 17 | 20,585 | (D) |
| Bermuda | 26,169 | (D) | 413 | 6,290 | (D) | 606 | 8,659 | 57 | 91 | (D) |
| Korea, Republic of | 23,885 | (D) | 348 | 21,896 | (D) | 203 | 279 | (D) | 382 | (D) |
| Other countries | 198,952 | 10,032 | 7,899 | 44,399 | 9,124 | 18,435 | 23,300 | 6,711 | 26,830 | 52,224 |
- (D)
- Suppressed to avoid the disclosure of data of individual companies.
- MNE
- Multinational enterprises
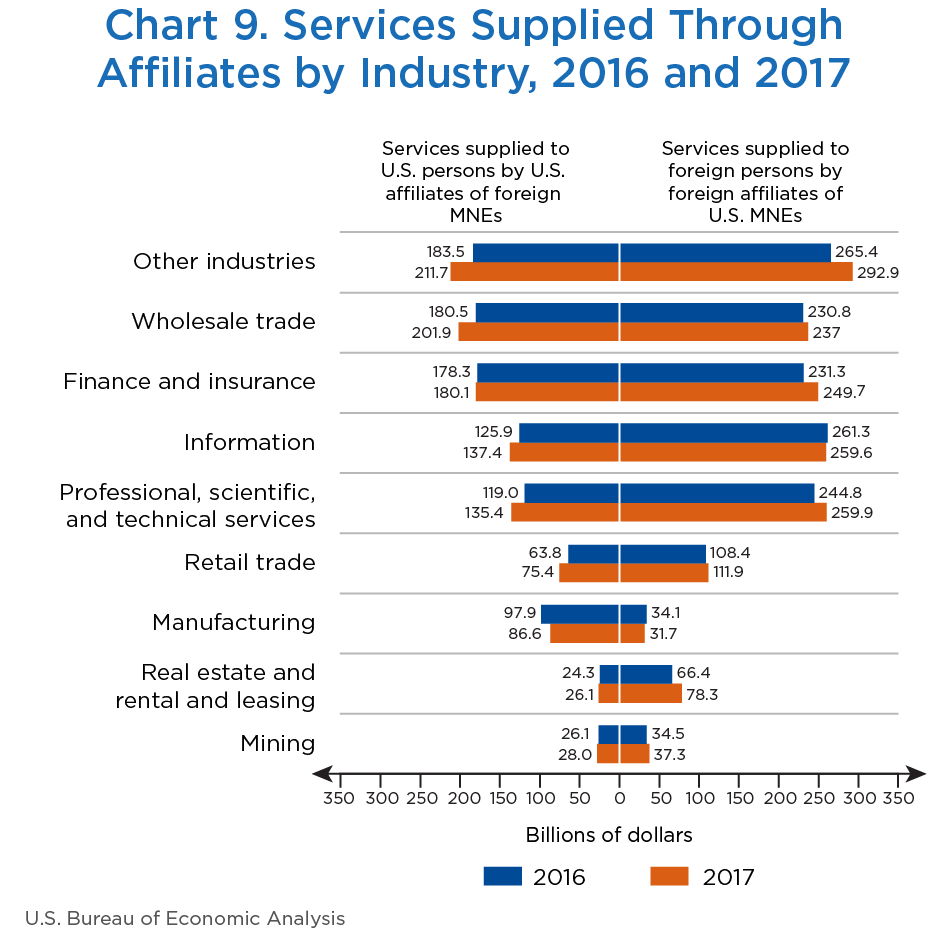
In 2017, increases in seven of the nine major industry categories contributed to the $81.4 billion aggregate increase in services supplied by U.S. MNEs to foreign residents through foreign affiliates. The largest increase was for affiliates in other industries and in finance and insurance (chart 9). Among the notable changes in services supplied through foreign affiliates were the following:
- Other industries increased $27.5 billion to $292.9 billion. There were large increases in administration, support, and waste management and in transportation and warehousing.
- Finance and insurance increased $18.4 billion to $249.7 billion. Almost all of the increase was in nondepository finance.
- Professional, scientific, and technical services14 increased $15.1 billion to $259.9 billion. About two-thirds of the increase was in European affiliates.
- Real estate and rental and leasing increased $11.9 billion to $78.3 billion. Most of the increase was in rental and leasing.
- Wholesale trade15 increased $6.2 billion to $237.0 billion. The increase was mainly in other wholesale trade, which includes wholesale trade in machinery, equipment, and supplies, and in other goods, particularly in the distribution of nondurable goods. These increases were partly offset by decreases in motor vehicles and petroleum wholesaling.
- Retail trade increased $3.5 billion to $111.9 billion. The increase was largest for nonstore retailers, such as online merchants, and for affiliates in other retail trade, which includes motor vehicle and parts dealers and gasoline stations.
- Mining increased $2.8 billion to $37.3 billion. The increase was primarily in mining industries other than oil and gas extraction.
- Manufacturing decreased $2.3 billion to $31.7 billion, mostly reflecting decreases among machinery and transportation equipment affiliates. The decrease was partly accounted for by decreases in services supplied by affiliates in Europe, especially France.
[Click chart to expand]
In 2017, increases in eight of the nine major industry categories contributed to the $83.3 billion aggregate increase in services supplied by foreign MNEs to U.S. residents through their U.S. affiliates. The largest increase was in other industries (chart 9). The only major industry to decrease was manufacturing. Among the notable changes in services supplied through foreign affiliates were the following:
- Other industries increased $28.2 billion to $211.7 billion. The largest increases were in transportation and warehousing and in accommodation and food services.
- Wholesale trade increased $21.4 billion to $201.9 billion, reflecting large increases in petroleum and petroleum products and in professional and commercial equipment and supplies.
- Professional, scientific, and technical services increased $16.4 billion to $135.4 billion. More than half of the increase was in architectural, engineering, and related services. Services supplied also increased substantially in computer systems design and related services.
- Retail trade increased $11.6 billion to $75.4 billion. Most of the increase was in food and beverage stores.
- Information increased $11.5 billion to $137.4 billion. More than 40 percent of the increase was in telecommunications.
- Manufacturing decreased $11.2 billion to $86.6 billion, reflecting decreases in wood products, transportation equipment, and machinery.
Services supplied through affiliates by country
In 2017, the top country for services supplied to foreign markets by foreign affiliates of U.S. MNEs was the United Kingdom, followed by Ireland and Canada (table E). For services supplied to the U.S. market through U.S. affiliates, the top UBO country was Japan, followed by the United Kingdom and Germany.
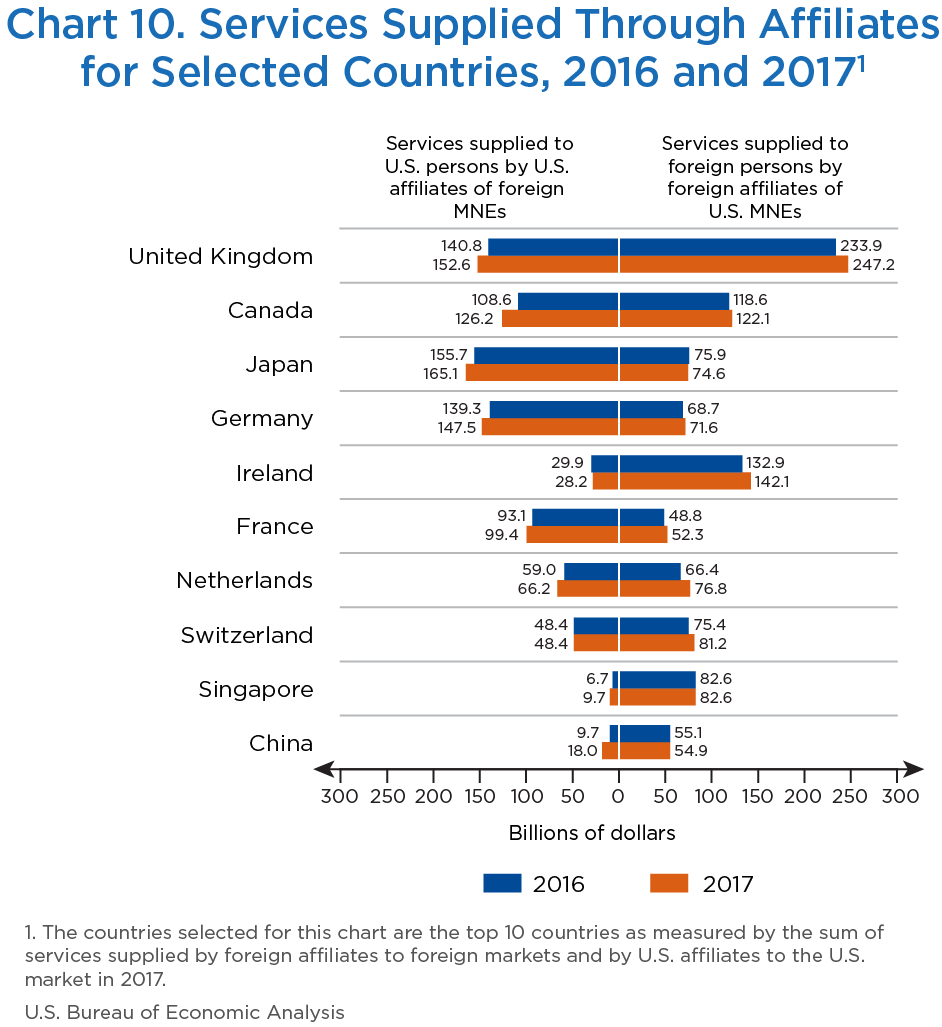
Increases in several of these countries and in other countries not shown in the chart contributed to the $81.4 billion increase in services supplied to foreign markets by foreign affiliates (chart 10). The largest increase was for services supplied by affiliates in the United Kingdom. Among the notable 2017 increases in services supplied by foreign affiliates are the following:
- United Kingdom. Services supplied by affiliates in the United Kingdom increased $13.3 billion to $247.2 billion. Most of the increase was accounted for by finance and insurance, other industries, and information.
- Netherlands. Services supplied by affiliates in the Netherlands increased $10.4 billion to $76.8 billion. More than half of the increase was in information and in finance and insurance.
[Click chart to expand]
- Ireland. Services supplied by Irish affiliates increased $9.2 billion to $142.1 billion. Increases in services supplied by affiliates in real estate and rental and leasing and in professional, scientific, and technical services together more than offset a large decrease in information.
- Switzerland. Services supplied by Swiss affiliates increased $5.8 billion to $81.2 billion. The largest increase was in wholesale trade, particularly for distributors of nondurable goods.
- Luxembourg. Services supplied by affiliates in Luxembourg (not shown in chart 10) increased $5.5 billion to $29.9 billion. About half of the increase was in finance and insurance.
- India. Services supplied by affiliates in India (not shown in chart 10) increased $4.6 billion to $32.1 billion. About half of the increase was in professional, technical, and scientific services.
Increases in several countries listed in chart 10 contributed substantially to the $83.3 billion aggregate increase in services supplied by foreign MNEs through their U.S. affiliates; the largest increase was for Canadian-owned U.S. affiliates. Among the notable changes in services supplied by U.S. affiliates were the following:
- Canada. Services supplied by U.S. affiliates of Canadian MNEs increased $17.6 billion to $126.2 billion. Increases by affiliates in wholesale trade, retail trade, and other industries were partly offset by a decrease in services supplied by manufacturing affiliates.
- United Kingdom. Services supplied by U.S. affiliates of British MNEs increased $11.8 billion to $152.6 billion. Increases in several industries contributed, including increases in other industries (such as transportation and warehousing); professional, scientific, and technical services; finance and insurance; and information.
- Japan. Services supplied by U.S. affiliates of Japanese MNEs increased $9.4 billion to $165.1 billion, reflecting increases in wholesale trade, finance and insurance, and manufacturing.
- China. Services supplied by U.S. affiliates of Chinese MNEs increased $8.3 billion to $18.0 billion, due in part to a large increase in wholesale trade.
- Germany. Services supplied by U.S. affiliates of German MNEs increased $8.3 billion to $147.5 billion. The largest increases were in other industries and information.
- Netherlands. Services supplied by U.S. affiliates of Dutch MNEs increased $7.2 billion to $66.2 billion, reflecting increases in information and in finance and insurance.
- Ireland. Services supplied by U.S. affiliates of Irish MNEs decreased $1.7 billion to $28.2 billion. The decrease reflected a decrease in manufacturing partly offset by increases in other industries.
Services supplied through affiliates by destination
Foreign affiliates supply services to both foreign markets and to the U.S. market.16 Services supplied to foreign markets, which include the host country markets and other foreign markets, accounted for 88 percent of the $1.8 trillion in services supplied by foreign affiliates worldwide in 2017 (table F). Services supplied to the U.S. market, which are not included in the international services supplied statistics featured in this article, accounted for the remaining 12 percent. In 2017, 65 percent of services supplied worldwide through affiliates were in the affiliates’ host country, while other foreign markets accounted for 23 percent.
U.S. affiliates supply services to both the U.S. market and to foreign markets (which are mostly classified as U.S. exports of services); however, transactions in the U.S. market account for the vast majority of the services supplied worldwide by U.S. affiliates. In 2017, transactions in the U.S. market accounted for 89 percent of the $1.2 trillion in services supplied worldwide by U.S. affiliates. Services supplied to foreign markets, which are not included in the services supplied through affiliates statistics featured in this article, accounted for the remaining 11 percent.
| Billions of dollars | Percent change from the preceding year | Percent of total services supplied | ||
|---|---|---|---|---|
| 2016 | 2017 | 2017 | 2017 | |
| Services supplied by U.S. MNEs through their majority-owned foreign affiliates | ||||
| Total services supplied | 1,682.9 | 1,765.5 | 4.9 | ..... |
| Services supplied to U.S. persons | 205.9 | 207.2 | 0.6 | 11.7 |
| Services supplied to foreign persons | 1,477.0 | 1,558.4 | 5.5 | 88.3 |
| To the host country | 1,092.6 | 1,153.8 | 5.6 | 65.4 |
| To other foreign countries | 384.3 | 404.6 | 5.3 | 22.9 |
| Services supplied by foreign MNEs through their majority-owned U.S. affiliates | ||||
| Total services supplied | 1,103.9 | 1,209.8 | 9.6 | ..... |
| Services supplied to U.S. persons | 999.4 | 1,082.6 | 8.3 | 89.5 |
| Services supplied to foreign persons | 104.5 | 127.2 | 21.7 | 10.5 |
- MNE
- Multinational enterprises
- More information on the definitions, coverage, and methodology of trade in services and services supplied through affiliates is available on the Bureau of Economic Analysis website.
- The term “affiliates” in this article refers to majority-owned affiliates. The statistics on services supplied through affiliates cover the full value of services provided by majority-owned affiliates, irrespective of the percentage of ownership.
- The statistics on trade in services and services supplied through affiliates are not directly comparable, because of differences in coverage and classification. For example, wholesale and retail trade distributive services are included in services supplied through affiliates but not in trade in services statistics. Trade in services are collected and published by type of service, but services supplied through affiliates are collected and published by the affiliate’s primary industry. For more information, see “Definition of International Services” on BEA’s website.
- World Trade Organization, United Nations Conference on Trade and Development, and International Trade Centre Annual Trade in Services Dataset (last updated May 2019).
- World Bank World Development Indicators (series: GDP, PPP, current international dollars)
- “Travel (for all purposes including education)” is the name used in the trade in services statistics to encompass a broadly defined travel category. This category includes business travel and personal travel. Business travel includes expenditures by border, seasonal, and other short-term workers and other business travel. Personal travel includes health-related travel, education-related travel, and other personal travel. Note that airfares or other expenditures associated with transporting travelers between the United States and foreign countries are not classified in travel; these expenditures are included in transport services.
- The statistics in this article supersede those presented in Shari A. Allen, Alexis N. Grimm, and Christopher P. Steiner, “U.S. International Services: Trade in Services in 2017 and Services Supplied Through Affiliates in 2016,” Survey of Current Business 98 (October 2018). Revisions of trade in services statistics for 2016–2018 were published in June 2019 and are already reflected in the ITAs and monthly trade statistics on BEA’s website.
- Based on data from the World Federation of Exchanges.
- National Science Board, Science and Engineering Indicators 2018 (Alexandria, VA: National Science Foundation, 2018 (NSB–2018–1)).
- For a detailed description of how ICT and potentially ICT-enabled statistics are defined, see Alexis N. Grimm, “Trends in U.S. Trade in Information and Communications Technology (ICT) Services and in ICT-Enabled Services,” Survey 96 (May 2016).
- The EBOPS guidelines were established by the Manual on Statistics of International Trade in Services (Geneva: United Nations Department of Economic and Social Affairs, 2010) and Balance of Payments and International Investment Position Manual, Sixth Edition (Washington, DC: International Monetary Fund, 2009).
- For some countries, exports and imports of potentially ICT-enabled services were suppressed to avoid the disclosure of data of individual companies. Of the top 10 trading partners, the values for potentially ICT-enabled services exports were suppressed for Ireland and U.K. Islands, Caribbean in 2018 and for Ireland; Japan; U.K. Islands, Caribbean; and Singapore in 2017. Values for potentially ICT-enabled services imports were suppressed for the United Kingdom, Ireland, Switzerland, Bermuda, and Singapore in 2018 and Ireland and Bermuda in 2017. For these countries, ranges of feasible values are presented to facilitate the discussion of potentially ICT-enabled services exports and imports for the countries, and the lower bounds of these ranges are used to rank the countries.
- The UBO of a U.S. affiliate is that person or entity, proceeding up the affiliate’s ownership chain, beginning with and including the foreign parent, that is not owned by more than 50 percent by another person. Unlike the foreign parent, the UBO of an affiliate may be located in the United States. The UBO of each affiliate ultimately owns or controls the U.S. affiliate and therefore ultimately derives the benefits from ownership or control.
- Professional, scientific, and technical services includes architectural, engineering, and related services; computer systems design and related services; management, scientific, and technical consulting; and other industries.
- Wholesale trade includes motor vehicles and other motor vehicle parts and supplies; professional and commercial equipment and supplies; electrical and electronic goods; petroleum and petroleum products; drugs and druggists’ sundries; and other wholesale trade.
- Services supplied by foreign affiliates to the U.S. market are mostly classified as U.S. imports of services. However, data from BEA’s direct investment surveys on these services supplied are not used to estimate U.S. imports of services; data on these services are collected along with data on other U.S. services imports in BEA’s services trade collection program. Of the services supplied by foreign affiliates to the U.S. market, distributive services in wholesale and retail trade are generally not included as U.S. imports of services.