Government Receipts and Expenditures
Third Quarter of 2019
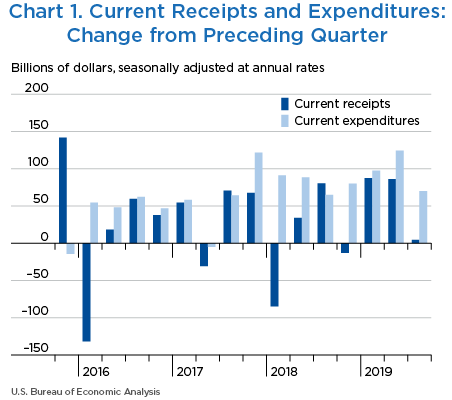
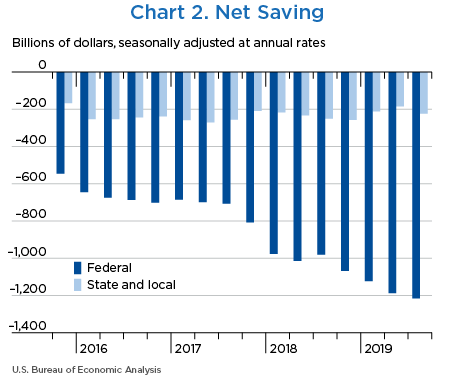
Net government saving, the difference between current receipts and current expenditures in the federal government and state and local governments, was −$1,438.5 billion in the third quarter of 2019, decreasing $65.5 billion from −$1,373.0 billion in the second quarter of 2019 (charts 1 and 2 and table 1).
“Net lending or net borrowing (−)” is an alternative measure of the government fiscal position. Net borrowing is the financing requirement of the government sector, and it is derived as net government saving plus the consumption of fixed capital and net capital transfers received less gross investment and net purchases of nonproduced assets.
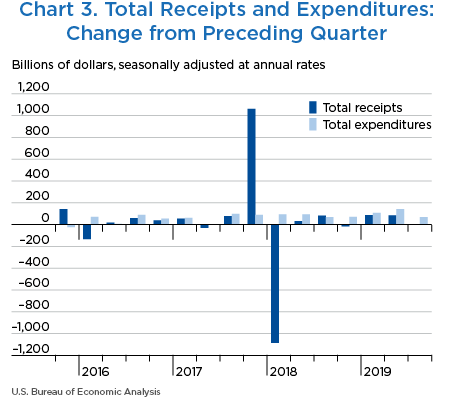
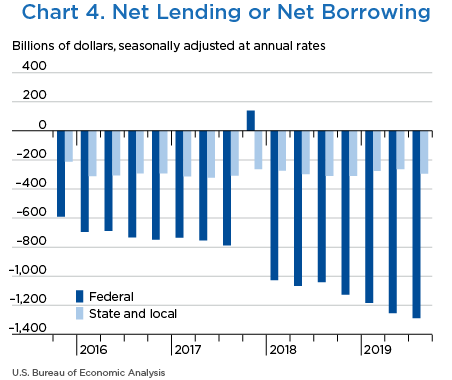
Net borrowing was $1,582.1 billion in the third quarter, increasing $64.8 billion from $1,517.3 billion in the second quarter (charts 3 and 4 and table 1).
| Line | Level | Change from preceding quarter | ||||
|---|---|---|---|---|---|---|
| 2019 | 2018 | 2019 | 2019 | 2019 | ||
| III | IV | I | II | III | ||
| 1 | Current receipts | 5,754.6 | −13.1 | 87.3 | 86.1 | 4.6 |
| 2 | Current expenditures | 7,193.1 | 79.9 | 97.5 | 124.5 | 70.1 |
| 3 | Net government saving | −1,438.5 | −93.0 | −10.2 | −38.3 | −65.5 |
| 4 | Federal | −1,215.1 | −86.3 | −55.3 | −65.1 | −27.1 |
| 5 | State and local | −223.4 | −6.7 | 45.1 | 26.7 | −38.4 |
| 6 | Net lending or net borrowing (−) | −1,582.1 | −87.6 | −21.1 | −58.6 | −64.8 |
| 7 | Federal | −1,287.9 | −86.4 | −55.9 | −70.7 | −33.8 |
| 8 | State and local | −294.2 | −1.2 | 34.8 | 12.1 | −31.0 |
Net federal government saving was −$1,215.1 billion in the third quarter, decreasing $27.1 billion from −$1,188.0 billion in the second quarter (table 2). In the third quarter, both current receipts and current expenditures decelerated.
Federal government net borrowing was $1,287.9 billion in the third quarter, increasing $33.8 billion from $1,254.1 billion in the second quarter.
- Personal current taxes (line 3) accelerated in the third quarter, reflecting the pattern of wages.
- Taxes on production and imports (line 4) turned up in the third quarter. Customs duties turned up in the third quarter, reflecting an increase in tariff rates on many imported goods.
- Taxes on corporate income (line 5) turned down in the third quarter, reflecting a deceleration in corporate profits.
- Contributions for government social insurance (line 7) accelerated in the third quarter, reflecting the pattern of wages.
- Income receipts on assets (line 8) turned down in the third quarter, reflecting a downturn in dividends from the regional Federal Reserve Banks and a deceleration in dividends received from Fannie Mae and Freddie Mac. The Treasury Department modified the terms of Fannie Mae and Freddie Mac conservatorship agreements to allow for the accumulations and holdings of larger capital reserves.
- Current transfer receipts (line 9) turned up in the third quarter. Third-quarter receipts were boosted by a $5.0 billion ($20.0 billion at an annual rate) settlement with Facebook for data privacy violations.
- Consumption expenditures (line 12) decelerated in the third quarter, reflecting a deceleration in national defense expenditures.
- Grants-in-aid to state and local governments (line 20) decelerated, reflecting a deceleration in Medicaid grants.
- Other current transfer payments to the rest of the world (line 21) turned up in the third quarter.
- Interest payments (line 22) turned down in the third quarter, reflecting a downturn in interest paid on Treasury Inflation-Protected Securities.
- Subsidies (line 23) turned up in the third quarter, reflecting the pattern of agricultural subsidies from the U.S. Department of Agriculture Market Facilitation Program, which provides relief from tariffs on certain farm products.
| Line | Level | Change from preceding quarter | ||||
|---|---|---|---|---|---|---|
| 2019 | 2018 | 2019 | 2019 | 2019 | ||
| III | IV | I | II | III | ||
| 1 | Current receipts | 3,619.1 | −16.4 | 47.7 | 29.6 | 12.8 |
| 2 | Current tax receipts | 2,033.5 | 16.5 | 30.7 | 9.0 | 5.9 |
| 3 | Personal current taxes | 1,705.9 | 5.6 | 54.1 | 3.3 | 14.6 |
| 4 | Taxes on production and imports | 171.6 | 20.6 | −14.2 | −4.4 | 9.9 |
| 5 | Taxes on corporate income | 127.2 | −11.3 | −8.3 | 9.4 | −18.8 |
| 6 | Taxes from the rest of the world | 28.8 | 1.7 | −0.9 | 0.6 | 0.2 |
| 7 | Contributions for government social insurance | 1,409.6 | 6.3 | 39.0 | 8.8 | 10.4 |
| 8 | Income receipts on assets | 97.6 | 0.4 | −18.7 | 13.4 | −22.1 |
| 9 | Current transfer receipts | 86.3 | −37.2 | −1.8 | −0.3 | 18.1 |
| 10 | Current surplus of government enterprises | −8.1 | −2.4 | −1.6 | −1.1 | 0.2 |
| 11 | Current expenditures | 4,834.2 | 69.8 | 103.0 | 94.6 | 40.0 |
| 12 | Consumption expenditures | 1,121.5 | 5.0 | 18.5 | 18.9 | 11.0 |
| 13 | National defense | 680.2 | 6.9 | 14.8 | 10.3 | 3.3 |
| 14 | Nondefense | 441.3 | −1.9 | 3.7 | 8.6 | 7.7 |
| 15 | Current transfer payments | 3,045.6 | 30.0 | 111.4 | 24.7 | 28.2 |
| 16 | Government social benefits | 2,377.2 | 23.7 | 97.3 | 23.5 | 23.3 |
| 17 | To persons | 2,353.1 | 23.8 | 96.5 | 23.1 | 23.0 |
| 18 | To the rest of the world | 24.2 | 0.0 | 0.7 | 0.3 | 0.5 |
| 19 | Other current transfer payments | 668.4 | 6.3 | 14.1 | 1.2 | 4.9 |
| 20 | Grants-in-aid to state and local governments | 614.3 | −1.1 | 15.9 | 13.6 | 0.2 |
| 21 | To the rest of the world | 54.2 | 7.4 | −1.8 | −12.4 | 4.8 |
| 22 | Interest payments | 584.9 | 11.9 | −18.0 | 61.7 | −20.2 |
| 23 | Subsidies | 82.1 | 22.9 | −8.7 | −10.7 | 20.8 |
| 24 | Net federal government saving | −1,215.1 | −86.3 | −55.3 | −65.1 | −27.1 |
| 25 | Social insurance funds | −437.1 | −21.3 | −22.0 | −17.6 | −13.6 |
| 26 | Other | −778.0 | −64.9 | −33.3 | −47.4 | −13.6 |
| Addenda: | ||||||
| 27 | Total receipts | 3,637.4 | −16.6 | 46.8 | 27.8 | 11.5 |
| 28 | Current receipts | 3,619.1 | −16.4 | 47.7 | 29.6 | 12.8 |
| 29 | Capital transfer receipts | 18.3 | −0.2 | −0.9 | −1.7 | −1.4 |
| 30 | Total expenditures | 4,925.3 | 69.8 | 102.7 | 98.6 | 45.2 |
| 31 | Current expenditures | 4,834.2 | 69.8 | 103.0 | 94.6 | 40.0 |
| 32 | Gross government investment | 310.7 | 8.1 | 4.4 | 1.6 | 6.0 |
| 33 | Capital transfer payments | 77.7 | −4.7 | 2.6 | −1.5 | 1.7 |
| 34 | Net purchases of nonproduced assets | −2.2 | −2.1 | −4.4 | 4.5 | 0.1 |
| 35 | Less: Consumption of fixed capital | 295.0 | 1.4 | 2.9 | 0.7 | 2.4 |
| 36 | Net lending or net borrowing (−) | −1,287.9 | −86.4 | −55.9 | −70.7 | −33.8 |
Net state and local government saving was −$223.4 billion in the third quarter, decreasing $38.4 billion from −$185.0 billion in the first quarter. In the third quarter, current receipts turned down and current expenditures decelerated (table 3).
State and local government net borrowing was $294.2 billion in the third quarter, increasing $31.0 billion from $263.2 billion in the second quarter.
- Personal current taxes (line 3) turned down in the third quarter, reflecting a downturn in personal income taxes.
- Taxes on corporate income (line 5) turned down in the third quarter, reflecting a deceleration in corporate profits.
- Federal grants-in-aid (line 9) decelerated in the third quarter, reflecting a deceleration in Medicaid grants.
- Other current transfer receipts (line 10) turned down in the third quarter. Second-quarter transfer receipts were boosted $0.7 billion ($2.9 billion at an annual rate) from a settlement with UniCredit Group Banks in foreign countries to the state of New York for concealing transactions that violated sanctions.
- Consumption expenditures (line 13) decelerated in the third quarter, reflecting a downturn in spending on nondurable goods, specifically petroleum.
- Government social benefits (line 14) decelerated in the third quarter, reflecting a deceleration in Medicaid benefits.
| Line | Level | Change from preceding quarter | ||||
|---|---|---|---|---|---|---|
| 2019 | 2018 | 2019 | 2019 | 2019 | ||
| III | IV | I | II | III | ||
| 1 | Current receipts | 2,749.8 | 2.3 | 55.5 | 70.1 | −8.0 |
| 2 | Current tax receipts | 1,885.6 | −3.5 | 42.1 | 53.5 | −7.4 |
| 3 | Personal current taxes | 484.7 | −14.6 | 25.3 | 39.9 | −24.1 |
| 4 | Taxes on production and imports | 1,334.6 | 12.2 | 11.4 | 11.4 | 17.0 |
| 5 | Taxes on corporate income | 66.3 | −1.1 | 5.3 | 2.3 | −0.3 |
| 6 | Contributions for government social insurance | 22.8 | 0.1 | 0.0 | 0.1 | 0.2 |
| 7 | Income receipts on assets | 94.0 | 0.9 | 1.0 | 0.3 | 0.2 |
| 8 | Current transfer receipts | 752.0 | 5.1 | 12.3 | 16.6 | −1.0 |
| 9 | Federal grants-in-aid | 614.3 | −1.1 | 15.9 | 13.6 | 0.2 |
| 10 | Other | 137.7 | 6.2 | −3.5 | 2.9 | −1.2 |
| 11 | Current surplus of government enterprises | −4.6 | −0.3 | 0.0 | −0.3 | 0.0 |
| 12 | Current expenditures | 2,973.2 | 9.0 | 10.3 | 43.5 | 30.3 |
| 13 | Consumption expenditures | 1,913.1 | 15.7 | 0.1 | 21.5 | 15.2 |
| 14 | Government social benefits | 789.7 | −4.2 | 13.2 | 22.3 | 15.7 |
| 15 | Interest payments | 269.8 | −2.5 | −3.0 | −0.4 | −0.5 |
| 16 | Subsidies | 0.6 | 0.0 | 0.0 | 0.0 | 0.0 |
| 17 | Net state and local government saving | −223.4 | −6.7 | 45.1 | 26.7 | −38.4 |
| 18 | Social insurance funds | 5.5 | 0.0 | −0.1 | −0.1 | 0.1 |
| 19 | Other | −228.9 | −6.6 | 45.2 | 26.8 | −38.5 |
| Addenda: | ||||||
| 20 | Total receipts | 2,825.9 | −1.9 | 58.2 | 68.4 | −6.3 |
| 21 | Current receipts | 2,749.8 | 2.3 | 55.5 | 70.1 | −8.0 |
| 22 | Capital transfer receipts | 76.2 | −4.3 | 2.8 | −1.7 | 1.8 |
| 23 | Total expenditures | 3,120.1 | −0.8 | 23.3 | 56.4 | 24.7 |
| 24 | Current expenditures | 2,973.2 | 9.0 | 10.3 | 43.5 | 30.3 |
| 25 | Gross government investment | 426.5 | −6.6 | 15.3 | 17.2 | −2.7 |
| 26 | Capital transfer payments | |||||
| 27 | Net purchases of nonproduced assets | 15.2 | 0.3 | 0.4 | 0.1 | −0.2 |
| 28 | Less: Consumption of fixed capital | 294.8 | 3.4 | 2.8 | 4.3 | 2.8 |
| 29 | Net lending or net borrowing (−) | −294.2 | −1.2 | 34.8 | 12.1 | −31.0 |


