Government Receipts and Expenditures
First Quarter 2020
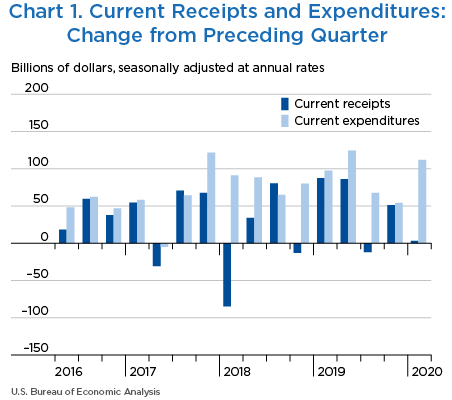
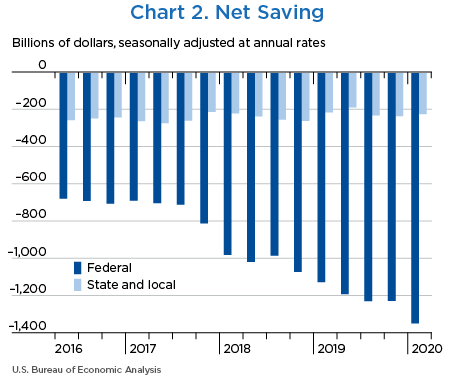
Net government saving, the difference between current receipts and current expenditures in the federal government and state and local governments, was −$1,564.5 billion in the first quarter of 2020, decreasing $108.7 billion from −$1,455.8 billion in the fourth quarter of 2019 (charts 1 and 2 and table 1).
“Net lending or net borrowing (−)” is an alternative measure of the government fiscal position. Net borrowing is the financing requirement of the government sector, and it is derived as net government saving plus the consumption of fixed capital and net capital transfers received less gross investment and net purchases of nonproduced assets.
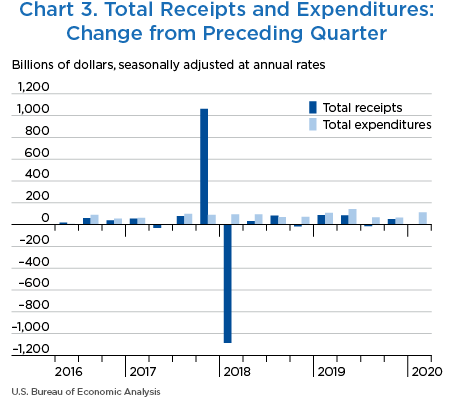
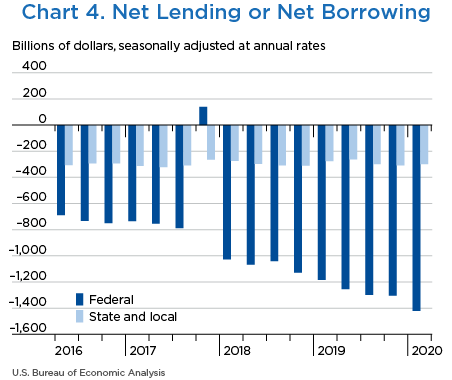
Net borrowing was $1,718.7 billion in the first quarter, increasing $107.2 billion from $1,611.5 billion in the fourth quarter (charts 3 and 4 and table 1).
| Line | Level | Change from preceding quarter | ||||
|---|---|---|---|---|---|---|
| 2020 | 2019 | 2019 | 2019 | 2020 | ||
| I | II | III | IV | I | ||
| 1 | Current receipts | 5,792.3 | 86.1 | −11.8 | 50.9 | 3.2 |
| 2 | Current expenditures | 7,356.8 | 124.5 | 67.7 | 54.3 | 111.8 |
| 3 | Net government saving | −1,564.5 | −38.3 | −79.6 | −3.2 | −108.7 |
| 4 | Federal | −1,344.2 | −65.1 | −37.2 | 1.0 | −120.0 |
| 5 | State and local | −220.2 | 26.7 | −42.4 | −4.3 | 11.5 |
| 6 | Net lending or net borrowing (−) | −1,718.7 | −58.6 | −80.3 | −13.9 | −107.2 |
| 7 | Federal | −1,420.5 | −70.7 | −44.5 | −5.4 | −116.5 |
| 8 | State and local | −298.2 | 12.1 | −35.8 | −8.5 | 9.3 |
Net federal government saving was −$1,344.2 billion in the first quarter, decreasing $120.0 billion from −$1,224.2 billion in the fourth quarter (table 2). In the first quarter, current receipts turned down and current expenditures accelerated.
Federal government net borrowing was $1,420.5 billion in the first quarter, increasing $116.5 billion from $1,304.0 billion in the fourth quarter.
- Personal current taxes (line 3) remained unchanged in the first quarter after increasing $25.0 billion in the fourth quarter. Withheld taxes turned down, reflecting the pattern of wages. Nonwithheld taxes decelerated, increasing $2.2 billion after increasing $5.3 billion.
- Taxes on production and imports (line 4) decelerated in the first quarter. Customs duties turned down in the first quarter, reflecting a slowdown in the volume of imports. The downturn was partially offset by an acceleration in excise taxes, reflecting the restoration of annual fees established by the Affordable Care Act from health insurance companies.
- Taxes on corporate income (line 5) turned down in the first quarter, reflecting a downturn in corporate profits.
- Contributions for government social insurance (line 7) decelerated in the first quarter, reflecting the pattern of wages.
- Income receipts on assets (line 8) turned down in the first quarter, reflecting a temporary moratorium on the collection of interest on direct student loans authorized by the Coronavirus Aid, Relief, and Economic Security Act.
- Current transfer receipts (line 9) decreased less in the first quarter, decreasing $4.4 billion after decreasing $22.8 billion in the fourth quarter. The smaller decline in current transfer receipts reflects the absence of any large fines paid to the federal government by businesses. Additionally, fines from persons related to the Affordable Care Act, which are typically paid in the subsequent year’s tax filing period, were suspended beginning in tax year 2019.
- Government social benefits to persons (line 17) accelerated in the first quarter, reflecting a cost-of-living adjustment that boosted benefits for social security, veterans' pensions, and supplemental security income. Payments of health insurance premium tax credits related to the Affordable Care Act turned up, reflecting an increase in the number of people enrolled in Affordable Care Act plans. Additionally, regular unemployment benefits accelerated, reflecting an increase in the number of people receiving unemployment benefits as a result of “stay-at-home” orders in response to the COVID-19 pandemic.
- Grants-in-aid to state and local governments (line 20) accelerated in the first quarter, reflecting an upturn in Medicaid grants.
- Interest payments (line 22) turned up in the first quarter, reflecting an upturn in interest paid on Treasury Inflation-Protected Securities.
- Subsidies (line 23) continued to decrease in the first quarter, reflecting a decrease in agricultural subsidies from the U.S. Department of Agriculture Market Facilitation Program, which provides payments to farmers affected by foreign tariffs on certain farm products.
| Line | Level | Change from preceding quarter | ||||
|---|---|---|---|---|---|---|
| 2020 | 2019 | 2019 | 2019 | 2020 | ||
| I | II | III | IV | I | ||
| 1 | Current receipts | 3,636.6 | 29.6 | 2.0 | 41.3 | −13.0 |
| 2 | Current tax receipts | 2,052.8 | 9.0 | 0.8 | 41.6 | −17.2 |
| 3 | Personal current taxes | 1,723.4 | 3.3 | 7.1 | 25.0 | 0.0 |
| 4 | Taxes on production and imports | 181.5 | −4.4 | 9.8 | 5.6 | 4.4 |
| 5 | Taxes on corporate income | 118.1 | 9.4 | −15.9 | 10.6 | −22.6 |
| 6 | Taxes from the rest of the world | 29.7 | 0.6 | −0.1 | 0.2 | 1.0 |
| 7 | Contributions for government social insurance | 1,431.5 | 8.8 | 4.8 | 14.7 | 12.8 |
| 8 | Income receipts on assets | 98.8 | 13.4 | −22.0 | 6.9 | −5.8 |
| 9 | Current transfer receipts | 59.2 | −0.3 | 18.1 | −22.8 | −4.3 |
| 10 | Current surplus of government enterprises | −5.7 | −1.1 | 0.2 | 0.9 | 1.5 |
| 11 | Current expenditures | 4,980.8 | 94.6 | 39.3 | 40.3 | 107.0 |
| 12 | Consumption expenditures | 1,146.5 | 18.9 | 10.6 | 11.7 | 13.7 |
| 13 | National defense | 695.9 | 10.3 | 3.3 | 7.4 | 8.3 |
| 14 | Nondefense | 450.6 | 8.6 | 7.3 | 4.2 | 5.5 |
| 15 | Current transfer payments | 3,171.8 | 24.7 | 28.3 | 34.0 | 92.1 |
| 16 | Government social benefits | 2,476.7 | 23.5 | 23.4 | 24.6 | 74.8 |
| 17 | To persons | 2,452.0 | 23.1 | 23.0 | 24.5 | 74.4 |
| 18 | To the rest of the world | 24.8 | 0.3 | 0.5 | 0.0 | 0.6 |
| 19 | Other current transfer payments | 695.0 | 1.2 | 4.8 | 9.5 | 17.2 |
| 20 | Grants-in-aid to state and local governments | 628.2 | 13.6 | 0.2 | 2.3 | 11.6 |
| 21 | To the rest of the world | 66.8 | −12.4 | 4.7 | 7.1 | 5.6 |
| 22 | Interest payments | 587.2 | 61.7 | −20.3 | −4.8 | 7.2 |
| 23 | Subsidies | 75.3 | −10.7 | 20.7 | −0.6 | −6.1 |
| 24 | Net federal government saving | −1,344.2 | −65.1 | −37.2 | 1.0 | −120.0 |
| 25 | Social insurance funds | −486.7 | −17.6 | −19.4 | −7.9 | −35.9 |
| 26 | Other | −857.5 | −47.4 | −17.9 | 8.9 | −84.1 |
| Addenda: | ||||||
| 27 | Total receipts | 3,655.2 | 27.8 | 0.7 | 40.5 | −11.9 |
| 28 | Current receipts | 3,636.6 | 29.6 | 2.0 | 41.3 | −13.0 |
| 29 | Capital transfer receipts | 18.7 | −1.7 | −1.4 | −0.9 | 1.3 |
| 30 | Total expenditures | 5,075.8 | 98.6 | 45.1 | 45.9 | 104.7 |
| 31 | Current expenditures | 4,980.8 | 94.6 | 39.3 | 40.3 | 107.0 |
| 32 | Gross government investment | 313.5 | 1.6 | 6.5 | 5.9 | −3.6 |
| 33 | Capital transfer payments | 81.8 | −1.5 | 1.7 | 0.7 | 3.4 |
| 34 | Net purchases of nonproduced assets | −0.8 | 4.5 | 0.1 | 1.3 | 0.1 |
| 35 | Less: Consumption of fixed capital | 299.5 | 0.7 | 2.5 | 2.2 | 2.2 |
| 36 | Net lending or net borrowing (−) | −1,420.5 | −70.7 | −44.5 | −5.4 | −116.5 |
Net state and local government saving was −$220.2 billion in the first quarter, increasing $11.5 billion from –$231.7 billion in the fourth quarter. In the first quarter, both current receipts and current expenditures accelerated (table 3).
State and local government net borrowing was $298.2 billion in the first quarter, decreasing $9.3 billion from $307.5 billion in the fourth quarter.
- Personal current taxes (line 3) turned up in the first quarter, reflecting an upturn in personal income taxes.
- Taxes on production and imports (line 4) accelerated in the first quarter, reflecting an acceleration in state sales taxes and in state payroll taxes. The state of Massachusetts implemented a statewide payroll tax as part of the Massachusetts Paid Family and Medical Leave law.
- Taxes on corporate income (line 5) turned down in the first quarter, reflecting a downturn in corporate profits.
- Federal grants-in-aid (line 9) accelerated in the first quarter, reflecting an upturn in Medicaid grants.
- Current surplus of government enterprises (line 11) turned down, reflecting lower revenue from casinos, tolls, and public transit as a result of stay-at-home orders in response to the COVID-19 pandemic.
- Government social benefits (line 14) turned up in the first quarter, reflecting an upturn in Medicaid benefits.
- Gross government investment (line 25) accelerated in the first quarter, reflecting an acceleration in investment for structures.
| Line | Level | Change from preceding quarter | ||||
|---|---|---|---|---|---|---|
| 2020 | 2019 | 2019 | 2019 | 2020 | ||
| I | II | III | IV | I | ||
| 1 | Current receipts | 2,784.0 | 70.1 | −13.7 | 12.0 | 27.9 |
| 2 | Current tax receipts | 1,911.2 | 53.5 | −13.3 | 9.6 | 21.9 |
| 3 | Personal current taxes | 490.7 | 39.9 | −31.8 | −0.1 | 13.8 |
| 4 | Taxes on production and imports | 1,355.3 | 11.4 | 18.5 | 6.8 | 12.4 |
| 5 | Taxes on corporate income | 65.2 | 2.3 | 0.0 | 2.9 | −4.3 |
| 6 | Contributions for government social insurance | 23.4 | 0.1 | 0.2 | 0.3 | 0.3 |
| 7 | Income receipts on assets | 96.2 | 0.3 | 0.4 | 0.5 | 1.5 |
| 8 | Current transfer receipts | 766.1 | 16.6 | −1.0 | 1.7 | 12.4 |
| 9 | Federal grants-in-aid | 628.2 | 13.6 | 0.2 | 2.3 | 11.6 |
| 10 | Other | 137.9 | 2.9 | −1.2 | −0.6 | 0.8 |
| 11 | Current surplus of government enterprises | −12.9 | −0.3 | 0.0 | 0.1 | −8.4 |
| 12 | Current expenditures | 3,004.2 | 43.5 | 28.6 | 16.3 | 16.4 |
| 13 | Consumption expenditures | 1,948.9 | 21.5 | 15.3 | 17.2 | 18.5 |
| 14 | Government social benefits | 790.7 | 22.3 | 14.0 | −0.3 | 3.0 |
| 15 | Interest payments | 264.0 | −0.4 | −0.6 | −0.7 | −5.0 |
| 16 | Subsidies | 0.6 | 0.0 | 0.0 | 0.0 | 0.0 |
| 17 | Net state and local government saving | −220.2 | 26.7 | −42.4 | −4.3 | 11.5 |
| 18 | Social insurance funds | 5.9 | −0.1 | 0.1 | 0.2 | 0.2 |
| 19 | Other | −226.2 | 26.8 | −42.4 | −4.5 | 11.1 |
| Addenda: | ||||||
| 20 | Total receipts | 2,863.5 | 68.4 | −12.0 | 12.1 | 31.2 |
| 21 | Current receipts | 2,784.0 | 70.1 | −13.7 | 12.0 | 27.9 |
| 22 | Capital transfer receipts | 79.5 | −1.7 | 1.7 | 0.0 | 3.4 |
| 23 | Total expenditures | 3,161.7 | 56.4 | 23.8 | 20.5 | 22.0 |
| 24 | Current expenditures | 3,004.2 | 43.5 | 28.6 | 16.3 | 16.4 |
| 25 | Gross government investment | 441.8 | 17.2 | −1.8 | 6.0 | 8.4 |
| 26 | Capital transfer payments | |||||
| 27 | Net purchases of nonproduced assets | 13.9 | 0.1 | −0.2 | −0.5 | −0.8 |
| 28 | Less: Consumption of fixed capital | 298.2 | 4.3 | 2.7 | 1.4 | 2.1 |
| 29 | Net lending or net borrowing (−) | −298.2 | 12.1 | −35.8 | −8.5 | 9.3 |


