
Annual Update of the U.S. International Transactions Accounts
In June 2020, the Bureau of Economic Analysis (BEA) released the results of the 2020 annual updates of the U.S. International Transactions Accounts (ITAs) and the U.S. International Investment Position (IIP) Accounts. BEA has also accelerated the availability of its most detailed annual trade in services statistics by service type and geographic area, which previously were typically released in October of each year.1
As in previous years, this annual update of the ITAs incorporates newly available and revised source data for the preceding 3 years and additional years for selected series, and recalculated seasonal and trading day adjustments for the preceding 5 years (or more for series whose not-seasonally-adjusted estimates were revised for more than the preceding 5 years). With the 2020 annual update, BEA also incorporates the results of its benchmark survey of selected services and intellectual property transactions; this affected certain types of trade in services statistics for the preceding 4 years.
In addition, this annual update includes the adoption of new methodologies and data sources for several accounts, most notably in trade in services. Many of these improvements affected statistics starting with the first quarter of 1999, the earliest period affected across the full set of accounts. Finally, the annual update includes presentational changes, particularly for trade in services.2 The methodological and presentational improvements are the result of a multiyear effort by BEA to research and develop enhanced statistics. These improvements, along with the incorporation of newly available and revised source data (including the benchmark survey) and seasonal adjustments, serve to provide more timely, accurate, consistent, and relevant statistics for data users.
Table A provides a descriptive summary of the major changes to the ITAs. Appendixes A and B provide numerical summaries of revisions to key ITA balances.3
| Components | Major changes |
|---|---|
| Multiple Accounts | |
| Overall | Added two new standard tables, tables 1.4 and 1.5, to, respectively, present (1) geographic detail by type of transaction and (2) annual trade in goods and services with expanded country and geographic area detail. |
| Presented 90 countries and geographic areas in ITA tables 1.5 and 3.3. Previously, only 38 countries and geographic areas were presented in ITA table 3.3. | |
| Presented nongeographic country groupings as addenda items in ITA tables 1.3, 1.4, 1.5, 2.2, 2.3, 3.2, and 3.3 instead of within the primary geographic hierarchy. Discontinued the publication of the Organization of the Petroleum Exporting Countries (OPEC) grouping. | |
| Used Arabic numbers instead of Roman numerals to refer to quarters. Used short-form country names except in cases where the long-form name is more commonly used. | |
| Added global total column to ITA table 1.3. | |
| Current Account | |
| Trade in services | To align with international statistical guidelines, included three new major categories in the presentation of trade in services in the ITAs, bringing the number of major categories to 12. |
| Improved the classification of services categories to align with international guidelines. | |
| Incorporated the results of the 2017 Benchmark Survey of Selected Services and Intellectual Property Transactions with Foreign Persons. | |
| Improved methods for estimating non-surveyed and non-reported transactions for services categories based on BEA services surveys. | |
| Expanded service-type detail available in standard table presentations. | |
| Manufacturing services on inputs owned by others | Introduced as a major category. No estimates yet provided; this category is a placeholder for future statistics. |
| Maintenance and repair services n.i.e. | Reclassified installation, alteration, and training services to technical, trade-related, and other business services, a component of other business services. |
| Transport | Estimated average fares based on ticket-level data from the U.S. Department of Transportation Origin and Destination Survey for exports and from the Airlines Reporting Corporation for imports. Incorporated improved passenger count data from U.S. Customs and Border Protection. |
| Used new source data from IHS Markit on vessels that transport goods to and from the United States to estimate sea freight and sea port services. | |
| Improved estimates of air freight exports and air port services using better coverage on BEA surveys of U.S. and foreign airlines along with backcasting methods. | |
| Travel (for all purposes including education) | For other business and other personal travel, refined counts of travelers using more detailed information on classes of admission, and refined calculations of average expenditures. Removed estimates of travelers traveling for health and education purposes from traveler counts. Improved allocation to separately published subcomponents: other business travel and other personal travel. Used statistics from Statistics Canada as basis for allocation of trade with Canada. |
| For education-related travel, used data from Student and Exchange Visitor Information Service as basis for estimating average expenditures for exports and imports and number of students for exports. Supplemented source data on number of students for imports with data from various sources that includes directly enrolled post-secondary students. Refined estimates for exports to cover primary and secondary students but excluded former students performing Optional Practical Training. | |
| For health-related travel, adopted an estimation methodology based in part on data from the Survey of International Air Travelers about expenditures of travelers traveling for health purposes. | |
| For expenditures by border, seasonal, and other short-term workers, improved estimates of the expenditures of short-term workers in the United States by expanding the set of visas classified as applying to foreign professionals. | |
| Construction services | Began publishing construction as a separate major category to better align with international guidelines. Previously, construction services were a component of other business services. |
| Financial services | Introduced estimates of trade in financial intermediation services indirectly measured (FISIM). |
| Introduced estimates of market-making services. These services are measured by margins on buying and selling financial securities. | |
| Divided financial services into two main categories: FISIM and “Explicitly charged and other financial services.” Within explicitly charged and other financial services, divided services into the following subcategories: (1) brokerage and market-making services; (2) underwriting and private placement services; (3) credit card and other credit-related services; (4) financial management services; (5) financial advisory and custody services; (6) securities lending, electronic funds transfer, and other services. | |
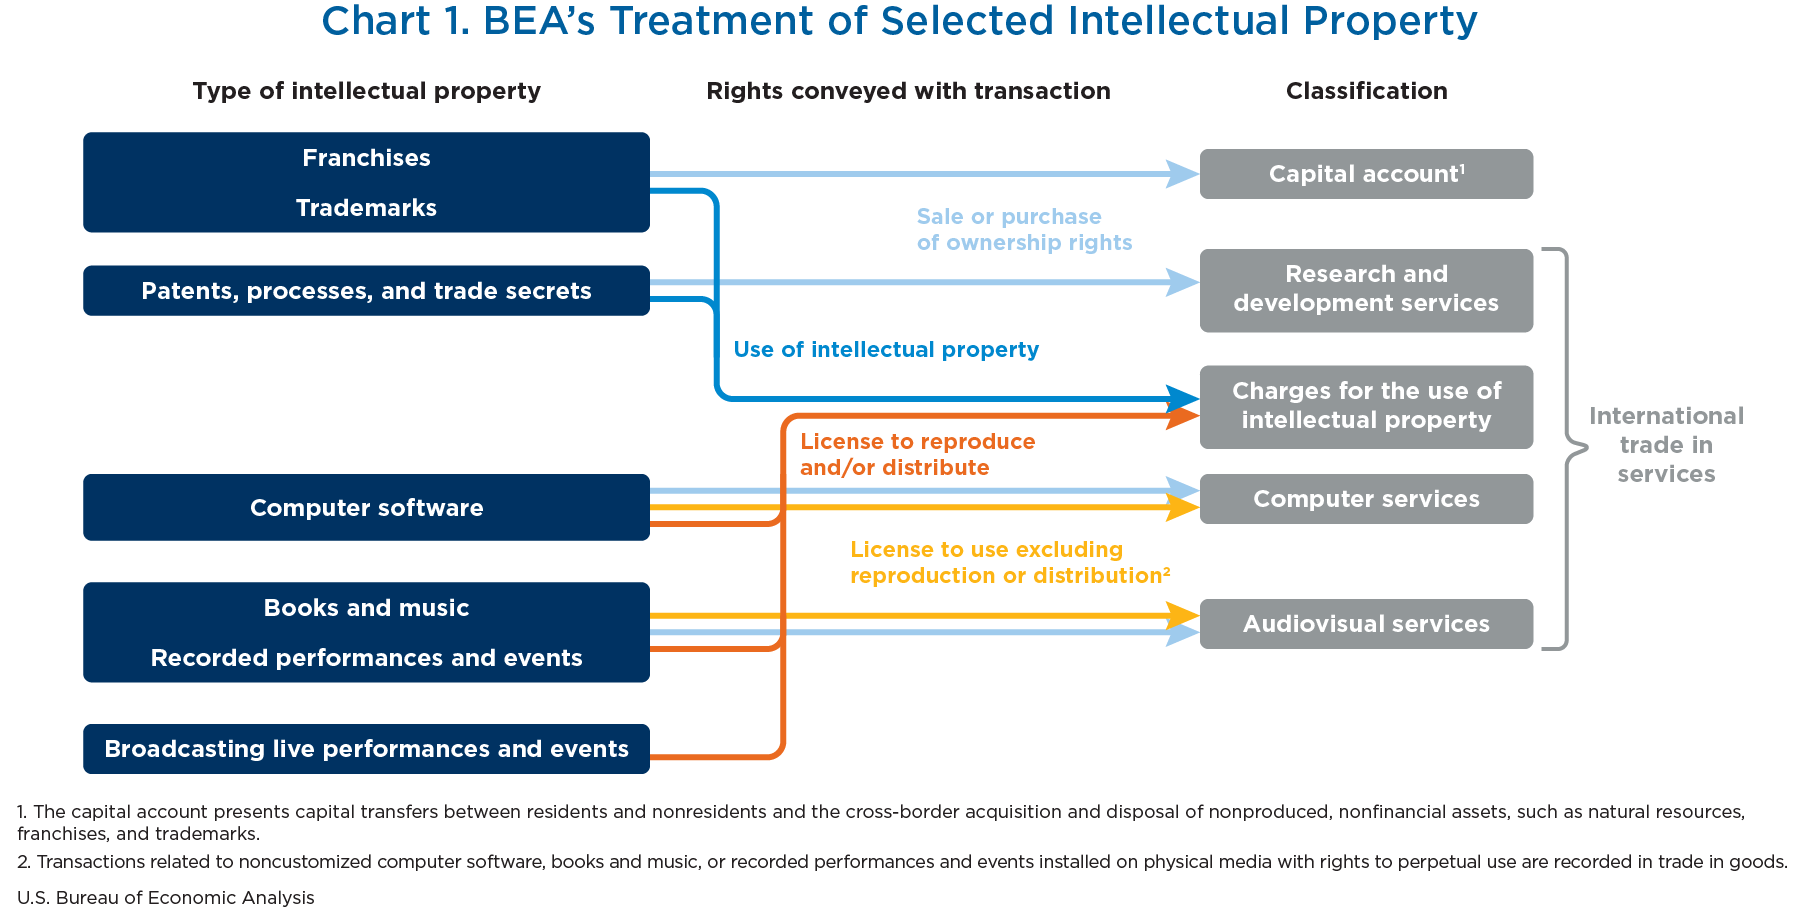
| Charges for the use of intellectual property n.i.e. | In accordance with international guidelines, reclassified certain transactions in intellectual property out of charges for the use of intellectual property n.i.e. Transactions are classified by the type of intellectual property being traded and by the type of rights being conveyed (rights to use, rights to reproduce and/or distribute, and outright sales/purchases). Transactions reclassified include (1) sales or purchases of ownership rights for patents, processes and trade secrets to research and development services; (2) sales or purchases of ownership rights for franchises and trademarks to the capital account; (3) sales or purchases of ownership rights and licenses to use (excluding reproduction or distribution) for computer software to computer services; (4) sales or purchases of ownership rights and licenses to use (excluding reproduction or distribution) for books and music and recorded performances and events to audiovisual services. |
| Divided the remaining transactions into the following categories: (1) franchises and trademarks licensing fees; (2) licenses for the use of outcomes of research and development; (3) licenses to reproduce and/or distribute computer software; (4) licenses to reproduce and/or distribute audiovisual products. | |
| Telecommunications, computer, and information services | Reclassified sales or purchases of ownership rights and licenses to use (excluding reproduction or distribution) for computer software from charges for the use of intellectual property n.i.e. to computer services. |
| Other business services | Removed construction from technical, trade-related, and other business services to create the separate major category of construction services. |
| Reclassified health services, education services, and audiovisual production services to the new category of personal, cultural, and recreational services. | |
| Reclassified the sale or purchases of ownership rights for patents, processes and trade secrets from charges for the use of intellectual property n.i.e. to research and development services. Reclassified installation, alteration, and training services from maintenance and repair services n.i.e. to technical, trade-related and other business services. | |
| Personal, cultural, and recreational (PCR) services | Introduced as a major category. Subdivided into (1) audiovisual services; (2) artistic-related services; (3) other personal, cultural, and recreational services. |
| Reclassified transactions in end-user rights to audiovisual content and outright sales or purchases of audiovisual originals from charges for the use of intellectual property n.i.e. to audiovisual services. Reclassified various transactions from other business services using expanded detail collected on BEA's surveys of selected services and intellectual property transactions. | |
| Primary income | Replaced monetary interest measure for loans and deposits in other investment income with pure interest measured by subtracting FISIM from loan interest and adding FISIM to deposit interest. Added addenda to ITA table 4.1 presenting estimates of other investment interest income receipts and payments using monetary interest. |
| For compensation of employees, improved estimates of the compensation of foreign professionals by expanding the set of visas classified as relevant. | |
| For portfolio investment income payments, improved estimates of interest payments by including income from inflation adjustments to U.S. Treasury Inflation Protected Securities (TIPS). | |
| Secondary income | Refined the econometric model used for estimating payments of personal transfers. |
| Improved estimates of payments of private transfers to better measure scholarships and other support provided to foreign students in the United States. | |
| Reclassified investment grants to capital account payments. | |
| Improved estimates of secondary income receipts by incorporating source data on foreign gifts to U.S. universities. | |
| Introduced new subcategory detail in table 5.1. | |
| Capital account | |
| Capital account | To better align with international guidelines, reclassified various transactions from the current account: (1) outright sales and purchases of trademarks and franchises from charges for the use of intellectual property n.i.e.; (2) payments of investment grants from secondary income; (3) transfer fees paid by one sporting franchise to another for the transfer of a player. |
| Incorporated newly identified source data for certain transfer fees for transfers of sports players. | |
| Financial account | |
| Other investment | Added line items for other equity assets and, as a placeholder, for other equity liabilities. Reclassified certain U.S. government capital subscriptions or other contributions to international organizations from loan assets to other equity assets. |
| Introduced newly identified U.S. government transactions in other equity assets and loan assets. | |
Key changes in classifications, methodologies, and presentations are highlighted as follows:
- Three new major categories in the presentation of trade in services have been introduced: manufacturing services on inputs owned by others (which currently does not include estimates but serves as placeholder for future statistics); construction; and personal, cultural, and recreational services.
- New methodologies and data sources or survey data have improved estimates of exports and imports of several types of transport services: air passenger services, sea freight and sea port services, air port services, and air freight services (exports only).
- Travel services estimates have been improved by methodological refinements for other business and other personal travel and by new methodologies and data sources for education-related travel and health-related travel.
- Estimates for two types of trade in financial services have been introduced to address coverage gaps: financial intermediation services indirectly measured (FISIM) and market-making services (represented by margins on buying and selling financial securities). FISIM estimates have been included as a separate component of financial services and market-making services have been combined with brokerage services as a component of financial services. Some of the other components of financial services have been reorganized.
- Estimates of several types of transactions in intellectual property have been reclassified from charges for the use of intellectual property n.i.e. (not included elsewhere) to computer services, research and development services, audiovisual services (in the new major category personal, cultural, and recreational services) and the capital account to more closely align with international statistical guidelines. The transactions that were reclassified relate to sales or purchases of ownership rights of intellectual property and certain rights to use, but not to reproduce or distribute intellectual property.
- Several other types of transactions have been reclassified within services. Among these are the reclassification of certain transactions in technical, trade-related, and other business services to the new category of personal, cultural, and recreational services; the removal of construction services to create a separate major category; and the reclassification of installation services from maintenance and repair services to technical, trade-related, and other business services.
- In primary income, new methodologies and data sources have been adopted for portfolio and other investment income for consistency with the new FISIM estimates in financial services, and a new methodology has been adopted to introduce inflation compensation gains and losses to foreign holders of U.S. Treasury Inflation Protected Securities (TIPS) in portfolio investment income payments.
- In secondary income, investment grants have been reclassified to the capital account, the methodology used to estimate payments of personal transfers has been refined, estimates of general government receipts now include estimates for gifts to U.S. universities from foreign residents, and the presentation of secondary income transactions in ITA table 5.1 has been expanded.
- Capital account statistics have been expanded to include investment grants, reclassified from secondary income; outright sales and purchases of trademarks and franchise fees, reclassified from charges for the use of intellectual property n.i.e. in the services accounts; and improved coverage of fees paid by sporting franchises for the transfer of players.
- A new category—other equity—has been introduced within other investment assets and liabilities. Certain U.S. government capital subscriptions or other contributions to international organizations have been reclassified to other equity assets from loans. Certain U.S. government transactions in other equity and loans have been included for the first time in statistics on other investment assets.
Current account and capital account
Expanded and enhanced trade in services statistics
The 2020 annual update introduced several improvements within trade in services that represent the culmination of a multiyear effort to enhance and expand BEA trade in services statistics. These improvements include more detail on some of the most dynamic services, such as research and development, intellectual property, financial services, health services, and computer and information services.
In this annual update, as part of the third phase of its trade in services initiative,4 BEA incorporated the results of the expanded benchmark and quarterly surveys of selected services and intellectual property transactions. Exports and imports for 2016–2019 of several types of trade in services were revised to incorporate the results of the benchmark and quarterly surveys. The new information collected on the benchmark and quarterly surveys was also used to introduce a number of enhancements, many of which are directly reflected in the revised ITA tables; others are primarily reflected in BEA’s most detailed annual trade in services tables.
Introduction of new major services categories. In this annual update, BEA introduced three new major categories to its presentation of trade in services in the ITAs, one of which will act as a placeholder for future statistics, bringing the number of major categories to 12. These categories are included in the recommendations of international statistical guidelines, such as the International Monetary Fund’s Balance of Payments and International Investment Position Manual, Sixth Edition (BPM6).
- Manufacturing services on inputs owned by others. Manufacturing services on inputs owned by others, a specific form of contract manufacturing, was added to the presentation of services statistics, but BEA does not yet provide values for this series. Instead, “n.a.” (not available) is shown in the tables.5
- Construction. Construction covers the services provided to create, renovate, repair, or extend buildings, land improvements, and civil engineering constructions such as roads and bridges. Additionally, inputs purchased by foreign construction contractors for projects in the United States are included in construction exports, and inputs purchased abroad by U.S. construction contractors are included in construction imports. However, in practice, no data are available to estimate inputs purchased by foreign contractors for projects in the United States, so BEA does not provide values for this component of construction exports. Instead, “n.a.” is shown. These transactions were previously recorded in a construction subcategory under the major category “other business services” and are now published as the new major category of “construction” to better align with BPM6 guidelines and enable greater comparability of U.S. services trade statistics with statistics produced by trading-partner countries.6
- Personal, cultural, and recreational services. This new service category consists of the following three subcategories:
- Audiovisual services, which covers production of audiovisual content, transactions in end user rights to use audiovisual content, and outright sales and purchases of audiovisual originals
- Artistic-related services, which includes the services provided by performing artists, authors, composers, and other visual artists; set, costume, and lighting design; presentation and promotion of performing arts and other live entertainment events, and fees to artists and athletes for performances, sporting events, and similar events
- Other personal, cultural, and recreational services, which includes services such as education services delivered online, remotely provided telemedicine services, and services associated with museum and other cultural, sporting gambling, and recreational activities, except those acquired by customers traveling outside their country of residence
Previously, BEA trade in services statistics included many audiovisual services in the categories of charges for the use of intellectual property and other business services. The expansions to BEA’s benchmark and quarterly surveys of selected services and intellectual property allowed BEA to separately identify and classify these transactions as personal, cultural, and recreational services per BPM6 recommendations.
Improved classification of intellectual property and other transactions. With this annual update, BEA introduced improved classifications of services categories, particularly intellectual property-related transactions, to more closely align with international statistical guidelines. Information collected on the expanded benchmark and quarterly surveys of selected services and intellectual property allows BEA to distinguish the type of rights conveyed in an intellectual property transaction. Specifically, outright sales and purchases of intellectual property can now be distinguished from conveyances of rights to use and, for certain types of intellectual property, from conveyances of rights to reproduce and distribute. Distinguishing these outright sales and purchases allows BEA to classify them in major services categories other than charges for the use of intellectual property n.i.e.
In the previous presentation of charges for the use of intellectual property, transactions were grouped by the type of intellectual property being traded, without regard to the type of right being conveyed. Chart 1 shows that in the new presentation of charges for the use of intellectual property, transactions are grouped by the type of rights being conveyed and by the type of intellectual property being traded.7 Some transactions that were previously included in charges for the use of intellectual property have been reclassified to personal, cultural, and recreational services, and others have been reclassified to the capital account in the ITAs, in accordance with the treatment recommended in BPM6.
[Click chart to expand]
Along with the reclassifications of transactions in intellectual property, BEA also reclassified other services components and made other changes to align the trade in services statistics with international guidelines including:
- Installation, alteration, and training services, previously included in maintenance and repair services n.i.e., is now classified in technical, trade-related, and other business services, a component of other business services.
- Goods exports related to projects abroad undertaken by firms performing architectural, engineering, and mining services are no longer collected on BEA’s services surveys and are no longer removed from gross revenues in calculating exports of these services. (Architectural, engineering, and mining services are included in other business services.) In addition, the foreign expenses of these firms are no longer collected on the services surveys and have been removed from the statistics of imports of these services.8
New subcategory detail. The new major services categories and reclassified intellectual property transactions described above are now reflected in the presentation of services statistics in ITA tables 1.2, 1.3, 1.4, 1.5, and 3.1. In addition to these changes, BEA has introduced new subcategory detail in table 3.1 under financial services; these subcategories reflect, in part, the introduction of FISIM and market-making services in financial services. Table B shows the new presentation of services statistics in table 3.1 compared to the previous presentation.
| Previous structure of table 3.1 | New structure of table 3.1 |
|---|---|
| Exports of services | Exports of services |
| Manufacturing services on physical inputs owned by others1 | |
| Maintenance and repair services n.i.e. | Maintenance and repair services n.i.e. |
| Transport | Transport |
| Sea transport | Sea transport |
| Freight | Freight |
| Port | Port |
| Air transport | Air transport |
| Passenger | Passenger |
| Freight | Freight |
| Port | Port |
| Other modes of transport | Other modes of transport |
| Travel (for all purposes including education) | Travel (for all purposes including education) |
| Business | Business |
| Expenditures by border, seasonal, and other short-term workers | Expenditures by border, seasonal, and other short-term workers |
| Other business travel | Other business travel |
| Personal | Personal |
| Health related | Health related |
| Education related | Education related |
| Other personal travel | Other personal travel |
| Construction | |
| Construction abroad | |
| Foreign contractors' expenditures in the United States | |
| Insurance services | Insurance services |
| Direct insurance | Direct insurance |
| Reinsurance | Reinsurance |
| Auxiliary insurance services | Auxiliary insurance services |
| Financial services | Financial services |
| Explicitly charged and other financial services | |
| Securities brokerage, underwriting, and related services | Brokerage and market-making services |
| Underwriting and private placement services | |
| Credit card and other credit-related services | |
| Financial management, financial advisory, and custody services | Financial management services |
| Financial advisory and custody services | |
| Credit card and other credit-related services | |
| Securities lending, electronic funds transfer, and other services | Securities lending, electronic funds transfer, and other services |
| Financial intermediation services indirectly measured | |
| Charges for the use of intellectual property n.i.e.2 | Charges for the use of intellectual property n.i.e. |
| Industrial processes | Franchises and trademarks licensing fees |
| Computer software | Licenses for the use of outcomes of research and development |
| Trademarks and franchise fees | Licenses to reproduce and/or distribute computer software |
| Audio-visual and related products | Licenses to reproduce and/or distribute audiovisual products |
| Other intellectual property | |
| Telecommunications, computer, and information services | Telecommunications, computer, and information services |
| Telecommunications services | Telecommunications services |
| Computer services | Computer services |
| Information services | Information services |
| Other business services | Other business services |
| Research and development services | Research and development services |
| Professional and management consulting services | Professional and management consulting services |
| Technical, trade-related, and other business services | Technical, trade-related, and other business services |
| Personal, cultural, and recreational services | |
| Audiovisual services | |
| Artistic-related services | |
| Other personal, cultural, and recreational services | |
| Government goods and services n.i.e. | Government goods and services n.i.e. |
| Imports of services | Imports of services |
| Manufacturing services on physical inputs owned by others1 | |
| Maintenance and repair services n.i.e. | Maintenance and repair services n.i.e. |
| Transport | Transport |
| Sea transport | Sea transport |
| Freight | Freight |
| Port | Port |
| Air transport | Air transport |
| Passenger | Passenger |
| Freight | Freight |
| Port | Port |
| Other modes of transport | Other modes of transport |
| Travel (for all purposes including education); | Travel (for all purposes including education) |
| Business | Business |
| Expenditures by border, seasonal, and other short-term workers | Expenditures by border, seasonal, and other short-term workers |
| Other business travel | Other business travel |
| Personal | Personal |
| Health related | Health related |
| Education related | Education related |
| Other personal travel | Other personal travel |
| Construction | |
| Construction in the United States | |
| U.S. contractors' expenditures abroad | |
| Insurance services | Insurance services |
| Direct insurance | Direct insurance |
| Reinsurance | Reinsurance |
| Auxiliary insurance services | Auxiliary insurance services |
| Financial services | Financial services |
| Explicitly charged and other financial services | |
| Securities brokerage, underwriting, and related services | Brokerage and market-making services |
| Underwriting and private placement services | |
| Credit card and other credit-related services | |
| Financial management, financial advisory, and custody services | Financial management services |
| Financial advisory and custody services | |
| Credit card and other credit-related services | |
| Securities lending, electronic funds transfer, and other services | Securities lending, electronic funds transfer, and other services |
| Financial intermediation services indirectly measured | |
| Charges for the use of intellectual property n.i.e. | Charges for the use of intellectual property n.i.e. |
| Industrial processes | Franchises and trademarks licensing fees |
| Computer software | Licenses for the use of outcomes of research and development |
| Trademarks and franchise fees | Licenses to reproduce and/or distribute computer software |
| Audio-visual and related products | Licenses to reproduce and/or distribute audiovisual products |
| Other intellectual property | |
| Telecommunications, computer, and information services | Telecommunications, computer, and information services |
| Telecommunications services | Telecommunications services |
| Computer services | Computer services |
| Information services | Information services |
| Other business services | Other business services |
| Research and development services | Research and development services |
| Professional and management consulting services | Professional and management consulting services |
| Technical, trade-related, and other business services | Technical, trade-related, and other business services |
| Personal, cultural, and recreational services | |
| Audiovisual services | |
| Artistic-related services | |
| Other personal, cultural, and recreational services | |
| Government goods and services n.i.e. | Government goods and services n.i.e. |
| Balance on services | Balance on services |
| Supplemental detail on insurance transactions: | Supplemental detail on insurance transactions: |
| Premiums received | Premiums received |
| Losses paid | Losses paid |
| Premiums paid | Premiums paid |
| Losses recovered | Losses recovered |
- n.i.e.
- Not included elsewhere
- Manufacturing services on physical inputs owned by others in the United States is a new major service category, but BEA does currently provide values for this series. Therefore, “n.a.” is shown in the tables.
- For more details on the location of certain transactions of charges for the use of intellectual property in the new structure, see Chart 1 of this article.
Expanded geographic detail. With the 2020 annual update, BEA also expanded the geographic detail on trade in services that is available on a quarterly basis. The number of countries and geographic areas presented in ITA table 3.3 (“U.S. International Trade in Services by Area and Country, Not Seasonally Adjusted Detail”) was expanded from 38 to 90.9 This expansion accelerates to a quarterly basis the publication of statistics for many trading partners that were only available on an annual basis. BEA also included services statistics for this expanded set of countries in ITA table 1.5, a newly published table (see “Introduction of new standard ITA tables” in the Other Changes in Presentation box for more information).
Expanded detail in the trade in services statistics and accelerated release of the most detailed annual statistics by country and affiliation and by service type from October to June. Once a year, BEA publishes its most detailed statistics on trade in services by service type, country and region, and affiliation. These annual statistics are drawn from the same source data as, and are fully consistent with, the trade in services statistics in the ITAs. In previous years, these detailed trade in services statistics have generally been released in October, in conjunction with a report in BEA’s monthly journal, the Survey of Current Business (Survey), on trade in services and services supplied through affiliates.10 This year, the detailed annual statistics, presented in international services tables 2.1–2.3, were released in late June and early July, instead of in October. The detailed statistics were also expanded to reflect the services presentation changes described above. In addition, several new services categories collected on the expanded benchmark and quarterly surveys of selected services and intellectual property were added to the detailed annual services statistics.
Table C shows the new structure of international services table 2.1 compared to the previous structure. International services tables 2.2 and 2.3 were updated to reflect the same service-type detail as in table 2.1; however, for some service-type categories, geographic detail is not presented, specifically postal services, road and other transport services, foreign contractors’ expenditures in the United States, rights to use audiovisual products and audiovisual originals, movies and television programming, and books and sound recordings.
| Previous structure of table 2.1 | New structure of table 2.1 |
|---|---|
| Exports of services | Exports of services |
| Manufacturing services on inputs owned by others1 | |
| Maintenance and repair services n.i.e. | Maintenance and repair services n.i.e. |
| Transport | Transport |
| Sea transport | Sea transport |
| Freight | Freight |
| Port | Port |
| Air transport | Air transport |
| Passenger | Passenger |
| Freight | Freight |
| Port | Port |
| Other modes of transport | Other modes of transport |
| Postal services | Postal services |
| Road and other transport | Road and other transport |
| Travel (for all purposes including education) | Travel (for all purposes including education) |
| Business | Business |
| Expenditures by border, seasonal, and other short-term workers | Expenditures by border, seasonal, and other short-term workers |
| Other business travel | Other business travel |
| Personal | Personal |
| Health related | Health related |
| Education related | Education related |
| Other personal travel | Other personal travel |
| Construction | |
| Construction abroad | |
| Foreign contractors' expenditures in the United States | |
| Insurance services | Insurance services |
| Direct insurance | Direct insurance |
| Reinsurance | Reinsurance |
| Auxiliary insurance services | Auxiliary insurance services |
| Financial services | Financial services |
| Explicitly charged and other financial services | |
| Securities brokerage, underwriting, and related services | Brokerage and market-making services |
| Underwriting and private placement services | |
| Credit card and other credit-related services | |
| Financial management, financial advisory, and custody services | Financial management services |
| Financial advisory and custody services | |
| Credit card and other credit-related services | |
| Securities lending, electronic funds transfer, and other services | Securities lending, electronic funds transfer, and other services |
| Financial intermediation services indirectly measured | |
| Charges for the use of intellectual property n.i.e.2 | Charges for the use of intellectual property n.i.e. |
| By type of intellectual property: | |
| Franchises and trademarks licensing fees | |
| Industrial processes | Trademarks |
| Computer software | Franchise fees |
| Trademarks | Licenses for the use of outcomes of research and development |
| Franchise fees | Licenses to reproduce and/or distribute computer software |
| Audio-visual and related products | Licenses to reproduce and/or distribute audiovisual products |
| Movies and television programming | Movies and television programming |
| Books and sound recordings | Books and sound recordings |
| Broadcasting and recording of live events | Broadcasting and recording of live events |
| Other intellectual property3 | |
| By affiliation: | |
| Unaffiliated | |
| Affiliated | |
| U.S. parents' exports to their foreign affiliates | |
| U.S. affiliates' exports to their foreign parent groups | |
| Telecommunications, computer, and information services | Telecommunications, computer, and information services |
| Telecommunications services | Telecommunications services |
| Computer services | Computer services |
| Computer software, including end-user licenses and customization | |
| Cloud computing and data storage services | |
| Other computer services | |
| Information services | Information services |
| News agency services | |
| Database and other information services | |
| Other business services | Other business services |
| Research and development services | Research and development (R&D) services |
| Work undertaken on a systematic basis to increase the stock of knowledge | |
| Provision of customized and non-customized R&D services | |
| Sale of proprietary rights arising from research and development | |
| Other R&D services | |
| Professional and management consulting services | Professional and management consulting services |
| Legal, accounting, management consulting, and public relations services | |
| Legal services | Legal services |
| Accounting, auditing, and bookkeeping services | Accounting, auditing, bookkeeping, and tax consulting services |
| Business and management consulting and public relations services | Business and management consulting and public relations services |
| Advertising and related services | |
| Advertising | Advertising services |
| Market research and public opinion polling services | |
| Trade exhibition and sales convention services | |
| Technical, trade-related, and other business services | Technical, trade-related, and other business services |
| Architectural and engineering services | Architectural, engineering, scientific, and other technical services |
| Architecture and engineering abroad | Architectural services |
| Engineering services | |
| Foreign contractors' expenditures in the United States | |
| Construction4 | |
| Construction abroad | |
| Foreign contractors' expenditures in the United States | |
| Industrial engineering | |
| Scientific and other technical services | |
| Waste treatment and de-pollution, agricultural, and mining services | |
| Waste treatment and de-pollution services | |
| Services incidental to agriculture, forestry, and fishing | |
| Mining | Services incidental to mining, and oil and gas extraction |
| Mining abroad | |
| Foreign contractors' expenditures in the United States | |
| Operating leasing services | Operating leasing services |
| Trade-related services | Trade-related services |
| Sports and performing arts5 | |
| Training services6 | |
| Other business services n.i.e. | Other |
| Personal, cultural, and recreational services | |
| Audiovisual services | |
| Audiovisual production services | |
| Rights to use audiovisual products | |
| Movies and television programming | |
| Books and sound recordings | |
| Audiovisual originals | |
| Movies and television programming | |
| Books and sound recordings | |
| Artistic-related services | |
| Other personal, cultural, and recreational services | |
| Health services | |
| Education services | |
| Heritage and recreational services | |
| Government goods and services n.i.e. | Government goods and services n.i.e. |
| Imports of services | Imports of services |
| Manufacturing services on inputs owned by others1 | |
| Maintenance and repair services n.i.e. | Maintenance and repair services n.i.e. |
| Transport | Transport |
| Sea transport | Sea transport |
| Freight | Freight |
| Port | Port |
| Air transport | Air transport |
| Passenger | Passenger |
| Freight | Freight |
| Port | Port |
| Other modes of transport | Other modes of transport |
| Postal services | Postal services |
| Road and other transport | Road and other transport |
| Travel (for all purposes including education) | Travel (for all purposes including education) |
| Business | Business |
| Expenditures by border, seasonal, and other short-term workers | Expenditures by border, seasonal, and other short-term workers |
| Other business travel | Other business travel |
| Personal | Personal |
| Health related | Health related |
| Education related | Education related |
| Other personal travel | Other personal travel |
| Construction | |
| Construction in the United States | |
| U.S. contractors' expenditures abroad | |
| Insurance services | Insurance services |
| Direct insurance | Direct insurance |
| Reinsurance | Reinsurance |
| Auxiliary insurance services | Auxiliary insurance services |
| Financial services | Financial services |
| Explicitly charged and other financial services | |
| Securities brokerage, underwriting, and related services | Brokerage and market-making services |
| Underwriting and private placement services | |
| Credit card and other credit-related services | |
| Financial management, financial advisory, and custody services | Financial management services |
| Financial advisory and custody services | |
| Credit card and other credit-related services | |
| Securities lending, electronic funds transfer, and other services | Securities lending, electronic funds transfer, and other services |
| Financial intermediation services indirectly measured | |
| Charges for the use of intellectual property n.i.e.2 | Charges for the use of intellectual property n.i.e. |
| By type of intellectual property: | |
| Franchises and trademarks licensing fees | |
| Industrial processes | Trademarks |
| Computer software | Franchise fees |
| Trademarks | Licenses for the use of outcomes of research and development |
| Franchise fees | Licenses to reproduce and/or distribute computer software |
| Audio-visual and related products | Licenses to reproduce and/or distribute audiovisual products |
| Movies and television programming | Movies and television programming |
| Books and sound recordings | Books and sound recordings |
| Broadcasting and recording of live events | Broadcasting and recording of live events |
| Other intellectual property3 | |
| By affiliation: | |
| Unaffiliated | |
| Affiliated | |
| U.S. parents' exports to their foreign affiliates | |
| U.S. affiliates' exports to their foreign parent groups | |
| Telecommunications, computer, and information services | Telecommunications, computer, and information services |
| Telecommunications services | Telecommunications services |
| Computer services | Computer services |
| Computer software, including end-user licenses and customization | |
| Cloud computing and data storage services | |
| Other computer services | |
| Information services | Information services |
| News agency services | |
| Database and other information services | |
| Other business services | Other business services |
| Research and development services | Research and development (R&D) services |
| Work undertaken on a systematic basis to increase the stock of knowledge | |
| Provision of customized and non-customized R&D services | |
| Sale of proprietary rights arising from research and development | |
| Other R&D services | |
| Professional and management consulting services | Professional and management consulting services |
| Legal, accounting, management consulting, and public relations services | |
| Legal services | Legal services |
| Accounting, auditing, and bookkeeping services | Accounting, auditing, bookkeeping, and tax consulting services |
| Business and management consulting and public relations services | Business and management consulting and public relations services |
| Advertising and related services | |
| Advertising | Advertising services |
| Market research and public opinion polling services | |
| Trade exhibition and sales convention services | |
| Technical, trade-related, and other business services | Technical, trade-related, and other business services |
| Architectural and engineering services | Architectural, engineering, scientific, and other technical services |
| Architecture and engineering in the United States | Architectural services |
| Engineering services | |
| U.S. contractors' expenditures abroad | |
| Construction4 | |
| Construction in the United States | |
| U.S. contractors' expenditures abroad | |
| Industrial engineering | |
| Scientific and other technical services | |
| Waste treatment and de-pollution, agricultural, and mining services | |
| Waste treatment and de-pollution services | |
| Services incidental to agriculture, forestry, and fishing | |
| Mining | Services incidental to mining, and oil and gas extraction |
| Mining in the United States | |
| U.S. contractors' expenditures abroad | |
| Operating leasing services | Operating leasing services |
| Trade-related services | Trade-related services |
| Sports and performing arts5 | |
| Training services6 | |
| Other business services n.i.e. | Other |
| Personal, cultural, and recreational services | |
| Audiovisual services | |
| Audiovisual production services | |
| Rights to use audiovisual products | |
| Movies and television programming | |
| Books and sound recordings | |
| Audiovisual originals | |
| Movies and television programming | |
| Books and sound recordings | |
| Artistic-related services | |
| Other personal, cultural, and recreational services | |
| Health services | |
| Education services | |
| Heritage and recreational services | |
| Government goods and services n.i.e. | Government goods and services n.i.e. |
| Balance on services | Balance on services |
| Memoranda: | Addenda: |
| Exports of services by affiliation: | Exports of services by affiliation: |
| Unaffiliated | Unaffiliated |
| Affiliated | Affiliated |
| U.S. parents' exports to their foreign affiliates | U.S. parents' exports to their foreign affiliates |
| U.S. affiliates' exports to their foreign parent groups | U.S. affiliates' exports to their foreign parent groups |
| Imports of services by affiliation: | Imports of services by affiliation: |
| Unaffiliated | Unaffiliated |
| Affiliated | Affiliated |
| U.S. parents' imports from their foreign affiliates | U.S. parents' imports from their foreign affiliates |
| U.S. affiliates' imports from their foreign parent groups | U.S. affiliates' imports from their foreign parent groups |
| Supplemental detail on insurance transactions:7 | |
| Premiums received | |
| Direct insurance | |
| Reinsurance | |
| Losses paid | |
| Direct insurance | |
| Reinsurance | |
| Premiums paid | |
| Direct insurance | |
| Reinsurance | |
| Losses recovered | |
| Direct insurance | |
| Reinsurance |
- n.i.e.
- Not included elsewhere
- Manufacturing services on physical inputs owned by others in the United States is a new major service category, but BEA does currently provide values for this series. Therefore, “n.a.” is shown in the tables.
- For more details on the location of certain transactions of charges for the use of intellectual property in the new structure, see Chart 1 of this article.
- Transactions for the rights to use and rights to reproduce and distribute other intellectual property have been recorded in licenses for the use of outcomes of research and development.
- Construction has been recorded as a new major services category.
- Statistics for sports and performing arts have been recorded as artistic-related services under personal, cultural, and recreational services.
- Statistics for training services have been recorded as education services under other personal, cultural, and recreational services.
- Supplemental detail on insurance transactions is now published in international services table 2.1.
Along with its international services tables 2.1–2.3 using standard trade in services classifications, BEA also publishes trade in information and communications technology (ICT) and potentially ICT-enabled services in international services tables 3.1–3.3. Statistics on trade in ICT and potentially ICT-enabled services use alternative aggregations, based on international guidelines, of certain standard trade in services categories. Beginning with statistics for 1999, BEA utilized the expanded detail collected for the trade in services statistics to update, at the same time as the 2020 update of international services tables 2.1–2.3, its statistics on trade in potentially ICT-enabled services based on more granular services categories.
These detailed annual statistics on trade in services by service type and partner country and on trade in ICT and potentially ICT-enabled services will be discussed in greater detail along with statistics on services supplied through affiliates of multinational enterprises in an article in the upcoming October 2020 issue of the Survey.
Other Methodological, Source Data, and Presentational Improvements
Improvements to estimation procedures for statistics based on BEA’s trade in services surveys (universe estimation)
BEA has reprocessed and revised the survey-based portion of its statistics of international transactions in maintenance and repair services; construction; insurance services; financial services; charges for the use of intellectual property; telecommunications, computer, and information services; other business services; and personal, cultural, and recreational services. These revisions affect data from 2006 forward. By reprocessing these statistics, BEA has introduced refinements to the estimation process and increased the consistency of its estimates across all periods. Most significantly, BEA has substantially improved its procedures for estimating unreported data.
In producing statistics for trade in services, BEA estimates transactions for companies that do not report on its surveys—either because they do not meet the threshold for reporting on nonbenchmark surveys and thus are not required to report or because they do not report in a timely manner. It also estimates detailed transactions for companies that are only required to report transactions on an aggregate basis. These estimates allow BEA to construct a data set, consisting of a combination of reported data and estimated data, that includes every company in the (known) universe of services traders. BEA calls the production of estimates needed to construct this data set “universe estimation.”
As part of universe estimation, BEA estimates unreported transactions by carrying forward past reporting based on the collective growth rates of companies that do report. However, to limit the impact of very large changes in reported values on the growth rates that are applied to nonreporting companies, the growth rates had previously been restricted to a narrow range. In the 2020 annual update, BEA implemented new procedures that are expected to improve the accuracy of its estimates of unreported transactions by relaxing the range of growth rates and using multiple criteria to limit the impact of extreme changes. Rather than simply limiting the range of allowable growth rates, large individual-company changes in the sample of reported transactions used to calculate growth rates are first censored. The growth rates calculated from the resulting modified sample are still restricted, but the allowable range is much wider than the range that was used previously. In addition, the use of adjustments to more closely align estimates with nonsurvey information, which were sometimes applied to the calculated growth rates, has been discontinued, thereby allowing estimates to be based more directly on reported data.
BEA has also increased the degree of flexibility used in universe estimation in revising estimates of unreported data by carrying back information obtained in subsequent periods. Prior to the 2020 annual update, BEA had in only very limited cases revised estimates of unreported data based on subsequent reporting. Most typically, such cases involved revising back 1 to 3 years based on reporting on a benchmark survey or the integration of a large change in reported values from a specific company. For the 2020 annual update, where a gap in reporting exists for any company, BEA developed a method to systematically reestimate all unreported transactions based on that company’s own reported transactions before and after the gap and on the collective growth rate of companies that reported during the gap. For companies that reported for the first time on a benchmark survey, a similar method was used to estimate prior-period transactions while scaling for the likelihood that the reporter did not have any such trade in services (or did not exist at all) in a given prior period.
BEA also estimates during universe estimation unreported detail for companies with relatively small trade in services transactions that are only required to report their total values of exports and imports. Historically, BEA allocated such reported totals across service types and across affiliations and countries of trading partners according to the distribution for all companies reflected in reported data. BEA has now introduced a more targeted approach to estimate unreported detail that relies on other information reported by the company, such as responses to questions on the services types traded and the company’s primary industry, resulting in more accurate statistics on trade in services by type.
Improved methodology and source data for transport services
Air passenger services. Air passenger services occurs when a foreign resident is transported internationally on a flight operated by a U.S. carrier (U.S. exports) or when a U.S. resident is transported internationally on a flight operated by a foreign carrier (U.S. imports). Trade in air passenger transport has historically been estimated by multiplying the number of air passengers on such flights by estimates of average fares. The numbers of foreign resident and U.S. resident air passengers are proxied by the numbers of traveling foreign citizens and U.S. citizens using data from U.S. Customs and Border Protection (CBP) of the U.S. Department of Homeland Security (DHS). Average fares had been based on data from the Survey of International Air Travelers (SIAT), which is conducted by the National Travel and Tourism Office (NTTO) of the International Trade Administration in the U.S. Department of Commerce. The resulting estimates were complemented with reported values from BEA mandatory surveys of U.S. and foreign airline operators that measured interline settlements (transactions between airlines reflecting payment for services rendered under cooperative agreements such as codesharing), and for U.S. exports, that is, revenue earned by U.S. airlines for transporting foreign passengers between foreign ports. These complementary values represented portions of air passenger transport not captured in the CBP and SIAT data.
For the 2020 update, BEA has enhanced its estimation methodology and replaced and refined its data sources for air passenger services statistics beginning with 1999. Average fares are now based on data from the U.S. Department of Transportation (DOT) Origin and Destination Survey for exports and data from the Airlines Reporting Corporation (ARC) for imports. These data contain ticket-level information on tens of millions of passengers' travel patterns (for example, information on airports, flight connections, and carriers), allowing highly granular estimation of average fares.
Use of the more detailed source data allows BEA estimates to more accurately reflect the nationality of the carriers that operate each leg of a passenger's itinerary. Under the previous methodology, the fare for a passenger's full itinerary was allocated to a single country based on the nationality of the air carrier that operated the leg that transported the passenger across the U.S. border. The full itinerary fare paid by a foreign passenger crossing the U.S. border on a leg operated by a U.S. carrier was attributed to U.S. exports. Similarly, the full itinerary fare paid by a U.S. passenger crossing the border on a foreign-operated leg was attributed to imports from the country of the carrier of that leg. This simple allocation method did not account for the fact that carriers from other countries may have operated other legs of the itinerary. Consequently, it didn’t reflect the fact that trade with multiple countries may occur on the same itinerary or the fact that only some legs of an itinerary may represent international trade. Neither did it reflect the fact that some trade may have occurred on itineraries in which U.S. passengers crossed the border on U.S.-operated legs or in which foreign passengers crossed the border on foreign-operated legs.
Under the new methodology, BEA allocates the portion of each foreign passenger’s flight itinerary (based on mileage) that is operated by U.S. carriers to exports without regard to whether a U.S. carrier operates the leg crossing the U.S. border. Likewise, it allocates the portion of each U.S. passenger’s flight itinerary that is operated by foreign carriers to imports. BEA makes these allocations using observed flight patterns from the DOT and ARC data matched to airport and carrier information from the data on numbers of passengers.
This more precise allocation procedure enables BEA to attribute imports to the appropriate countries according to the residencies of the foreign carriers and to capture interline settlements in estimated average fares instead of relying on survey data from airline operators.11 In addition, the more detailed data allow BEA to more accurately allocate exports to the countries of the foreign passengers. The country of a foreign passenger had previously been assigned primarily based on the passenger’s last foreign port immediately before entering the United States. While the actual country of residency of foreign passengers is not directly available in any of BEA’s source data, under the new methodology, the country of each passenger is proxied using the origin point of the itinerary, improving the geographic attribution of exports.
Additionally, BEA expanded its coverage of passengers' expenditures to include certain nonticket fees (such as baggage fees and reservation fees), based on data from the DOT Bureau of Transportation Statistics, and it incorporated passenger count data that CBP began collecting under an improved electronic method in July 2010.
Itineraries of foreign passengers traveling between two foreign ports that do not include a crossing of the border but that include operation of one or more legs by a U.S. carrier should be included in air passenger services exports. Similarly, international itineraries of U.S. passengers that are served by foreign carriers but don’t include a U.S. border crossing should be included in imports. However, these itineraries are not accurately captured by any of BEA’s source data, so they continue to be an omission in the statistics.
From 1999 to 2013, exports of air passenger services were revised up for more years than they were revised down; downward revisions were more frequent starting with 2014. Imports were revised up in all years and in nearly every quarter.
Sea freight and port services. BEA revised exports and imports of both sea freight and sea port services12 using new source data on vessels that transport goods to and from the United States. In particular, BEA used name matching techniques to merge vessel names recorded in CBP data on goods exported from and imported to the United States by sea with a global database of vessels from IHS Markit. In doing so, BEA obtained additional information on the exporting and importing vessels, such as ship type and the nationalities of the operating companies. This has resulted in revised estimates for total transport services provided by either U.S. operators (which resulted in revisions to sea freight exports and sea port imports) or foreign operators (which resulted in revisions to sea freight imports and sea port exports). Total trade in sea freight and sea port services were revised beginning with statistics for 2008, and country-level estimates of sea freight and sea port services were revised beginning with statistics for 1999. For most years over the 2008 to 2019 time period, sea freight exports were revised upward; sea port exports, sea freight imports, and sea port imports were all revised downward.
Air freight and port services. BEA collects quarterly information on air freight and air port services through mandatory surveys of U.S. and foreign airlines. In 2018, BEA improved its survey coverage by expanding its outreach efforts, resulting in an increased number of airlines reporting data. In the 2020 annual update, BEA used the new survey data along with backcasting methods for years prior to 2018 to revise exports and imports of air port services and exports of air freight services. Exports of air freight services and imports of air port services were revised beginning with statistics for 2006 and exports of air port services were revised beginning with statistics for 1999. For air freight services, revisions were relatively small, with upward revisions for each year from 2010–2013 and small downward revisions from 2014–2019. Revisions in air port services, however, were larger. Air port services exports were revised up every year from 1999–2019. Air port services imports were revised up each year from 2013–2015 and were revised down each year from 2016–2019.
Improved methodology and source data for travel services
Travel (for all purposes including education) in the ITAs records expenditures on goods and services by foreign residents visiting the United States (U.S. exports) and by U.S. residents visiting other countries (U.S. imports). They include both business and personal travel.
Other business and other personal travel. Combined, other business travel and other personal travel compose a subaggregate measure of travel (for all purposes including education) that excludes expenditures by border, seasonal, and other short-term workers and expenditures by travelers whose primary purpose for travel is education or health. In 2019, other business travel and other personal travel together accounted for 72 percent of U.S. travel exports and for 90 percent of U.S. travel imports.
For all countries other than Canada and Mexico and excluding cruise-related travel expenditures, this subaggregate component of the travel account is derived by multiplying the number of travelers by a measure of their average expenditures.13 The number of travelers is obtained from NTTO and is based on data collected by CBP. Average expenditures are based on data obtained from the SIAT.14 Beginning with statistics for 1999, BEA improved its estimates of the number of foreign travelers entering the United States, the number of U.S. travelers going abroad, and average expenditures.
The number of foreign travelers entering the United States was improved to better approximate the number of other business and other personal travelers. In calculating this number, BEA must distinguish foreign visitors traveling for purposes other than education, health, and short-term work from other foreign visitors counted by CBP. It does so by using designations that reflect each traveler's basis for admission to the United States. BEA counts of foreign travelers to the United States were previously calculated using a set of classes of admission that did not fully align with the BEA definition of other business and other personal travel. BEA worked with NTTO to obtain more detailed data on counts of travelers by class of admission, and BEA refined its traveler counts to exclude all education-related travelers and include additional classes of admission that it considers to be other personal or other business travelers. BEA also introduced an adjustment to remove an estimate of the number of health-related travelers, which cannot be distinguished by class of admission, that is derived from the health-related travel estimates described below.
The estimate of the number of U.S. other business and other personal travelers going abroad was improved to exclude an estimate of education-related travelers. Source data used to approximate the number of U.S. travelers are counts of all U.S. citizens who depart the United States on international flights. Previously, this estimate did not include any adjustments to remove travelers traveling for the purpose of education, health, or short-term work, as the number of travelers data do not include any information that would reflect the purpose of travel. BEA has introduced adjustments to remove an estimate of the number of education-related travelers using country-level shares derived from information from the SIAT on the share of trips taken for educational purposes and an estimate of the number of health-related travelers.
Average expenditures were refined by introducing improvements in identifying the relevant sample for estimating average expenditures, in treating missing data and outliers, and accounting for a redesign of the SIAT in 2012 that led to better estimates of the level of reported expenditures. BEA also carried back for earlier years changes introduced during the 2016 annual update that incorporate a moving average of the quarterly estimates. Use of the moving average reduces the variability introduced by small samples.
Beginning with statistics for 1999, BEA refined its estimates of other business and other personal travel for Canada. Other business and other personal travel statistics for Canada are based on information provided to BEA by Statistics Canada. BEA has incorporated revised statistics provided by Statistics Canada and updated its methodology to remove an estimate of expenditures by border, seasonal, and other short-term workers from other business travel spending, which are included, but not separately identified, in the statistics provided by Statistics Canada.
Also beginning with statistics for 1999, BEA improved its allocation of the subaggregate measure of travel—other business and other personal travel—to the separately published components of other business travel and other personal travel. Previously, the subaggregate component was allocated to other business travel and other personal travel using shares derived from information from the SIAT for all countries. For Canada, BEA now uses the allocation provided by Statistics Canada. For all other countries, BEA improved its calculation of shares derived from the SIAT to better reflect the share of spending, rather than the share of travelers, and to reduce variability introduced by small sample sizes.
From 1999 to 2019, the revised estimates of the subaggregate measure of other business and other personal travel generally grew more slowly than the previously published estimates. Since 1999, the share of other business travel in this subaggregate measure has declined. The revised statistics show a less rapid decline in this share.
Education-related travel. Education-related travel includes all expenditures by travelers whose primary purpose for travel is education. In 2019, education-related travel exports accounted for 23 percent of U.S. travel exports and for 9 percent of U.S. travel imports.
Previously, BEA estimated education-related travel by multiplying the number of foreign students in the United States and the number of U.S. students studying abroad, which were obtained from the Institute for International Education's (IIE) annual report, “Open Doors” (OD), by estimates of students' average expenditures, which were based on data from the U.S. Departments of Education and Labor.
For the 2020 annual update, BEA either replaced or enhanced its data sources for both the number of students and average expenditures. For exports, BEA now calculates the number of students using data from the DHS Student and Exchange Visitor Information Service (SEVIS). These data cover all foreign students in the United States, expanding coverage to include students in primary and secondary schools, students’ dependents (whose spending is included in education-related travel), and vocational students, all of whom are outside the OD report's coverage. They also allow BEA to exclude former students performing post-completion Optional Practical Training, a program that allows them to remain in the United States on their educational visas after graduation and work in their fields of training. These former students were included in data from the OD report, but they fall outside the scope of education-related travel. The net effect of these coverage improvements is slightly higher student counts in all years (1999–2019).
For imports, BEA continues to use counts of students enrolled in study abroad programs through U.S. schools from the OD report, but it has expanded coverage of students to include post-secondary students directly enrolled in foreign schools based on counts from the United Nations Educational, Scientific and Cultural Organization Institute of Statistics and IIE’s Project Atlas database. For countries not covered by these data sources, BEA estimates the number of directly enrolled students using data from the Educational Commission for Foreign Medical Graduates, from certain Caribbean medical institutions, and from other sources. BEA’s estimates of education-related travel imports do not cover primary and secondary students because of source data limitations. The net effect of these improvements in coverage is substantially higher student counts in all years.
For both exports and imports, BEA now uses SEVIS data on foreign students' expenditures in the United States to estimate average expenditures. These administrative data reflect student-reported expenditures on tuition, living expenses, spending on dependents, and other costs. For exports, the SEVIS data provide information on expenditures by students' countries of residency. For imports, average expenditures from SEVIS are adjusted for differences in general price levels between the United States and foreign countries based on data from the Penn World Table. They are also adjusted to reflect higher spending rates of U.S. students studying abroad than of the direct enrollees who make up the majority of students in the SEVIS data.
Average expenditures based on SEVIS data are slightly lower than the average expenditures underlying BEA’s previously published estimates. For imports, changes to the method used to account for differences in price levels further increased the gap between estimates under the new and old methodologies. For education-related travel estimates overall (accounting for both number of students and average expenditures), revised exports are comparable to or lower than previously published estimates for recent years, while imports were revised up over the period.
Health-related travel. Health-related travel measures expenditures of travelers whose primary purpose for travel is health. Health-related travel is often called medical tourism. In 2019, health-related travel exports accounted for 0.5 percent of U.S. travel exports and for 0.6 percent of U.S. travel imports.
BEA's previous estimates of health-related travel exports were based on an outdated BEA study of medical treatment provided to foreign residents in the United States. Estimates of health-related travel imports were based on BEA estimates of expenditures by U.S. residents who received health care while traveling in selected countries. These methodologies were originally developed to measure medical services, the predecessor account to health-related travel, which was part of the services accounts (but not in travel) prior to the 2014 comprehensive restructuring of the ITAs.15
The definition of health-related travel closely overlaps that of medical services; in particular, both include expenditures on medical care by those travelers traveling for health purposes. Compared to medical services, however, health-related travel includes spending by such travelers on things other than medical care (such as food, lodging, and sightseeing) but it excludes spending on medical care by travelers whose primary purpose for travel is for something other than health.16
To more closely align the estimates of health-related travel with its definition and to incorporate more up-to-date data sources that cover countries more comprehensively, BEA has adopted a new methodology for estimating health-related travel. The new methodology was used to estimate both exports and imports beginning with statistics for 1999. For all countries except Canada and Mexico, the methodology uses the same basic approach—multiplying average expenditures by a count of travelers—as used for the other business travel and other personal travel subaggregate.17 Likewise, the estimates are based on the same source data as that subaggregate: average health-related travel expenditures are derived from the SIAT, and a measure of the number of travelers is derived from the CBP-based traveler-count data obtained from NTTO. Data from the SIAT are used to estimate the share of traveler counts from NTTO that are health-related travelers. For Canada and Mexico, estimates of health-related travel are based on health-related travel estimates for a comparison group of countries because the SIAT data do not cover travel between the United States and Canada and only covers a nonrepresentative portion of travel between the United States and Mexico.
The number of SIAT respondents that report health as their primary purpose for travel is relatively small. Consequently, the data on expenditures of such travelers are thin, particularly at the level of individual countries. To address this thinness, BEA smooths health-related travel estimates over a period of 25 quarters at the aggregate level and over longer periods to allocate expenditures across countries. For countries with relatively low levels of health-related travel trade with the United States, BEA also utilizes regional averages. Data users should recognize that, particularly at the level of trade with individual countries, the estimates are better suited for assessing the share of health-related travel in total travel or for identifying long-term trends in health-related travel than for examining period-to-period fluctuations in health-related travel.
The revised statistics of health-related travel are somewhat comparable to the previously published statistics for the earliest years revised, but they grow much more slowly each year (or, for exports, decline in earlier years). Consequently, health-related travel statistics were revised down considerably for more recent years.
Expenditures by border, seasonal, and other short-term workers. Expenditures by border, seasonal, and other short-term workers are estimated as a share of compensation to workers temporarily residing in the United States. Compensation to foreign professionals—a component of primary income—is estimated by multiplying the number of workers based on U.S. State Department data on visas issued to foreign professionals by an estimate of average wage rates. Beginning with statistics for 1999, BEA improved its estimate of compensation paid to foreign professionals by expanding the set of visas that are classified as applying to foreign professionals. Along with workers in specialty occupations (H–1B visa holders), the number of workers now includes intracompany transferees (L visa holders), cultural exchange workers (Q visa holders) and temporary religious workers (R visa holders). The expansion resulted in more accurate estimates of the expenditures of workers covered in this account.
Related improvements to compensation of employees and private transfer payments. In addition to the improvements to compensation of foreign professionals described above, improvements to BEA statistics of education-related travel exports led to revisions to primary income and secondary income for statistics starting in 1999. Revisions in the compensation of employees component of primary income were in wages paid to foreign students while studying in the United States. Revisions in the private transfers component of secondary income were in transfers, such as scholarships, to foreign students while studying in the United States. Both of these measures are estimated as shares of education-related travel exports, with the shares based on data from IIE on foreign students’ sources of funding for study in the United States, and thus reflect the revisions to education-related travel exports outlined above. In addition, BEA refined the way it identifies the types of students receiving compensation and transfers and the sources of these payments.
Introduction of measures of implicitly priced financial services and related changes to primary income
Financial firms generate revenue not only from explicitly charging for services but also implicitly through spreads between the interest rates (or prices) that they offer on various products. With this annual update, BEA has introduced two measures of implicitly priced services—financial intermediation services indirectly measured (FISIM) and market-making services—which are measured by the margins on buying and selling financial securities. The introduction of these implicit financial services closes a gap in the ITAs.
FISIM services. FISIM measures the implicit service component of deposit-taking and lending activity of banks. Banks are compensated for their services by paying a lower rate on deposits than they charge on loans. In the 2020 annual update, BEA introduced estimates of trade in FISIM in the ITAs beginning with statistics for 1999. Although estimates of FISIM were included in the ITAs for the first time with this annual update, rest-of-world FISIM estimates for exports, but not imports, were already included in the BEA National Income and Product Accounts (NIPAs). The methodology developed for the ITA trade in FISIM estimates draws on some data sources used to estimate NIPA FISIM, and the ITA estimates will be used going forward as the NIPA rest-of-world estimates.18
The methodology used to estimate trade in FISIM identifies an appropriate monetary deposit rate paid, a monetary lending rate charged, and a risk-free cost of funds called the reference rate that generally falls between the two other rates. The implicit services supplied to borrowers are estimated as the balance of loans to bank customers multiplied by the difference between the monetary lending rate charged to customers and the reference rate. The implicit services supplied to depositors are estimated as the balance of deposits held by banks for customers multiplied by the difference between the reference rate and the monetary deposit rate. The FISIM reference rate is based on the 5–year Treasury rate. The monetary lending rate is a risk-adjusted commercial and industrial (C&I) lending rate. Both of these rates are the same as those used in the NIPAs. The monetary deposit rate is a modified version of the deposit rate used in the NIPAs that removes savings deposits from the calculation, as such deposits are relatively uncommon in cross-border activity. The C&I lending and deposit rates are book rates calculated from the quarterly regulatory call reports banks submit to the Federal Deposit Insurance Corporation (FDIC). The trade in FISIM methodology takes banks as the primary producers of FISIM, so no FISIM is estimated unless one of the parties is a bank. Interbank activity is assumed to occur at the reference rate, so no FISIM is generated when both parties are banks. Similarly, intracompany activity is assumed to occur at the reference rate, so no FISIM is generated when the two transacting parties are related.
Exports of FISIM are generated on loans made by U.S. banks to foreign-resident customers and on deposits held by U.S. banks for foreign-resident customers. Imports of FISIM are generated on loans made by foreign-resident banks to U.S. customers and on deposits held by those banks for U.S. customers. These cross-border loan and deposit balances are estimated using the B and C forms (filed, respectively, by banks and other financial firms and by nonfinancial firms) of the Treasury International Capital (TIC) reporting system. Import estimates are further supplemented by data covering several key trading partner countries from statistical offices in the partner countries and elsewhere. These partner country data cover balances between foreign banks and their U.S. nonbank customers.
BEA’s trade in FISIM methodology separately identifies FISIM generated from repurchase agreements and applies a separate set of interest rates based on the Federal Reserve’s Secured Overnight Financing Rate. Repurchase agreements are generally of a shorter term than traditional bank loans and deposits, so a more relevant set of short-term interest rates is applied.
FISIM is presented in ITA table 3.1 as a separate component of financial services. A subaggregate consisting of the other components of financial services is published as “explicitly charged and other financial services.”
FISIM-related changes to primary income. BEA’s methodology for estimating other investment interest income receipts and payments on loans and deposits was changed by replacing the monetary interest rates formerly used with the reference interest rates that are now used to estimate FISIM. For transactions covered by the FISIM methodology, when loans or deposits between banks and their nonbank customers generate exports or imports of FISIM, or for transactions not covered by the FISIM methodology because the parties are both banks or are related, the appropriate rate to use to estimate interest income is the reference rate. Interest computed using the reference rate is pure interest. Interest computed using the monetary deposit or monetary loan rate is monetary interest.
These concepts are illustrated in chart 2. Monetary interest paid by a nonbank customer on a bank loan is composed of FISIM and pure interest (left panel on “Borrower services” in chart 2). Conversely, pure interest earned by a nonbank customer on a bank deposit is composed of FISIM and monetary interest (right panel on “Depositor services”). Previously, BEA estimates of other investment interest income on loans and on deposits only measured monetary interest. To align BEA estimates of income with the new estimates of FISIM, BEA introduced a methodology to use pure interest for these estimates of other investment interest income.
Beginning with statistics for 1999, BEA replaced the monetary interest rates formerly used in the income methodology with monetary loan and deposit rates used in the FISIM estimates, which are based on interest paid and received by U.S. banks reported on the FDIC quarterly call reports. BEA then replaced monetary interest with pure interest for interest paid and earned by nonbank customers on bank loans and deposits in estimates of other investment interest income. To maintain information on monetary interest, other investment interest income receipts and payments before adjusting for FISIM are presented as addenda to ITA table 4.1.
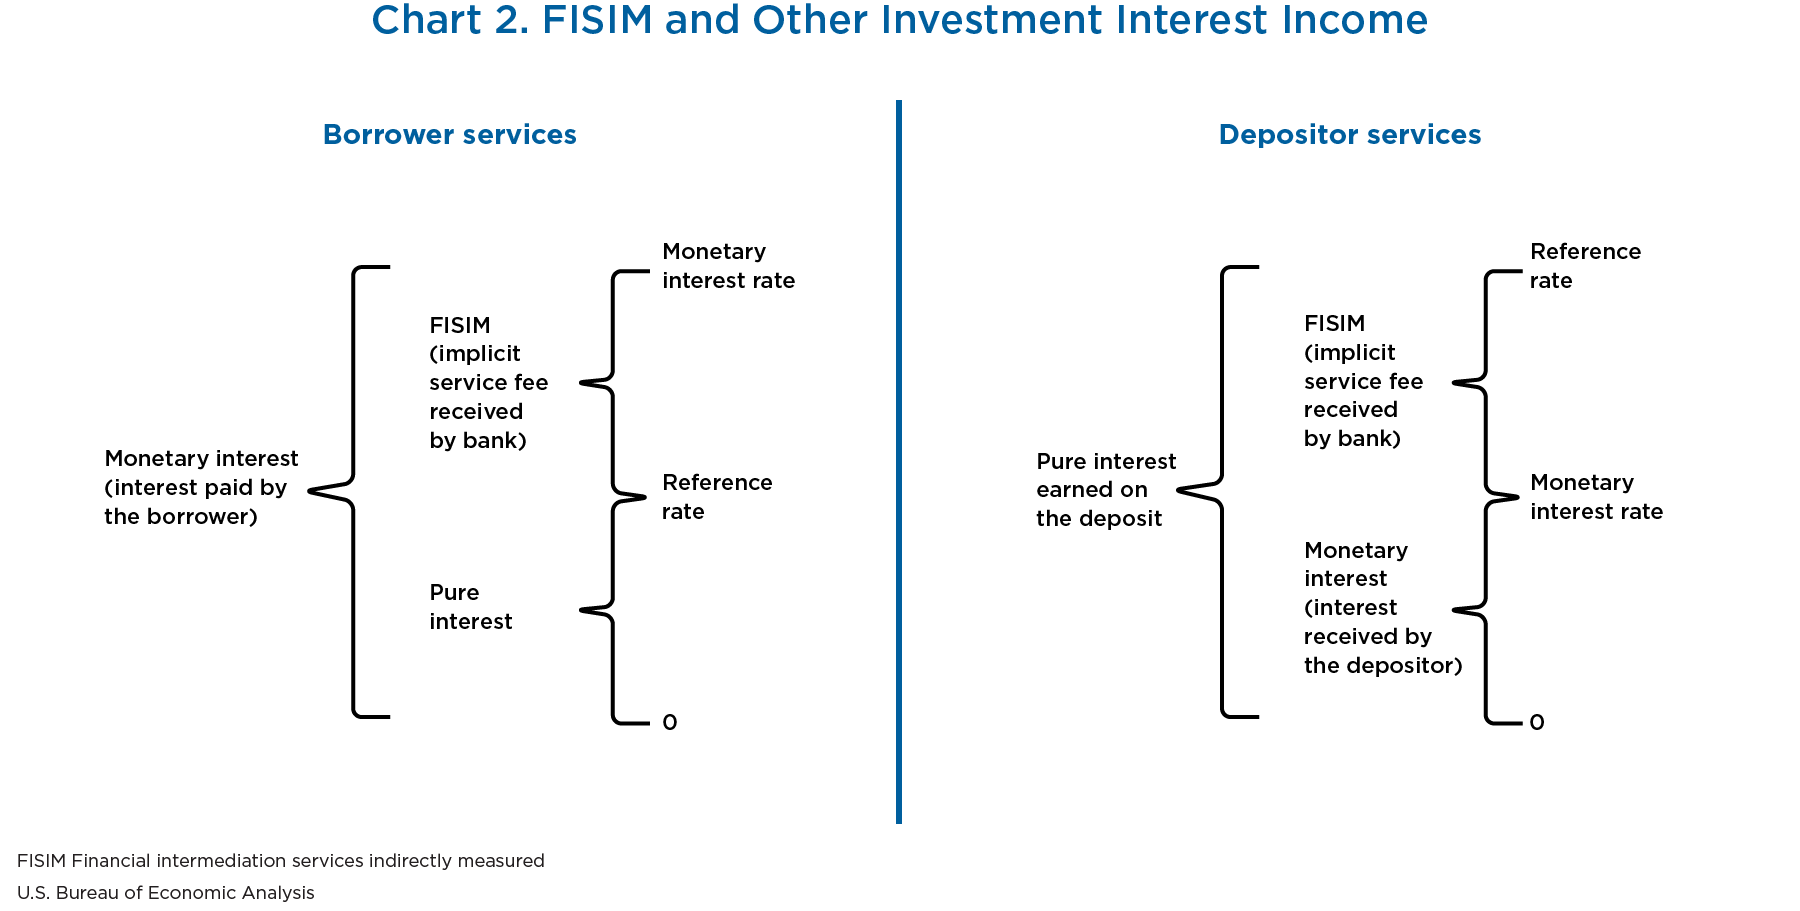
[Click chart to expand]
Some deposits and loans do not generate FISIM because they are provided by nonbank institutions. For example, securities brokers provide loans and deposit-like instruments, known as brokerage balances, to their customers. FISIM is not estimated for financial intermediation by securities brokers. The interest paid by customers to securities brokers and the interest received by customers from securities brokers is monetary interest and continues to be estimated using the monetary interest rates.
The new FISIM methodology also simplifies the estimation of FISIM and interest on foreign currency denominated deposit and loan positions by applying U.S. dollar interest rates from the NIPAs to these positions, which are reported as U.S. dollar equivalent positions. The U.S. dollar interest rates are generally higher than foreign currency rates previously applied. Foreign currency-denominated positions are quite small relative to U.S. dollar-denominated positions, and no single foreign currency dominates the reported positions.
This simplification is also used in estimating interest on foreign currency denominated short-term securities positions because these positions are also quite small relative to U.S. dollar positions. This results in revisions to portfolio investment interest income beginning with statistics for 1999. For 1999–2019, annual portfolio investment income receipts were revised upward an average of $187 million (2.9 percent) and annual portfolio investment income payments were revised upward an average of $32 million (0.3 percent) as a result of this methodology change.
Market-making services. Like the FISIM revenues of banks, financial firms can generate revenue by taking advantage of a spread when acting as principal to complete a customer's transactions, in addition to charging explicit fees for executing security transactions (a brokerage service). Firms performing this function are known as dealers or market makers. The revenue earned performing this function can be understood as an implicit service fee for the liquidity (market-making) services by these firms. These implicit service fees were not previously recorded in the ITAs.
Beginning with statistics for 1999, BEA has for the first time included estimates of market-making services, as measured by margins on buying and selling financial securities, in its statistics on trade in financial services. Exports of market-making services are generated by dealers in the United States on transactions in debt and equity with foreign-resident counterparties. Imports are generated when foreign dealers trade with U.S-resident counterparties. BEA’s methodology for estimating market-making services assumes that U.S. market makers trade in U.S. securities and foreign market makers trade in securities issued in their countries, as customers tend to seek out brokers in the location of the security to execute transactions.
For market-making services on equity securities, spreads are estimated for U.S. securities and for securities from Canada, the United Kingdom, Japan, Hong Kong, and a European composite using real-time quote data from financial markets obtained from Bloomberg. Spread data are averaged by market capitalization for a sample of the most traded equities. The spread applied to exports for 1999 to 2019 ranges from just under 0.02 percent to nearly 0.09 percent, with the higher spreads generally holding in earlier years and the lower spreads generally holding in later years. Spreads applied to imports vary by country and cover a larger range than the export spread. Spreads range from approximately 0.01 percent to 0.40 percent for 1999 to 2019. In 2019, spreads ranged from approximately 0.03 percent to 0.17 percent. For securities of countries other than those listed above, a volume-weighted average of these spreads is applied. The trends for equity spreads serves as a proxy for the trend in spreads for other traded securities.
For debt securities, spreads are assumed to be proportional to the assumed commission fees used in BEA’s existing methodology for estimating brokerage services related to debt securities. Different spreads are used for U.S. Treasury bonds & notes, U.S. government agency bonds, U.S. corporate bonds, and foreign bonds; the spreads range from 0.002 percent to 0.0095 percent. As is generally the case for equity spreads, higher spreads are applied to imports than to exports.
Transactions volumes for both cross-border debt and equity transactions to which these spreads are applied come from TIC S data (“Purchases and Sales of Long-Term Securities by Foreign-Residents”). The volume of equities and debt securities in these data serve as proxies for the level and geographic locations of margin-generating activity in all securities. The proportion of these volumes that generate margins is estimated using a comparison of the TIC data to explicit equity commissions collected on BEA surveys.
Improved methodology for general government interest income payments to include income from inflation adjustments associated with Treasury Inflation Protected Securities (TIPS)
A TIPS is a marketable security in which principal is adjusted to reflect changes in the Consumer Price Index (CPI). The principal of a TIPS increases when the CPI increases, and it decreases when the CPI decreases. This change in principal is called inflation compensation. The income gains or losses accrued from the inflation compensation over the term of a TIPS are payable when it matures. International statistical guidelines recommend that income gains or losses accrued from the inflation compensation on inflation-indexed securities be included in estimates of portfolio investment income in the quarter they happen (rather than when they are paid).
Beginning with statistics for 1999, BEA includes inflation compensation gains and losses accruing to foreign holders of U.S. TIPS in portfolio investment interest income payments in the quarter they happen. Previously, these gains and losses were not included in portfolio investment interest income payments.
A TIPS also pays interest based on a coupon rate, like other U.S. Treasury bonds. The coupon interest payments on TIPS have been included in portfolio investment interest income payments by the general government since TIPS were introduced. In the 2020 annual update, the inflation compensation is now also included in the same category. The inclusion of TIPS income resulted in an upward revision to government interest income payments.
Reclassification of investment grants from secondary income to the capital account
Beginning with statistics for 1999, BEA has reclassified investment grants from secondary income in the current account to the capital account. Previously, all U.S. government grants to nonresidents were included in the secondary income account as current transfers. However, some of these are investment grants that, according to international statistical guidelines, should be classified in the capital account. Recent BEA research into the details of a number of U.S. government grant programs identified several that are partly or wholly capital investment in nature. This reclassification includes (1) investment grants in cash that are for purposes of gross fixed capital formation and are often tied to specific investment projects, such as large construction projects, and (2) investment grants in kind, which consist of transfers of transport equipment, machinery, military weapons and equipment, and other equipment by governments to nonresident entities. Reclassification of the two investment grant types resulted in an average upward revision to capital account payments of $6.1 billion per year for the years 1999–2019.
New subcategory detail and other improvements to secondary income (current transfers)
New subcategory detail. With this annual update, BEA expanded ITA table 5.1 to include new subcategory detail for both receipts and payments of secondary income (current transfers). These changes introduce more symmetry in the presentation of receipts and payments and bring the presentation of secondary income statistics into close alignment with the presentation recommended in international guidelines. For example, in the new presentation, secondary income receipts include general government transfer receipts (previously named U.S. government transfers) along with four subcomponents: (1) taxes on income, wealth, and such; (2) international cooperation; (3) fines and penalties; and (4) other general government receipts. Table D compares the new structure of table 5.1 to the old structure.
| Previous structure of table 5.1 | New structure of table 5.1 |
|---|---|
| Secondary income (current transfer) receipts | Secondary income (current transfer) receipts |
| U.S. government transfers | General government transfer receipts |
| Taxes on income, wealth, etc. | |
| International cooperation | |
| Fines and penalties | |
| Other general government transfer receipts | |
| Private transfers | Private transfer receipts |
| Insurance-related transfers | |
| Fines and penalties | |
| Other private transfer receipts | |
| Secondary income (current transfer) payments | Secondary income (current transfer) payments |
| U.S. government transfers | General government transfer payments |
| U.S. government pensions and other transfers | Social benefits |
| U.S. government grants | International cooperation |
| Contributions to international organizations | |
| Other general government transfer payments | |
| Private transfers | Private transfer payments |
| Personal transfers | Personal transfers |
| Insurance-related transfers | |
| Taxes on income, wealth, etc. | |
| Fines and penalties | |
| Charitable donations | |
| Transfers to foreign students | |
| Other current transfers | Other private transfer payments |
| Balance on secondary income | Balance on secondary income |
Improvements to methodology for personal transfers. Personal transfers payments cover transfers from foreign-born U.S. residents (in households) to households abroad. BEA has refined the methodology used to estimate these payments beginning with statistics for 2009. These methodological refinements follow refinements in 2012 and 2005.19 Broadly, BEA has long estimated personal transfers payments by applying rates of transferring as a share of income to income estimates of the foreign-born portion of the U.S. population. Different rates of transferring are assigned to individuals in households depending on demographics and other characteristics.
Starting with the 2005 refinements, and continuing through the 2020 refinements, data on income and demographic characteristics of the foreign-born portion of the population have been drawn from the Census Bureau’s American Community Survey (ACS). The 2012 refinement modified how transfer rates were calculated. It used an econometric model to derive transfer rates from relationships observed in data collected on a one-time migration supplement to the August 2008 Current Population Survey (CPS), which was released by the Census Bureau jointly with the Bureau of Labor Statistics. The model allowed transfer rates to vary by the birth country of the foreign-born individual, by marital status and living arrangements (with or without roommates), and by the elapsed time since immigration to the United States.
The econometric model used to estimate transfer rates has been modified in the 2020 refinement. While it continues to use data from the August 2008 CPS migration supplement, it improves income imputation for multifamily households and for individuals, utilizes more granular family income imputations, provides more focused treatment of top-coding and zero transfers in the CPS household-level data, and introduces new explanatory variables to reflect changes in recipient-country economic conditions.
Several of these modifications improve income inputs used in the econometric model. Complexities with the treatment of income arise because on the August 2008 CPS, income data were collected not for individuals but for a single family in each surveyed household and because that family income was reported as a range, not as a value. The 2020 refinement incorporates a regression-based method for distributing income values across a given income range to each family falling into that range. Previously, the midpoint value of the income range had been imputed to each of these families. Once an imputed value of family income is available, in order to calculate model coefficients, income must be imputed to individuals in the household. That is, family income must be allocated to individuals in the family that reports income, and individual income must be estimated for individuals outside that family. The 2020 refinement replaces the ACS with the March 2008 CPS as the primary data source used to inform the allocation of income to individuals in the family that reports income. It also corrects the inadvertent omission of income imputations for individuals outside that family.
Other refinements in 2020 improve the econometric model itself. Many households in the August 2008 CPS migration supplement reported zero personal transfers. In addition, in this dataset, very large transfers were topcoded. The model has been refined to incorporate a first-stage estimation procedure that explicitly accounts for the zeros and the topcoded transfer values. The model was also refined to improve the way it accounts for elapsed time since immigration to the United States and for the country of birth of the foreign-born individual. In accounting for country of birth, the model previously calculated effects that were fixed based on 2008 relationships. The model now allows the effect of country of birth on transfer rates to vary over time based on country income (measured by World Bank data on recipient country gross national income per capita purchasing power parity) and country governance (measured by data from the World Governance Indicators).
With the 2012 refinement, estimates were revised beginning with 2009. The transfer rates from the econometric model were adjusted, or “benchmarked,” to align the (implicit) estimate for 2008 with the previously published estimate. The benchmarking of the rates was designed to counterbalance underreporting of personal transfers in the August 2008 CPS migration supplement. With the 2020 refinement, benchmarking to previously published 2008 estimates continues. The benchmarking factor has increased with this refinement, however, primarily reflecting imputations that increased total household income in the econometric model.
The estimates of personal transfers payments generated with this refined methodology closely track the previously published statistics. Revisions are slightly larger in the most recent years; these revisions reflect the combined effect of the refinements to the methodology and the incorporation of newly available ACS and other source data.
First-time data for foreign gifts to U.S. universities. BEA improved its statistics of secondary income receipts by including, in other general government transfer receipts and in other private transfers receipts, foreign gifts to U.S. institutions of higher learning that were not previously captured in its statistics. Federal law requires most 2- and 4-year postsecondary schools (whether or not they are eligible to participate in Federal Student Aid programs) to report ownership or control by foreign sources and contracts with, or gifts from, the same foreign source to the U.S. Department of Education (DOE). BEA now uses the Foreign Gift and Contract Report compiled by DOE to estimate these gifts beginning with statistics for 2013.
Improved coverage of transfer agreements related to sports players in the capital account
According to international statistical guidelines, a transaction involving an entitlement to future goods and services on an exclusive basis represents an asset to the holder of the entitlement and should be recorded in the capital account of the balance of payments.20 An example of this type of transaction is the transfer fee paid by one sporting franchise to another for the transfer of a player. In this case, the fee represents the purchase (or sale) of an asset representing the athlete’s exclusive right to work. When such transactions have been widely reported in press reports, BEA has included payments by U.S. sports franchises for rights related to athletes formerly under contract by foreign sports franchises in the capital account. BEA has now identified new publicly available sources to better measure additional payments for these rights as well as receipts, in which a foreign sports franchise pays a U.S. sports franchise for rights related to an athlete. In addition, certain similar transactions involving entitlements to exclusive rights to work have been reclassified to the capital account from the services account. Beginning with statistics for 1999, BEA now uses these data sources to record sports player transfer fees in the capital account.
Financial Account
Reclassification and new identification of certain U.S. government capital subscriptions or other contributions to international organizations
Some U.S. government capital subscriptions in, or contributions to, international organizations other than the International Monetary Fund give rise to a type of equity that is not in the form of securities. International guidelines recommend that such transactions and positions be classified as other equity.
BEA has reclassified these transactions from loan assets to a new category “other equity assets” in the other investment assets functional category in the ITAs financial account.21 The reclassification begins with statistics for 1999.
BEA has also introduced newly identified U.S. government transactions in other equity assets and loan assets. As a result, transactions in other equity assets are revised beginning with statistics for 2001, and transactions in loan assets are revised beginning with statistics for 2012.
The new category “other equity” was added to ITA tables 1.2, 1.3, the new table 1.4, table 8.1 (including a new category under general government assets), and ITA table 9.1.
Current-account highlights
Current-account statistics were updated to incorporate newly available and revised source data for 1999–2019, as well as updated seasonal factors, which only affected quarterly statistics. For 1999–2019, the revisions incorporated in this annual update only slightly altered the overall picture of current-account transactions. In most years, revisions to the current-account deficit did not alter its direction of change. However, increases in the deficit in 2016 and 2017 in the previously published statistics became decreases in the revised statistics. The current-account deficit was revised down slightly for 1999 and 2000, and it was revised up for 2001–2011. Starting in 2012, the deficit was revised down for every year except 2014. The largest downward revisions in the deficit were for 2016–2018. The largest upward revisions were for 2006–2008 (table E, chart 3).
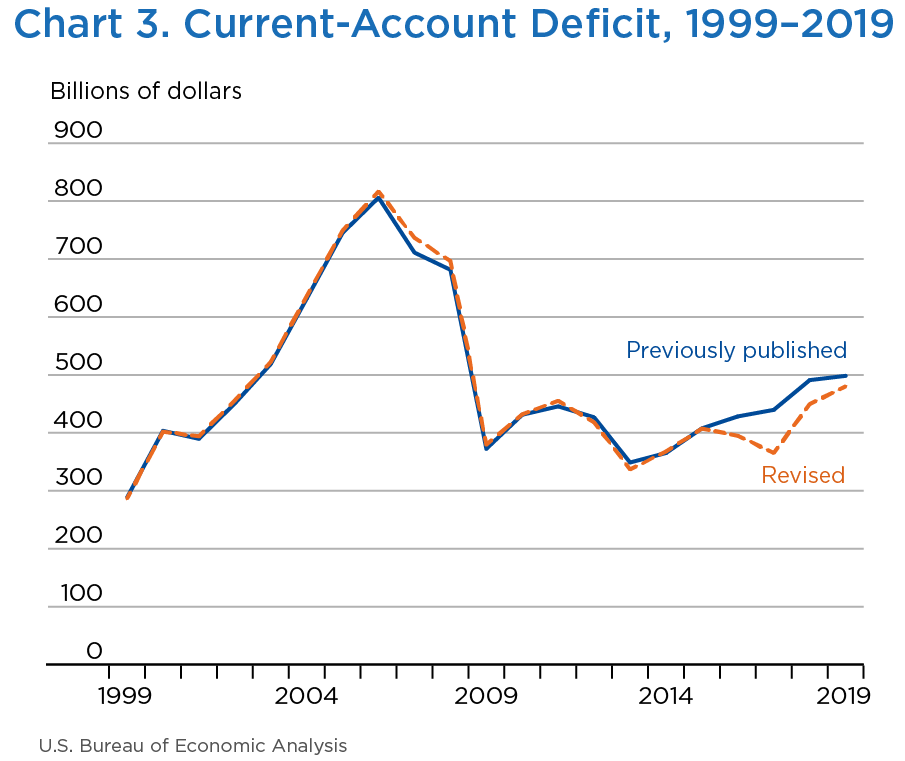
[Click chart to expand]
| 1999 | 2000 | 2001 | 2002 | 2003 | 2004 | 2005 | 2006 | 2007 | 2008 | |
|---|---|---|---|---|---|---|---|---|---|---|
| Balance on current account (line 109): | ||||||||||
| Revised | −286.6 | −401.9 | −394.1 | −456.1 | −522.3 | −635.9 | −749.2 | −816.6 | −736.6 | −696.5 |
| Previously published | −288.4 | −403.5 | −389.7 | −450.8 | −518.7 | −631.6 | −745.2 | −806.0 | −711.0 | −681.4 |
| Amount of revision | 1.8 | 1.5 | −4.4 | −5.3 | −3.5 | −4.3 | −4.0 | −10.7 | −25.5 | −15.1 |
| Balance on goods and services (line 110): | ||||||||||
| Revised | −255.8 | −369.7 | −360.4 | −420.7 | −496.2 | −610.8 | −716.5 | −763.5 | −711.0 | −712.4 |
| Previously published | −258.6 | −372.5 | −361.5 | −419.0 | −493.9 | −609.9 | −714.2 | −761.7 | −705.4 | −708.7 |
| Amount of revision | 2.8 | 2.8 | 1.1 | −1.7 | −2.4 | −1.0 | −2.3 | −1.8 | −5.6 | −3.6 |
| Balance on goods (line 111): | ||||||||||
| Revised | −337.1 | −446.8 | −422.4 | −475.2 | −541.6 | −664.8 | −782.8 | −837.3 | −821.2 | −832.5 |
| Previously published | −337.1 | −446.8 | −422.4 | −475.2 | −541.6 | −664.8 | −782.8 | −837.3 | −821.2 | −832.5 |
| Amount of revision | 0.0 | 0.0 | 0.0 | 0.0 | 0.0 | 0.0 | 0.0 | 0.0 | 0.0 | 0.0 |
| Balance on services (line 112): | ||||||||||
| Revised | 81.3 | 77.1 | 62.0 | 54.6 | 45.4 | 53.9 | 66.3 | 73.8 | 110.2 | 120.1 |
| Previously published | 78.5 | 74.3 | 60.9 | 56.3 | 47.8 | 54.9 | 68.6 | 75.6 | 115.8 | 123.8 |
| Amount of revision | 2.8 | 2.8 | 1.1 | −1.7 | −2.4 | −1.0 | −2.3 | −1.8 | −5.6 | −3.6 |
| Balance on primary income (line 113): | ||||||||||
| Revised | 10.0 | 14.6 | 23.2 | 17.5 | 29.3 | 46.6 | 44.2 | 16.0 | 64.4 | 112.0 |
| Previously published | 11.1 | 18.1 | 27.5 | 22.7 | 34.7 | 53.9 | 53.9 | 26.9 | 85.0 | 129.6 |
| Amount of revision | −1.2 | −3.4 | −4.3 | −5.2 | −5.5 | −7.3 | −9.7 | −10.9 | −20.6 | −17.6 |
| Balance on secondary income (line 114): | ||||||||||
| Revised | −40.8 | −46.9 | −57.0 | −52.9 | −55.3 | −71.6 | −76.9 | −69.1 | −89.9 | −96.2 |
| Previously published | −40.9 | −49.0 | −55.7 | −54.5 | −59.6 | −75.6 | −84.9 | −71.1 | −90.7 | −102.3 |
| Amount of revision | 0.1 | 2.1 | −1.2 | 1.6 | 4.3 | 4.0 | 8.0 | 2.1 | 0.8 | 6.1 |
| Balance on capital account (line 115): | ||||||||||
| Revised | −6.4 | −4.2 | 12.2 | −3.8 | −8.5 | −4.3 | 1.0 | −7.4 | −6.1 | −0.2 |
| Previously published | −4.2 | 0.0 | 13.2 | −0.1 | −1.8 | 3.0 | 13.1 | −1.8 | 0.4 | 6.0 |
| Amount of revision | −2.3 | −4.2 | −1.0 | −3.7 | −6.7 | −7.4 | −12.2 | −5.7 | −6.4 | −6.2 |
| Net lending (+) or net borrowing (−) from financial-account transactions (line 117): | ||||||||||
| Revised | −238.6 | −478.4 | −402.0 | −502.7 | −540.6 | −542.2 | −714.1 | −825.6 | −632.8 | −747.1 |
| Previously published | −238.6 | −478.4 | −402.0 | −502.7 | −540.6 | −542.2 | −714.1 | −825.6 | −632.9 | −747.1 |
| Amount of revision | 0.0 | 0.0 | 0.0 | 0.0 | 0.0 | 0.0 | 0.0 | 0.0 | 0.0 | 0.0 |
| Statistical discrepancy (line 108): | ||||||||||
| Revised | 54.4 | −72.3 | −20.1 | −42.7 | −9.8 | 98.0 | 34.2 | −1.5 | 109.8 | −50.4 |
| Previously published | 53.9 | −74.9 | −25.5 | −51.7 | −20.0 | 86.3 | 18.0 | −17.8 | 77.8 | −71.7 |
| Amount of revision | 0.5 | 2.7 | 5.4 | 9.0 | 10.3 | 11.7 | 16.2 | 16.4 | 32.0 | 21.3 |
| 2009 | 2010 | 2011 | 2012 | 2013 | 2014 | 2015 | 2016 | 2017 | 2018 | 2019 | |
|---|---|---|---|---|---|---|---|---|---|---|---|
| Balance on current account (line 109): | |||||||||||
| Revised | −379.7 | −432.0 | −455.3 | −418.1 | −336.9 | −367.8 | −407.4 | −394.9 | −365.3 | −449.7 | −480.2 |
| Previously published | −372.5 | −431.3 | −445.7 | −426.8 | −348.8 | −365.2 | −407.8 | −428.3 | −439.6 | −491.0 | −498.4 |
| Amount of revision | −7.2 | −0.7 | −9.6 | 8.7 | 11.9 | −2.6 | 0.4 | 33.5 | 74.4 | 41.3 | 18.1 |
| Balance on goods and services (line 110): | |||||||||||
| Revised | −394.8 | −503.1 | −554.5 | −525.9 | −446.8 | −484.1 | −491.3 | −481.2 | −513.8 | −579.9 | −576.9 |
| Previously published | −383.8 | −495.2 | −549.7 | −537.4 | −461.1 | −489.6 | −498.5 | −503.0 | −550.1 | −627.7 | −616.4 |
| Amount of revision | −11.0 | −7.9 | −4.8 | 11.5 | 14.3 | 5.4 | 7.3 | 21.8 | 36.3 | 47.7 | 39.6 |
| Balance on goods (line 111): | |||||||||||
| Revised | −509.7 | −648.7 | −741.0 | −741.1 | −700.5 | −749.9 | −761.9 | −749.8 | −799.3 | −880.3 | −864.3 |
| Previously published | −509.7 | −648.7 | −741.0 | −741.1 | −700.5 | −749.9 | −761.9 | −749.8 | −805.2 | −887.3 | −866.2 |
| Amount of revision | 0.0 | 0.0 | 0.0 | 0.0 | 0.0 | 0.0 | 0.0 | 0.0 | 5.9 | 7.0 | 1.9 |
| Balance on services (line 112): | |||||||||||
| Revised | 114.9 | 145.6 | 186.5 | 215.2 | 253.7 | 265.8 | 270.6 | 268.6 | 285.6 | 300.4 | 287.5 |
| Previously published | 125.9 | 153.4 | 191.3 | 203.7 | 239.4 | 260.3 | 263.3 | 246.8 | 255.1 | 259.7 | 249.8 |
| Amount of revision | −11.0 | −7.9 | −4.8 | 11.5 | 14.3 | 5.4 | 7.3 | 21.8 | 30.5 | 40.7 | 37.6 |
| Balance on primary income (line 113): | |||||||||||
| Revised | 115.5 | 169.9 | 202.4 | 197.9 | 195.5 | 200.3 | 185.4 | 197.0 | 257.8 | 251.2 | 236.3 |
| Previously published | 115.2 | 168.2 | 211.1 | 207.5 | 206.0 | 218.4 | 203.6 | 198.7 | 225.8 | 254.0 | 257.0 |
| Amount of revision | 0.4 | 1.7 | −8.7 | −9.5 | −10.5 | −18.1 | −18.2 | −1.6 | 32.0 | −2.8 | −20.7 |
| Balance on secondary income (line 114): | |||||||||||
| Revised | −100.5 | −98.8 | −103.2 | −90.1 | −85.5 | −84.0 | −101.5 | −110.7 | −109.3 | −120.9 | −139.7 |
| Previously published | −103.9 | −104.3 | −107.0 | −96.9 | −93.6 | −94.0 | −112.8 | −124.0 | −115.3 | −117.3 | −138.9 |
| Amount of revision | 3.4 | 5.4 | 3.8 | 6.8 | 8.1 | 10.0 | 11.4 | 13.3 | 6.1 | −3.6 | −0.8 |
| Balance on capital account (line 115): | |||||||||||
| Revised | −5.9 | −6.9 | −9.0 | 0.9 | −6.6 | −6.5 | −7.9 | −6.6 | 12.4 | −4.2 | −6.2 |
| Previously published | −0.1 | −0.2 | −1.2 | 6.9 | −0.4 | 0.0 | 0.0 | −0.2 | 19.0 | 3.2 | 0.0 |
| Amount of revision | −5.7 | −6.7 | −7.8 | −6.0 | −6.1 | −6.5 | −7.9 | −6.5 | −6.6 | −7.4 | −6.2 |
| Net lending (+) or net borrowing (−) from financial-account transactions (line 117): | |||||||||||
| Revised | −239.4 | −446.4 | −526.0 | −448.0 | −400.1 | −297.1 | −333.1 | −363.6 | −334.1 | −419.7 | −395.5 |
| Previously published | −239.4 | −446.4 | −526.0 | −448.2 | −400.3 | −297.3 | −325.9 | −382.0 | −357.6 | −445.5 | −395.9 |
| Amount of revision | 0.0 | 0.0 | 0.0 | 0.2 | 0.2 | 0.2 | −7.2 | 18.4 | 23.5 | 25.8 | 0.4 |
| Statistical discrepancy (line 108): | |||||||||||
| Revised | 146.2 | −7.5 | −61.7 | −30.8 | −56.7 | 77.3 | 82.2 | 37.8 | 18.8 | 34.2 | 90.9 |
| Previously published | 133.3 | −15.0 | −79.2 | −28.3 | −51.0 | 68.0 | 81.9 | 46.5 | 63.1 | 42.3 | 102.5 |
| Amount of revision | 13.0 | 7.5 | 17.5 | −2.6 | −5.6 | 9.3 | 0.3 | −8.6 | −44.3 | −8.1 | −11.5 |
- (*)
- Between zero and +/- 50,000,000
Goods. Revisions of exports and imports of goods for 2017–2019 were small; no revisions were greater than +/− $4.5 billion. Trade in goods statistics were not revised prior to 2017 (table F).
Services. Exports and imports of services were revised for 1999–2019. Services exports were revised up for every year. The upward revisions mainly reflect the incorporation of FISIM and market-making services into financial services; FISIM averaged $9.3 billion and market-marking services averaged $1.5 billion over the period. Downward revisions to travel, primarily resulting from methodological improvements, largely offset the upward revisions in financial services. The downward revisions to travel averaged $9.5 billion over the period. Revisions in transport, due primarily to methodological and source data improvements, contributed to the upward revisions through 2015 but were mostly downward for more recent years. For 2006–2019, improvements to the universe estimation methodology for services that are based on BEA surveys also contributed to the upward revisions to exports. The incorporation of results from the 2017 BE-120 Benchmark Survey of Selected Services and Intellectual Property Transactions with Foreign Persons also contributed to the upward revision for 2016–2017.
Services imports were revised up for 1999–2017 and were revised down in 2018 and 2019. The upward revisions resulted mainly from the incorporation of FISIM and market-making services into financial services; FISIM averaged $8.0 billion and market-making services averaged $0.3 billion over the period. Downward revisions to travel, primarily resulting from methodological improvements, partly offset the upward revisions to financial services through 2013 and more than offset those upward revisions for 2014–2019. The downward revisions to travel averaged $6.8 billion over the period. Revisions in transport, due primarily to methodological and source data improvements, contributed to the upward revisions through 2015 but were downward for more recent years. For 2006–2019, improvements to the universe estimation methodology for services based on BEA surveys and the incorporation of the 2017 BE-120 Benchmark Survey of Selected Services and Intellectual Property Transactions with Foreign Persons affected revisions. Improvements to the universe estimation methodology resulted in downward contributions to the overall services revisions for 2006–2009 and 2011 and in upward contributions for 2010 and 2012–2019.
| 1999 | 2000 | 2001 | 2002 | 2003 | 2004 | 2005 | 2006 | 2007 | 2008 | |
|---|---|---|---|---|---|---|---|---|---|---|
| Exports of goods and services and income receipts | ||||||||||
| Revised | 1,313.4 | 1,486.1 | 1,368.1 | 1,345.5 | 1,437.1 | 1,661.1 | 1,893.2 | 2,204.2 | 2,547.9 | 2,754.4 |
| Previously published | 1,303.6 | 1,469.6 | 1,344.2 | 1,318.3 | 1,407.0 | 1,638.0 | 1,885.8 | 2,209.2 | 2,559.3 | 2,742.3 |
| Amount of revision | 9.9 | 16.5 | 23.9 | 27.2 | 30.1 | 23.2 | 7.3 | −4.9 | −11.4 | 12.1 |
| Exports of goods | ||||||||||
| Revised | 698.5 | 784.9 | 731.3 | 698.0 | 730.4 | 823.6 | 913.0 | 1,040.9 | 1,165.2 | 1,308.8 |
| Previously published | 698.5 | 784.9 | 731.3 | 698.0 | 730.4 | 823.6 | 913.0 | 1040.9 | 1165.2 | 1308.8 |
| Amount of revision | 0.0 | 0.0 | 0.0 | 0.0 | 0.0 | 0.0 | 0.0 | 0.0 | 0.0 | 0.0 |
| Newly available and revised source data | 0.0 | 0.0 | 0.0 | 0.0 | 0.0 | 0.0 | 0.0 | 0.0 | 0.0 | 0.0 |
| Exports of services | ||||||||||
| Revised | 278.0 | 298.0 | 284.0 | 288.1 | 297.7 | 344.5 | 378.5 | 423.1 | 495.7 | 540.8 |
| Previously published | 271.3 | 290.4 | 274.3 | 280.7 | 290.0 | 338.0 | 373.0 | 416.7 | 488.4 | 532.8 |
| Amount of revision | 6.7 | 7.6 | 9.7 | 7.4 | 7.8 | 6.6 | 5.5 | 6.3 | 7.3 | 8.0 |
| Reclassification to capital-account receipts | (*) | (*) | (*) | (*) | (*) | (*) | (*) | (*) | (*) | (*) |
| Improved estimation methods and newly available and revised source data | 6.7 | 7.6 | 9.7 | 7.4 | 7.8 | 6.6 | 5.5 | 6.4 | 7.3 | 8.0 |
| Manufacturing services on physical inputs owned by others (new major category) | n.a. | n.a. | n.a. | n.a. | n.a. | n.a. | n.a. | n.a. | n.a. | n.a. |
| Maintenance and repair services n.i.e. | ||||||||||
| Revised | 3.7 | 4.4 | 5.2 | 5.4 | 5.1 | 5.2 | 6.7 | 7.1 | 8.9 | 9.4 |
| Previously published | 4.1 | 5.0 | 5.9 | 6.0 | 5.7 | 5.7 | 7.6 | 8.2 | 10.0 | 10.6 |
| Amount of revision | −0.4 | −0.6 | −0.7 | −0.7 | −0.6 | −0.5 | −1.0 | −1.1 | −1.1 | −1.2 |
| Reclassification of installation services to other business services | −0.4 | −0.6 | −0.7 | −0.7 | −0.6 | −0.5 | −1.0 | −1.1 | −1.0 | −1.2 |
| Improved universe estimation method and newly available and revised source data | 0.0 | 0.0 | 0.0 | 0.0 | 0.0 | 0.0 | 0.0 | (*) | −0.1 | −0.1 |
| Transport | ||||||||||
| Revised | 46.3 | 49.5 | 46.0 | 46.0 | 46.7 | 54.4 | 58.4 | 64.0 | 70.8 | 78.2 |
| Previously published | 43.2 | 45.8 | 41.7 | 41.9 | 41.4 | 47.7 | 52.6 | 57.5 | 65.8 | 75.0 |
| Amount of revision | 3.1 | 3.7 | 4.2 | 4.0 | 5.3 | 6.7 | 5.8 | 6.6 | 5.0 | 3.3 |
| Improved method for estimating air passenger transport | 0.6 | 1.2 | 1.9 | 1.5 | 2.7 | 3.6 | 2.7 | 3.2 | 2.7 | 1.1 |
| Improved estimation methods and newly available and revised source data for estimating sea freight and port services | 0.0 | 0.0 | 0.0 | 0.0 | 0.0 | 0.0 | 0.0 | 0.0 | 0.0 | −0.7 |
| Newly available and revised source data for air freight and port services and incorporation of backcasting methods for estimating air port services | 2.5 | 2.5 | 2.4 | 2.5 | 2.5 | 3.1 | 3.1 | 3.3 | 2.3 | 2.9 |
| Travel (for all purposes including education) | ||||||||||
| Revised | 89.1 | 96.9 | 86.4 | 79.6 | 77.0 | 85.6 | 93.4 | 96.1 | 106.9 | 117.0 |
| Previously published | 92.3 | 100.2 | 86.7 | 81.9 | 80.3 | 92.4 | 101.5 | 105.1 | 119.0 | 133.8 |
| Amount of revision | −3.2 | −3.3 | −0.3 | −2.2 | −3.3 | −6.7 | −8.0 | −9.0 | −12.1 | −16.7 |
| Improved estimation methods | −3.2 | −3.3 | −0.3 | −2.2 | −3.3 | −6.7 | −8.0 | −9.0 | −12.1 | −16.7 |
| Construction | ||||||||||
| Revised | 4.0 | 2.0 | 2.6 | 3.1 | 2.4 | 2.3 | 1.5 | 1.9 | 2.8 | 4.1 |
| Previously published1 | ..... | ..... | ..... | ..... | ..... | ..... | ..... | ..... | ..... | ..... |
| Amount of revision | 4.0 | 2.0 | 2.6 | 3.1 | 2.4 | 2.3 | 1.5 | 1.9 | 2.8 | 4.1 |
| Reclassification from other business services | 4.0 | 2.0 | 2.6 | 3.1 | 2.4 | 2.3 | 1.5 | 1.9 | 2.7 | 3.9 |
| Improved universe estimation method and newly available and revised source data | 0.0 | 0.0 | 0.0 | 0.0 | 0.0 | 0.0 | 0.0 | 0.0 | (*) | 0.2 |
| Insurance services | ||||||||||
| Revised | 3.1 | 3.6 | 3.4 | 4.4 | 6.0 | 7.3 | 7.6 | 9.4 | 10.9 | 13.5 |
| Previously published | 3.1 | 3.6 | 3.4 | 4.4 | 6.0 | 7.3 | 7.6 | 9.4 | 10.8 | 13.4 |
| Amount of revision | 0.0 | 0.0 | 0.0 | 0.0 | 0.0 | 0.0 | 0.0 | 0.0 | (*) | 0.1 |
| Improved universe estimation method and newly available and revised source data | 0.0 | 0.0 | 0.0 | 0.0 | 0.0 | 0.0 | 0.0 | 0.0 | (*) | 0.1 |
| Financial services | ||||||||||
| Revised | 26.0 | 29.2 | 27.5 | 29.9 | 33.5 | 42.8 | 47.4 | 56.5 | 74.0 | 79.9 |
| Previously published | 19.4 | 22.1 | 21.9 | 24.5 | 27.8 | 36.4 | 39.9 | 47.9 | 61.4 | 63.0 |
| Amount of revision | 6.6 | 7.1 | 5.6 | 5.4 | 5.7 | 6.4 | 7.5 | 8.6 | 12.6 | 16.9 |
| Introduction of FISIM | 5.7 | 5.8 | 4.8 | 4.5 | 4.6 | 5.0 | 6.0 | 7.3 | 8.3 | 7.1 |
| Introduction of market-making services | 0.9 | 1.3 | 0.8 | 0.9 | 1.1 | 1.4 | 1.5 | 2.1 | 2.6 | 3.2 |
| Improved universe estimation method and newly available and revised source data | 0.0 | 0.0 | 0.0 | 0.0 | 0.0 | 0.0 | 0.0 | −0.8 | 1.7 | 6.6 |
| Charges for the use of intellectual property n.i.e. | ||||||||||
| Revised | 39.9 | 43.5 | 41.0 | 44.8 | 47.3 | 56.9 | 64.5 | 71.0 | 84.5 | 89.7 |
| Previously published | 47.7 | 51.8 | 49.5 | 53.9 | 56.8 | 67.1 | 74.4 | 83.5 | 97.8 | 102.1 |
| Amount of revision | −7.8 | −8.3 | −8.5 | −9.0 | −9.5 | −10.2 | −10.0 | −12.6 | −13.3 | −12.5 |
| Reclassification to capital-account receipts | (*) | (*) | (*) | (*) | (*) | (*) | (*) | (*) | (*) | (*) |
| Reclassification to telecommunications, computer, and information services | (*) | (*) | (*) | (*) | (*) | (*) | −0.1 | −0.1 | −0.1 | −0.1 |
| Reclassifications to other business services and to personal, cultural, and recreational services2 | −7.8 | −8.3 | −8.4 | −9.0 | −9.5 | −10.1 | −9.9 | −12.5 | −14.0 | −13.4 |
| Improved universe estimation method and newly available and revised source data | 0.0 | 0.0 | 0.0 | 0.0 | 0.0 | 0.0 | 0.0 | (*) | 0.8 | 1.1 |
| Telecommunications, computer, and information services | ||||||||||
| Revised | 12.3 | 12.3 | 12.9 | 12.5 | 14.1 | 15.0 | 15.6 | 17.2 | 20.3 | 23.9 |
| Previously published | 12.3 | 12.2 | 12.8 | 12.5 | 14.1 | 15.0 | 15.5 | 17.2 | 20.2 | 23.1 |
| Amount of revision | (*) | (*) | (*) | (*) | (*) | (*) | 0.1 | 0.1 | 0.1 | 0.8 |
| Reclassification from charges for the use of intellectual property n.i.e. | (*) | (*) | (*) | (*) | (*) | (*) | 0.1 | 0.1 | 0.1 | 0.1 |
| Improved universe estimation method and newly available and revised source data | 0.0 | 0.0 | 0.0 | 0.0 | 0.0 | 0.0 | 0.0 | (*) | 0.1 | 0.7 |
| Other business services | ||||||||||
| Revised | 36.4 | 38.2 | 41.3 | 44.6 | 46.2 | 51.6 | 56.8 | 66.0 | 79.4 | 90.0 |
| Previously published | 41.0 | 40.5 | 44.1 | 48.0 | 48.8 | 54.4 | 58.3 | 68.6 | 82.4 | 92.7 |
| Amount of revision | −4.6 | −2.3 | −2.9 | −3.4 | −2.6 | −2.8 | −1.5 | −2.6 | −3.0 | −2.8 |
| Reclassification from maintenance and repair services n.i.e. | 0.4 | 0.6 | 0.7 | 0.7 | 0.6 | 0.5 | 1.0 | 1.1 | 1.0 | 1.2 |
| Reclassification to construction | −4.0 | −2.0 | −2.6 | −3.1 | −2.4 | −2.3 | −1.5 | −1.9 | −2.7 | −3.9 |
| Reclassification to personal, cultural, and recreational services and reclassification from charges for the use of intellectual property n.i.e.2 | −1.2 | −1.1 | −1.2 | −1.1 | −1.1 | −1.3 | −1.2 | −2.0 | −2.1 | −2.6 |
| Improved universe estimation method and newly available and revised source data | 0.2 | 0.2 | 0.2 | 0.2 | 0.2 | 0.2 | 0.3 | 0.1 | 0.8 | 2.5 |
| Personal, cultural, and recreational services | ||||||||||
| Revised | 9.0 | 9.4 | 9.6 | 10.1 | 10.5 | 11.4 | 11.1 | 14.5 | 16.3 | 16.1 |
| Previously published1 | ..... | ..... | ..... | ..... | ..... | ..... | ..... | ..... | ..... | ..... |
| Amount of revision | 9.0 | 9.4 | 9.6 | 10.1 | 10.5 | 11.4 | 11.1 | 14.5 | 16.3 | 16.1 |
| Reclassifications from charges for the use of intellectual property n.i.e. and from other business services2 | 9.0 | 9.4 | 9.6 | 10.1 | 10.5 | 11.4 | 11.1 | 14.6 | 16.2 | 15.9 |
| Improved universe estimation method and newly available and revised source data | 0.0 | 0.0 | 0.0 | 0.0 | 0.0 | 0.0 | 0.0 | (*) | 0.1 | 0.1 |
| Government goods and services n.i.e. | ||||||||||
| Revised | 8.2 | 9.2 | 8.2 | 7.7 | 9.0 | 12.0 | 15.6 | 19.2 | 20.9 | 19.1 |
| Previously published | 8.2 | 9.2 | 8.2 | 7.7 | 9.0 | 12.0 | 15.6 | 19.2 | 20.9 | 19.1 |
| Amount of revision | 0.0 | 0.0 | 0.0 | 0.0 | 0.0 | 0.0 | 0.0 | 0.0 | 0.0 | 0.0 |
| Newly available and revised source data | 0.0 | 0.0 | 0.0 | 0.0 | 0.0 | 0.0 | 0.0 | 0.0 | 0.0 | 0.0 |
| Primary income receipts | ||||||||||
| Revised | 302.5 | 365.6 | 311.4 | 306.4 | 346.9 | 432.8 | 536.3 | 669.9 | 816.9 | 820.2 |
| Previously published | 299.1 | 356.7 | 297.0 | 286.5 | 324.4 | 416.1 | 534.2 | 680.8 | 835.0 | 815.6 |
| Amount of revision | 3.4 | 8.9 | 14.4 | 19.9 | 22.6 | 16.8 | 2.1 | −10.9 | −18.0 | 4.7 |
| Direct investment | ||||||||||
| Revised | 135.3 | 156.1 | 133.2 | 149.4 | 188.4 | 250.9 | 291.4 | 321.0 | 371.8 | 415.2 |
| Previously published | 135.3 | 156.1 | 133.2 | 149.4 | 188.4 | 250.9 | 291.4 | 321.0 | 371.8 | 415.2 |
| Amount of revision | 0.0 | 0.0 | 0.0 | 0.0 | 0.0 | 0.0 | 0.0 | 0.0 | 0.0 | 0.0 |
| Newly available and revised source data | 0.0 | 0.0 | 0.0 | 0.0 | 0.0 | 0.0 | 0.0 | 0.0 | 0.0 | 0.0 |
| Portfolio investment | ||||||||||
| Revised | 72.2 | 78.4 | 73.8 | 81.8 | 90.6 | 108.6 | 129.9 | 166.8 | 221.8 | 241.0 |
| Previously published | 72.2 | 78.4 | 73.9 | 81.9 | 90.7 | 108.6 | 129.7 | 166.1 | 221.6 | 241.3 |
| Amount of revision | (*) | (*) | −0.1 | −0.1 | −0.1 | (*) | 0.2 | 0.6 | 0.2 | −0.3 |
| FISIM-related changes to primary income | (*) | (*) | −0.1 | −0.1 | −0.1 | (*) | 0.2 | 0.6 | 0.2 | −0.3 |
| Newly available and revised source data | 0.0 | 0.0 | 0.0 | 0.0 | 0.0 | 0.0 | 0.0 | 0.0 | 0.0 | 0.0 |
| Other investment | ||||||||||
| Revised | 89.6 | 125.5 | 98.5 | 69.5 | 62.2 | 67.4 | 109.0 | 175.9 | 216.6 | 157.1 |
| Previously published | 86.1 | 116.6 | 84.0 | 49.6 | 39.6 | 50.6 | 107.1 | 187.4 | 234.9 | 152.1 |
| Amount of revision | 3.4 | 8.9 | 14.5 | 20.0 | 22.6 | 16.8 | 1.9 | −11.6 | −18.3 | 5.0 |
| FISIM-related changes to primary income | 3.4 | 8.9 | 14.5 | 20.0 | 22.6 | 16.8 | 1.9 | −11.6 | −18.1 | 5.0 |
| Improved universe estimation method and newly available and revised source data | (*) | 0.0 | 0.0 | 0.0 | (*) | 0.0 | 0.0 | (*) | −0.1 | (*) |
| Compensation of employees | ||||||||||
| Revised | 4.2 | 4.4 | 4.5 | 4.6 | 4.7 | 4.7 | 4.8 | 5.1 | 5.2 | 5.4 |
| Previously published | 4.2 | 4.4 | 4.5 | 4.6 | 4.7 | 4.7 | 4.8 | 5.1 | 5.2 | 5.4 |
| Amount of revision | 0.0 | 0.0 | 0.0 | 0.0 | 0.0 | 0.0 | 0.0 | 0.0 | 0.0 | 0.0 |
| Newly available and revised source data | 0.0 | 0.0 | 0.0 | 0.0 | 0.0 | 0.0 | 0.0 | 0.0 | 0.0 | 0.0 |
| Secondary income receipts | ||||||||||
| Revised | 34.4 | 37.5 | 41.4 | 53.0 | 62.0 | 60.1 | 65.4 | 70.3 | 70.2 | 84.5 |
| Previously published | 34.6 | 37.6 | 41.6 | 53.1 | 62.3 | 60.3 | 65.6 | 70.7 | 70.8 | 85.1 |
| Amount of revision | −0.2 | −0.1 | −0.2 | −0.1 | −0.2 | −0.2 | −0.2 | −0.4 | −0.6 | −0.5 |
| Newly available and revised source data | −0.2 | −0.1 | −0.2 | −0.1 | −0.2 | −0.2 | −0.2 | −0.4 | −0.6 | −0.5 |
| Capital transfer receipts and other credits | ||||||||||
| Revised | (*) | (*) | 13.2 | 0.1 | 0.1 | 3.8 | 15.5 | (*) | 0.5 | 6.2 |
| Previously published | (*) | (*) | 13.2 | 0.1 | 0.1 | 3.8 | 15.5 | 0.0 | 0.5 | 6.2 |
| Amount of revision | (*) | (*) | (*) | (*) | (*) | (*) | (*) | (*) | (*) | (*) |
| Reclassifications from exports of services | (*) | (*) | (*) | (*) | (*) | (*) | (*) | (*) | (*) | (*) |
| Newly available and revised source data | (*) | (*) | 0.0 | (*) | (*) | (*) | (*) | (*) | (*) | 0.0 |
| Imports of goods and services and income payments | ||||||||||
| Revised | 1,600.1 | 1,888.0 | 1,762.2 | 1,801.6 | 1,959.4 | 2,297.0 | 2,642.4 | 3,020.9 | 3,284.5 | 3,450.9 |
| Previously published | 1,591.9 | 1,873.1 | 1,733.9 | 1,769.1 | 1,925.8 | 2,269.5 | 2,631.1 | 3,015.1 | 3,270.4 | 3,423.6 |
| Amount of revision | 8.1 | 14.9 | 28.3 | 32.5 | 33.6 | 27.5 | 11.3 | 5.7 | 14.1 | 27.3 |
| Imports of goods | ||||||||||
| Revised | 1,035.6 | 1,231.7 | 1,153.7 | 1,173.3 | 1,272.1 | 1,488.3 | 1,695.8 | 1,878.2 | 1,986.3 | 2,141.3 |
| Previously published | 1,035.6 | 1,231.7 | 1,153.7 | 1,173.3 | 1,272.1 | 1,488.3 | 1,695.8 | 1,878.2 | 1,986.3 | 2,141.3 |
| Amount of revision | 0.0 | 0.0 | 0.0 | 0.0 | 0.0 | 0.0 | 0.0 | 0.0 | 0.0 | 0.0 |
| Newly available and revised source data | 0.0 | 0.0 | 0.0 | 0.0 | 0.0 | 0.0 | 0.0 | 0.0 | 0.0 | 0.0 |
| Imports of services | ||||||||||
| Revised | 196.7 | 220.9 | 222.0 | 233.5 | 252.3 | 290.6 | 312.2 | 349.3 | 385.5 | 420.7 |
| Previously published | 192.9 | 216.1 | 213.5 | 224.4 | 242.2 | 283.1 | 304.4 | 341.2 | 372.6 | 409.1 |
| Amount of revision | 3.8 | 4.8 | 8.6 | 9.1 | 10.1 | 7.5 | 7.8 | 8.2 | 12.9 | 11.6 |
| Reclassification to capital-account payments | (*) | (*) | (*) | (*) | (*) | (*) | (*) | (*) | (*) | (*) |
| Improved estimation methods and newly available and revised source data | 3.8 | 4.8 | 8.6 | 9.1 | 10.1 | 7.5 | 7.8 | 8.2 | 12.9 | 11.6 |
| Manufacturing services on physical inputs owned by others (new major category) | n.a. | n.a. | n.a. | n.a. | n.a. | n.a. | n.a. | n.a. | n.a. | n.a. |
| Maintenance and repair services n.i.e. | ||||||||||
| Revised | 1.2 | 2.3 | 1.8 | 2.0 | 2.0 | 2.2 | 2.7 | 4.1 | 4.6 | 5.1 |
| Previously published | 1.3 | 2.6 | 2.0 | 2.2 | 2.2 | 2.4 | 3.0 | 4.6 | 5.2 | 5.7 |
| Amount of revision | −0.1 | −0.3 | −0.2 | −0.2 | −0.2 | −0.2 | −0.3 | −0.5 | −0.6 | −0.6 |
| Reclassification of installation services to other business services | −0.1 | −0.3 | −0.2 | −0.2 | −0.2 | −0.2 | −0.3 | −0.3 | −0.3 | −0.4 |
| Improved universe estimation method and newly available and revised source data | 0.0 | 0.0 | 0.0 | 0.0 | 0.0 | 0.0 | 0.0 | −0.2 | −0.3 | −0.3 |
| Transport | ||||||||||
| Revised | 49.9 | 58.5 | 56.6 | 55.4 | 61.1 | 72.0 | 78.8 | 82.3 | 86.1 | 92.8 |
| Previously published | 49.6 | 57.6 | 53.8 | 51.5 | 57.9 | 69.2 | 75.6 | 78.0 | 79.3 | 84.0 |
| Amount of revision | 0.3 | 0.9 | 2.7 | 3.9 | 3.2 | 2.8 | 3.2 | 4.4 | 6.8 | 8.8 |
| Improved method for estimating air passenger transport | 0.3 | 0.9 | 2.7 | 3.9 | 3.2 | 2.8 | 3.2 | 4.4 | 6.8 | 7.5 |
| Improved estimation methods and newly available and revised source data for estimating sea freight and port services | 0.0 | 0.0 | 0.0 | 0.0 | 0.0 | 0.0 | 0.0 | 0.0 | 0.0 | 1.3 |
| Newly available and revised source data for air port services | 0.0 | 0.0 | 0.0 | 0.0 | 0.0 | 0.0 | 0.0 | 0.0 | 0.0 | 0.0 |
| Travel (for all purposes including education) | ||||||||||
| Revised | 58.9 | 64.2 | 60.5 | 59.0 | 61.2 | 70.3 | 74.1 | 78.4 | 82.6 | 84.3 |
| Previously published | 59.6 | 65.8 | 60.7 | 59.9 | 61.9 | 74.0 | 80.0 | 84.2 | 89.2 | 92.5 |
| Amount of revision | −0.7 | −1.6 | −0.2 | −0.9 | −0.6 | −3.7 | −5.9 | −5.8 | −6.6 | −8.2 |
| Improved estimation methods | −0.7 | −1.6 | −0.2 | −0.9 | −0.6 | −3.7 | −5.9 | −5.8 | −6.6 | −8.2 |
| Construction | ||||||||||
| Revised | 1.5 | 1.4 | 1.9 | 2.6 | 2.0 | 2.3 | 1.3 | 1.7 | 2.6 | 3.5 |
| Previously published1 | ..... | ..... | ..... | ..... | ..... | ..... | ..... | ..... | ..... | ..... |
| Amount of revision | 1.5 | 1.4 | 1.9 | 2.6 | 2.0 | 2.3 | 1.3 | 1.7 | 2.6 | 3.5 |
| Reclassification from other business services | 1.5 | 1.4 | 1.9 | 2.6 | 2.0 | 2.3 | 1.3 | 1.7 | 2.5 | 3.5 |
| Improved universe estimation method and newly available and revised source data | 0.0 | 0.0 | 0.0 | 0.0 | 0.0 | 0.0 | 0.0 | 0.0 | (*) | 0.1 |
| Insurance services | ||||||||||
| Revised | 9.4 | 11.3 | 16.7 | 21.9 | 25.2 | 29.1 | 28.7 | 39.4 | 47.2 | 58.4 |
| Previously published | 9.4 | 11.3 | 16.7 | 21.9 | 25.2 | 29.1 | 28.7 | 39.4 | 47.5 | 58.9 |
| Amount of revision | 0.0 | 0.0 | 0.0 | 0.0 | 0.0 | 0.0 | 0.0 | 0.0 | −0.4 | −0.5 |
| Improved universe estimation method and newly available and revised source data | 0.0 | 0.0 | 0.0 | 0.0 | 0.0 | 0.0 | 0.0 | 0.0 | −0.4 | −0.5 |
| Financial services | ||||||||||
| Revised | 12.5 | 16.4 | 16.0 | 15.2 | 15.8 | 19.0 | 22.0 | 27.0 | 33.8 | 29.5 |
| Previously published | 8.3 | 10.9 | 10.2 | 9.0 | 8.9 | 11.2 | 12.1 | 14.7 | 19.2 | 17.2 |
| Amount of revision | 4.2 | 5.5 | 5.8 | 6.3 | 6.8 | 7.9 | 9.8 | 12.3 | 14.6 | 12.3 |
| Introduction of FISIM | 3.9 | 5.1 | 5.6 | 6.0 | 6.6 | 7.7 | 9.6 | 12.1 | 13.2 | 10.6 |
| Introduction of market-making services | 0.3 | 0.4 | 0.2 | 0.2 | 0.2 | 0.2 | 0.2 | 0.4 | 0.5 | 0.5 |
| Improved universe estimation method and newly available and revised source data | 0.0 | 0.0 | 0.0 | 0.0 | 0.0 | 0.0 | 0.0 | −0.2 | 0.8 | 1.2 |
| Charges for the use of intellectual property n.i.e. | ||||||||||
| Revised | 12.8 | 16.1 | 16.2 | 19.0 | 18.7 | 22.8 | 24.1 | 23.1 | 24.6 | 27.8 |
| Previously published | 13.3 | 16.6 | 16.7 | 19.5 | 19.3 | 23.7 | 25.6 | 25.0 | 26.5 | 29.6 |
| Amount of revision | −0.5 | −0.5 | −0.5 | −0.5 | −0.6 | −0.9 | −1.5 | −2.0 | −1.9 | −1.9 |
| Reclassification to capital-account payments | (*) | (*) | (*) | (*) | (*) | (*) | (*) | (*) | (*) | (*) |
| Reclassification to telecommunications, computer, and information services | (*) | (*) | (*) | (*) | (*) | (*) | (*) | (*) | (*) | −0.1 |
| Reclassifications to other business services and to personal, cultural, and recreational services2 | −0.4 | −0.4 | −0.4 | −0.5 | −0.6 | −0.8 | −1.4 | −2.0 | −2.0 | −2.3 |
| Improved universe estimation method and newly available and revised source data | 0.0 | 0.0 | 0.0 | 0.0 | 0.0 | 0.0 | 0.0 | (*) | 0.2 | 0.5 |
| Telecommunications, computer, and information services | ||||||||||
| Revised | 14.7 | 14.1 | 14.0 | 13.2 | 14.9 | 16.4 | 18.4 | 20.9 | 23.7 | 26.1 |
| Previously published | 13.3 | 12.4 | 12.4 | 11.7 | 13.1 | 14.2 | 16.0 | 19.8 | 22.4 | 24.7 |
| Amount of revision | 1.3 | 1.7 | 1.6 | 1.5 | 1.9 | 2.2 | 2.4 | 1.1 | 1.3 | 1.5 |
| Reclassification from charges for the use of intellectual property n.i.e. | (*) | (*) | (*) | (*) | (*) | (*) | (*) | (*) | (*) | 0.1 |
| Improved universe estimation method and newly available and revised source data | 1.3 | 1.7 | 1.6 | 1.5 | 1.8 | 2.1 | 2.4 | 1.0 | 1.2 | 1.4 |
| Other business services | ||||||||||
| Revised | 20.0 | 20.3 | 21.2 | 24.0 | 25.7 | 28.0 | 32.1 | 41.4 | 48.5 | 59.7 |
| Previously published | 23.9 | 24.4 | 25.6 | 29.3 | 30.1 | 33.1 | 36.0 | 48.1 | 55.0 | 67.5 |
| Amount of revision | −3.9 | −4.1 | −4.4 | −5.2 | −4.4 | −5.0 | −3.9 | −6.8 | −6.5 | −7.8 |
| Reclassification from maintenance and repair services n.i.e. | 0.1 | 0.3 | 0.2 | 0.2 | 0.2 | 0.2 | 0.3 | 0.3 | 0.3 | 0.4 |
| Reclassification to construction | −1.5 | −1.4 | −1.9 | −2.6 | −2.0 | −2.3 | −1.3 | −1.7 | −2.5 | −3.5 |
| Reclassification to personal, cultural, and recreational services and reclassification from charges for the use of intellectual property n.i.e.2 | −1.2 | −1.2 | −1.4 | −1.2 | −1.5 | −1.3 | −1.1 | −1.8 | −1.6 | −2.0 |
| Improved universe estimation method and newly available and revised source data | −1.2 | −1.7 | −1.3 | −1.6 | −1.1 | −1.6 | −1.7 | −3.6 | −2.7 | −2.7 |
| Personal, cultural, and recreational services | ||||||||||
| Revised | 1.7 | 1.6 | 1.8 | 1.7 | 2.0 | 2.2 | 2.6 | 3.8 | 3.7 | 4.4 |
| Previously published1 | ..... | ..... | ..... | ..... | ..... | ..... | ..... | ..... | ..... | ..... |
| Amount of revision | 1.7 | 1.6 | 1.8 | 1.7 | 2.0 | 2.2 | 2.6 | 3.8 | 3.7 | 4.4 |
| Reclassifications from charges for the use of intellectual property n.i.e. and from other business services2 | 1.7 | 1.6 | 1.8 | 1.7 | 2.0 | 2.2 | 2.6 | 3.7 | 3.6 | 4.3 |
| Improved universe estimation method and newly available and revised source data | 0.0 | 0.0 | 0.0 | 0.0 | 0.0 | 0.0 | 0.0 | 0.1 | 0.1 | 0.2 |
| Government goods and services n.i.e. | ||||||||||
| Revised | 14.2 | 14.5 | 15.3 | 19.4 | 23.6 | 26.3 | 27.5 | 27.4 | 28.3 | 28.9 |
| Previously published | 14.2 | 14.5 | 15.3 | 19.4 | 23.6 | 26.3 | 27.5 | 27.4 | 28.3 | 28.9 |
| Amount of revision | 0.0 | 0.0 | 0.0 | 0.0 | 0.0 | 0.0 | 0.0 | 0.0 | 0.0 | 0.0 |
| Newly available and revised source data | 0.0 | 0.0 | 0.0 | 0.0 | 0.0 | 0.0 | 0.0 | 0.0 | 0.0 | 0.0 |
| Primary income payments | ||||||||||
| Revised | 292.6 | 351.0 | 288.1 | 288.9 | 317.7 | 386.3 | 492.1 | 653.9 | 752.6 | 708.2 |
| Previously published | 288.0 | 338.6 | 269.4 | 263.9 | 289.7 | 362.2 | 480.3 | 653.9 | 750.0 | 685.9 |
| Amount of revision | 4.6 | 12.3 | 18.7 | 25.0 | 28.0 | 24.1 | 11.8 | (*) | 2.6 | 22.3 |
| Direct investment | ||||||||||
| Revised | 57.9 | 62.2 | 19.5 | 49.6 | 83.8 | 110.3 | 131.9 | 163.4 | 142.8 | 147.4 |
| Previously published | 57.9 | 62.2 | 19.5 | 49.6 | 83.8 | 110.3 | 131.9 | 163.4 | 142.8 | 147.4 |
| Amount of revision | 0.0 | 0.0 | 0.0 | 0.0 | 0.0 | 0.0 | 0.0 | 0.0 | 0.0 | 0.0 |
| Newly available and revised source data | 0.0 | 0.0 | 0.0 | 0.0 | 0.0 | 0.0 | 0.0 | 0.0 | 0.0 | 0.0 |
| Portfolio investment | ||||||||||
| Revised | 145.7 | 165.4 | 162.9 | 160.3 | 164.1 | 197.4 | 242.7 | 306.7 | 386.1 | 404.9 |
| Previously published | 145.3 | 164.8 | 162.5 | 159.8 | 163.5 | 195.8 | 238.6 | 304.9 | 381.8 | 400.0 |
| Amount of revision | 0.3 | 0.6 | 0.4 | 0.4 | 0.6 | 1.6 | 4.1 | 1.7 | 4.3 | 4.9 |
| FISIM-related changes to primary income | (*) | −0.1 | −0.1 | −0.2 | −0.2 | −0.2 | 0.3 | 0.4 | 0.4 | −0.1 |
| Introduction of income from inflation adjustments to Treasury Inflation Protected Securities | 0.4 | 0.7 | 0.6 | 0.6 | 0.8 | 1.8 | 3.8 | 1.3 | 3.9 | 5.0 |
| Newly available and revised source data | 0.0 | 0.0 | 0.0 | 0.0 | 0.0 | 0.0 | 0.0 | 0.0 | 0.0 | 0.0 |
| Other investment | ||||||||||
| Revised | 77.5 | 111.5 | 93.2 | 66.2 | 56.5 | 64.0 | 101.1 | 167.3 | 207.6 | 138.6 |
| Previously published | 73.3 | 100.7 | 75.7 | 42.1 | 29.5 | 42.1 | 93.9 | 169.2 | 209.7 | 121.4 |
| Amount of revision | 4.2 | 10.8 | 17.5 | 24.1 | 27.0 | 21.9 | 7.2 | −1.9 | −2.1 | 17.2 |
| FISIM-related changes to primary income | 4.2 | 10.8 | 17.5 | 24.1 | 27.0 | 21.9 | 7.2 | −1.9 | −2.1 | 17.2 |
| Improved universe estimation method and newly available and revised source data | 0.0 | 0.0 | 0.0 | 0.0 | (*) | 0.0 | 0.0 | (*) | (*) | (*) |
| Compensation of employees | ||||||||||
| Revised | 11.5 | 11.9 | 12.5 | 12.8 | 13.4 | 14.5 | 16.4 | 16.6 | 16.1 | 17.2 |
| Previously published | 11.4 | 11.0 | 11.7 | 12.4 | 12.9 | 14.0 | 15.9 | 16.4 | 15.7 | 17.1 |
| Amount of revision | 0.1 | 0.9 | 0.8 | 0.5 | 0.4 | 0.6 | 0.5 | 0.2 | 0.4 | 0.2 |
| Improvements to compensation methodology and newly available and revised source data | 0.1 | 0.9 | 0.8 | 0.5 | 0.4 | 0.6 | 0.5 | 0.2 | 0.4 | 0.2 |
| Secondary income payments | ||||||||||
| Revised | 75.2 | 84.4 | 98.4 | 106.0 | 117.3 | 131.8 | 142.2 | 139.4 | 160.1 | 180.7 |
| Previously published | 75.5 | 86.6 | 97.3 | 107.6 | 121.8 | 135.9 | 150.5 | 141.8 | 161.5 | 187.4 |
| Amount of revision | 0.0 | −2.2 | 1.1 | −1.6 | −4.5 | −4.2 | −8.3 | −2.4 | −1.4 | −6.7 |
| Reclassification to capital-account payments | −2.3 | −4.2 | −1.0 | −3.7 | −6.7 | −7.4 | −12.2 | −5.7 | −6.4 | −6.2 |
| Methodological improvements | (*) | (*) | (*) | −0.1 | −0.2 | −0.1 | −0.2 | −0.9 | −0.3 | −0.4 |
| Newly available and revised source data | 2.2 | 2.0 | 2.1 | 2.2 | 2.4 | 3.3 | 4.1 | 4.2 | 5.3 | −0.1 |
| Capital transfer payments and other debits | ||||||||||
| Revised | 6.5 | 4.3 | 1.1 | 3.9 | 8.6 | 8.1 | 14.5 | 7.4 | 6.6 | 6.4 |
| Previously published | 4.2 | (*) | (*) | 0.2 | 1.9 | 0.7 | 2.3 | 1.8 | 0.1 | 0.2 |
| Amount of revision | 2.3 | 4.2 | 1.0 | 3.7 | 6.7 | 7.4 | 12.2 | 5.7 | 6.4 | 6.2 |
| Reclassifications from secondary income | 2.3 | 4.2 | 1.0 | 3.7 | 6.7 | 7.4 | 12.2 | 5.7 | 6.4 | 6.2 |
| Reclassifications from imports of services | (*) | (*) | (*) | (*) | (*) | (*) | (*) | (*) | (*) | (*) |
| Newly available and revised source data | (*) | (*) | (*) | (*) | (*) | (*) | (*) | (*) | (*) | (*) |
| 2009 | 2010 | 2011 | 2012 | 2013 | 2014 | 2015 | 2016 | 2017 | 2018 | 2019 | |
|---|---|---|---|---|---|---|---|---|---|---|---|
| Exports of goods and services and income receipts | |||||||||||
| Revised | 2,331.2 | 2,687.5 | 3,036.7 | 3,151.2 | 3,250.8 | 3,379.1 | 3,236.3 | 3,235.4 | 3,542.0 | 3,792.9 | 3,805.9 |
| Previously published | 2,283.1 | 2,624.0 | 2,981.5 | 3,095.0 | 3,213.0 | 3,341.8 | 3,207.3 | 3,188.5 | 3,444.8 | 3,735.7 | 3,763.9 |
| Amount of revision | 48.1 | 63.5 | 55.1 | 56.2 | 37.8 | 37.3 | 29.1 | 46.9 | 97.2 | 57.2 | 42.0 |
| Exports of goods | |||||||||||
| Revised | 1,070.3 | 1,290.3 | 1,498.9 | 1,562.6 | 1,593.7 | 1,635.6 | 1,511.4 | 1,457.4 | 1,557.0 | 1,677.0 | 1,652.4 |
| Previously published | 1070.3 | 1290.3 | 1498.9 | 1562.6 | 1593.7 | 1635.6 | 1511.4 | 1457.4 | 1553.6 | 1674.3 | 1652.8 |
| Amount of revision | 0.0 | 0.0 | 0.0 | 0.0 | 0.0 | 0.0 | 0.0 | 0.0 | 3.4 | 2.6 | −0.4 |
| Newly available and revised source data | 0.0 | 0.0 | 0.0 | 0.0 | 0.0 | 0.0 | 0.0 | 0.0 | 3.4 | 2.6 | −0.4 |
| Exports of services | |||||||||||
| Revised | 522.5 | 582.0 | 644.7 | 684.8 | 719.5 | 756.7 | 768.4 | 780.5 | 830.4 | 862.4 | 875.8 |
| Previously published | 512.7 | 562.8 | 627.1 | 655.7 | 700.5 | 741.1 | 755.3 | 758.4 | 799.0 | 827.0 | 845.2 |
| Amount of revision | 9.7 | 19.3 | 17.6 | 29.1 | 19.0 | 15.6 | 13.1 | 22.1 | 31.4 | 35.5 | 30.6 |
| Reclassification to capital-account receipts | (*) | (*) | (*) | (*) | (*) | (*) | −0.1 | −0.1 | (*) | (*) | −0.1 |
| Improved estimation methods and newly available and revised source data | 9.7 | 19.3 | 17.6 | 29.1 | 19.1 | 15.7 | 13.1 | 22.2 | 31.5 | 35.5 | 30.7 |
| Manufacturing services on physical inputs owned by others (new major category) | n.a. | n.a. | n.a. | n.a. | n.a. | n.a. | n.a. | n.a. | n.a. | n.a. | n.a. |
| Maintenance and repair services n.i.e. | |||||||||||
| Revised | 11.6 | 13.1 | 14.7 | 14.9 | 15.7 | 18.0 | 19.8 | 21.6 | 23.2 | 27.9 | 27.9 |
| Previously published | 12.9 | 14.5 | 16.4 | 17.2 | 18.6 | 21.1 | 23.4 | 25.1 | 26.9 | 31.0 | 32.5 |
| Amount of revision | −1.3 | −1.4 | −1.7 | −2.2 | −2.8 | −3.2 | −3.5 | −3.5 | −3.6 | −3.0 | −4.7 |
| Reclassification of installation services to other business services | −1.2 | −1.4 | −1.5 | −2.2 | −2.8 | −3.3 | −3.9 | −3.7 | −3.9 | −3.4 | −4.4 |
| Improved universe estimation method and newly available and revised source data | −0.1 | (*) | −0.2 | −0.1 | −0.1 | 0.1 | 0.4 | 0.1 | 0.2 | 0.4 | −0.2 |
| Transport | |||||||||||
| Revised | 65.8 | 76.4 | 82.9 | 88.2 | 90.0 | 90.7 | 84.4 | 81.8 | 86.3 | 93.3 | 91.1 |
| Previously published | 62.2 | 71.7 | 79.8 | 83.9 | 86.8 | 90.7 | 87.7 | 84.7 | 88.8 | 92.9 | 91.4 |
| Amount of revision | 3.6 | 4.7 | 3.1 | 4.3 | 3.2 | (*) | −3.3 | −3.0 | −2.5 | 0.4 | −0.3 |
| Improved method for estimating air passenger transport | 0.3 | 0.5 | (*) | 1.8 | 1.1 | −1.6 | −4.3 | −3.7 | −3.6 | −0.2 | −0.6 |
| Improved estimation methods and newly available and revised source data for estimating sea freight and port services | (*) | 0.4 | 0.7 | (*) | −0.5 | −0.5 | −0.8 | −0.9 | −0.5 | −0.5 | −1.3 |
| Newly available and revised source data for air freight and port services and incorporation of backcasting methods for estimating air port services | 3.4 | 3.8 | 2.4 | 2.5 | 2.6 | 2.1 | 1.7 | 1.6 | 1.6 | 1.1 | 1.7 |
| Travel (for all purposes including education) | |||||||||||
| Revised | 110.8 | 130.3 | 142.2 | 153.9 | 171.0 | 180.3 | 192.6 | 192.9 | 193.8 | 196.5 | 193.3 |
| Previously published | 119.9 | 137.0 | 150.9 | 161.6 | 177.5 | 191.9 | 206.9 | 206.7 | 210.7 | 214.7 | 213.5 |
| Amount of revision | −9.1 | −6.7 | −8.7 | −7.7 | −6.5 | −11.7 | −14.3 | −13.8 | −16.8 | −18.2 | −20.2 |
| Improved estimation methods | −9.1 | −6.7 | −8.7 | −7.7 | −6.5 | −11.7 | −14.3 | −13.8 | −16.8 | −18.2 | −20.2 |
| Construction | |||||||||||
| Revised | 4.3 | 3.0 | 3.2 | 3.2 | 2.2 | 2.1 | 2.8 | 1.7 | 2.1 | 2.9 | 3.2 |
| Previously published1 | ..... | ..... | ..... | ..... | ..... | ..... | ..... | ..... | ..... | ..... | ..... |
| Amount of revision | 4.3 | 3.0 | 3.2 | 3.2 | 2.2 | 2.1 | 2.8 | 1.7 | 2.1 | 2.9 | 3.2 |
| Reclassification from other business services | 4.0 | 2.8 | 3.1 | 3.2 | 2.1 | 1.9 | 2.5 | 1.4 | 1.8 | 2.6 | 2.9 |
| Improved universe estimation method and newly available and revised source data | 0.2 | 0.1 | 0.1 | 0.1 | 0.1 | 0.2 | 0.2 | 0.3 | 0.3 | 0.4 | 0.3 |
| Insurance services | |||||||||||
| Revised | 14.6 | 14.9 | 14.7 | 16.0 | 15.8 | 16.3 | 15.5 | 16.2 | 18.2 | 17.9 | 16.2 |
| Previously published | 14.6 | 14.4 | 15.1 | 16.8 | 16.7 | 17.3 | 16.2 | 16.8 | 18.0 | 17.5 | 18.3 |
| Amount of revision | (*) | 0.5 | −0.4 | −0.8 | −0.9 | −1.1 | −0.8 | −0.6 | 0.2 | 0.4 | −2.0 |
| Improved universe estimation method and newly available and revised source data | (*) | 0.5 | −0.4 | −0.8 | −0.9 | −1.1 | −0.8 | −0.6 | 0.2 | 0.4 | −2.0 |
| Financial services | |||||||||||
| Revised | 73.8 | 86.5 | 101.1 | 105.4 | 109.8 | 119.9 | 115.0 | 114.8 | 128.0 | 132.4 | 135.7 |
| Previously published | 64.4 | 72.3 | 78.3 | 76.7 | 95.1 | 106.9 | 102.4 | 99.1 | 109.2 | 112.0 | 111.3 |
| Amount of revision | 9.4 | 14.2 | 22.8 | 28.7 | 14.7 | 13.0 | 12.5 | 15.7 | 18.8 | 20.4 | 24.4 |
| Introduction of FISIM | 6.6 | 7.2 | 8.8 | 10.0 | 10.4 | 11.6 | 12.7 | 14.0 | 16.2 | 18.7 | 19.4 |
| Introduction of market-making services | 2.8 | 2.4 | 2.5 | 1.8 | 1.2 | 1.1 | 0.9 | 0.8 | 0.8 | 0.6 | 0.6 |
| Improved universe estimation method and newly available and revised source data | (*) | 4.5 | 11.5 | 16.9 | 3.1 | 0.2 | −1.1 | 0.9 | 1.8 | 1.1 | 4.5 |
| Charges for the use of intellectual property n.i.e. | |||||||||||
| Revised | 85.7 | 95.0 | 107.1 | 107.9 | 113.8 | 116.4 | 111.2 | 113.0 | 118.1 | 118.9 | 117.4 |
| Previously published | 98.4 | 107.5 | 123.3 | 124.4 | 128.0 | 129.7 | 124.8 | 124.4 | 126.5 | 128.7 | 128.9 |
| Amount of revision | −12.7 | −12.6 | −16.3 | −16.6 | −14.2 | −13.3 | −13.6 | −11.4 | −8.4 | −9.9 | −11.5 |
| Reclassification to capital-account receipts | (*) | (*) | (*) | (*) | (*) | (*) | −0.1 | −0.1 | (*) | (*) | −0.1 |
| Reclassification to telecommunications, computer, and information services | −0.1 | −0.2 | −0.2 | −0.5 | −0.5 | −0.6 | −0.5 | −0.7 | −0.8 | −0.3 | −0.1 |
| Reclassifications to other business services and to personal, cultural, and recreational services2 | −14.0 | −14.1 | −15.9 | −16.7 | −16.0 | −16.6 | −18.0 | −17.1 | −18.0 | −17.2 | −17.6 |
| Improved universe estimation method and newly available and revised source data | 1.5 | 1.7 | −0.1 | 0.6 | 2.3 | 3.9 | 4.9 | 6.4 | 10.5 | 7.7 | 6.2 |
| Telecommunications, computer, and information services | |||||||||||
| Revised | 24.9 | 26.6 | 29.4 | 33.5 | 36.3 | 38.6 | 41.4 | 43.1 | 47.7 | 49.7 | 55.7 |
| Previously published | 23.8 | 25.0 | 29.2 | 32.5 | 34.4 | 34.7 | 36.6 | 38.2 | 42.0 | 43.2 | 47.8 |
| Amount of revision | 1.1 | 1.5 | 0.2 | 1.0 | 1.9 | 3.9 | 4.8 | 4.9 | 5.7 | 6.5 | 7.8 |
| Reclassification from charges for the use of intellectual property n.i.e. | 0.1 | 0.2 | 0.2 | 0.5 | 0.5 | 0.6 | 0.5 | 0.7 | 0.8 | 0.3 | 0.1 |
| Improved universe estimation method and newly available and revised source data | 1.0 | 1.3 | (*) | 0.6 | 1.4 | 3.4 | 4.3 | 4.2 | 4.8 | 6.2 | 7.8 |
| Other business services | |||||||||||
| Revised | 93.5 | 99.6 | 108.4 | 118.5 | 122.2 | 132.2 | 141.4 | 153.1 | 167.3 | 177.3 | 189.4 |
| Previously published | 96.0 | 101.0 | 112.6 | 120.4 | 121.5 | 128.9 | 137.1 | 144.6 | 157.2 | 165.8 | 180.1 |
| Amount of revision | −2.5 | −1.4 | −4.1 | −1.9 | 0.6 | 3.3 | 4.3 | 8.5 | 10.1 | 11.4 | 9.4 |
| Reclassification from maintenance and repair services n.i.e. | 1.2 | 1.4 | 1.5 | 2.2 | 2.8 | 3.3 | 3.9 | 3.7 | 3.9 | 3.4 | 4.4 |
| Reclassification to construction | −4.0 | −2.8 | −3.1 | −3.2 | −2.1 | −1.9 | −2.5 | −1.4 | −1.8 | −2.6 | −2.9 |
| Reclassification to personal, cultural, and recreational services and reclassification from charges for the use of intellectual property n.i.e.2 | −2.7 | −3.3 | −3.5 | −3.6 | −3.6 | −3.9 | −3.8 | −3.8 | −4.3 | −3.6 | −3.9 |
| Improved universe estimation method and newly available and revised source data | 3.1 | 3.3 | 0.9 | 2.7 | 3.6 | 5.8 | 6.7 | 10.0 | 12.2 | 14.2 | 11.8 |
| Personal, cultural, and recreational services | |||||||||||
| Revised | 16.9 | 17.6 | 19.5 | 21.1 | 20.9 | 22.6 | 24.2 | 23.6 | 25.7 | 23.8 | 23.4 |
| Previously published1 | ..... | ..... | ..... | ..... | ..... | ..... | ..... | ..... | ..... | ..... | ..... |
| Amount of revision | 16.9 | 17.6 | 19.5 | 21.1 | 20.9 | 22.6 | 24.2 | 23.6 | 25.7 | 23.8 | 23.4 |
| Reclassifications from charges for the use of intellectual property n.i.e. and from other business services2 | 16.8 | 17.4 | 19.4 | 20.3 | 19.5 | 20.5 | 21.8 | 20.8 | 22.3 | 20.9 | 21.5 |
| Improved universe estimation method and newly available and revised source data | 0.2 | 0.2 | 0.1 | 0.8 | 1.3 | 2.1 | 2.4 | 2.8 | 3.4 | 2.9 | 1.9 |
| Government goods and services n.i.e. | |||||||||||
| Revised | 20.5 | 19.2 | 21.5 | 22.1 | 21.9 | 19.7 | 20.1 | 18.8 | 19.9 | 21.9 | 22.6 |
| Previously published | 20.5 | 19.2 | 21.5 | 22.1 | 21.9 | 19.7 | 20.1 | 18.8 | 19.7 | 21.2 | 21.5 |
| Amount of revision | 0.0 | 0.0 | 0.0 | 0.0 | 0.0 | 0.0 | 0.0 | 0.0 | 0.3 | 0.7 | 1.1 |
| Newly available and revised source data | 0.0 | 0.0 | 0.0 | 0.0 | 0.0 | 0.0 | 0.0 | 0.0 | 0.3 | 0.7 | 1.1 |
| Primary income receipts | |||||||||||
| Revised | 653.2 | 723.2 | 791.5 | 791.7 | 811.6 | 845.9 | 825.1 | 857.8 | 997.5 | 1,108.5 | 1,135.7 |
| Previously published | 613.2 | 680.2 | 755.9 | 768.0 | 792.8 | 824.5 | 810.1 | 835.5 | 933.3 | 1,084.2 | 1,123.1 |
| Amount of revision | 40.0 | 43.1 | 35.5 | 23.7 | 18.7 | 21.4 | 15.0 | 22.3 | 64.2 | 24.3 | 12.6 |
| Direct investment | |||||||||||
| Revised | 369.2 | 443.0 | 473.6 | 464.8 | 476.2 | 482.1 | 454.9 | 467.3 | 561.1 | 587.9 | 578.1 |
| Previously published | 369.2 | 443.0 | 473.6 | 464.8 | 476.2 | 482.1 | 459.9 | 461.8 | 509.8 | 574.5 | 580.0 |
| Amount of revision | 0.0 | 0.0 | 0.0 | 0.0 | 0.0 | 0.0 | −5.0 | 5.6 | 51.3 | 13.4 | −1.9 |
| Newly available and revised source data | 0.0 | 0.0 | 0.0 | 0.0 | 0.0 | 0.0 | −5.0 | 5.6 | 51.3 | 13.4 | −1.9 |
| Portfolio investment | |||||||||||
| Revised | 184.4 | 194.7 | 237.1 | 260.2 | 278.2 | 304.9 | 312.0 | 326.6 | 355.3 | 412.5 | 426.4 |
| Previously published | 184.4 | 194.9 | 237.3 | 260.4 | 278.4 | 305.0 | 312.0 | 326.3 | 354.5 | 411.2 | 427.6 |
| Amount of revision | −0.1 | −0.1 | −0.3 | −0.3 | −0.2 | −0.1 | (*) | 0.2 | 0.9 | 1.3 | −1.2 |
| FISIM-related changes to primary income | −0.1 | −0.1 | −0.3 | −0.3 | −0.2 | −0.1 | (*) | 0.2 | 0.9 | 2.1 | 1.6 |
| Newly available and revised source data | 0.0 | 0.0 | 0.0 | 0.0 | 0.0 | 0.0 | (*) | (*) | (*) | −0.8 | −2.9 |
| Other investment | |||||||||||
| Revised | 93.2 | 78.8 | 73.8 | 59.9 | 50.1 | 52.2 | 51.4 | 57.5 | 74.4 | 100.8 | 123.6 |
| Previously published | 53.1 | 35.7 | 38.0 | 36.0 | 31.2 | 30.7 | 31.3 | 41.0 | 62.6 | 91.2 | 107.8 |
| Amount of revision | 40.0 | 43.2 | 35.8 | 24.0 | 18.9 | 21.5 | 20.0 | 16.5 | 11.8 | 9.6 | 15.9 |
| FISIM-related changes to primary income | 39.9 | 42.7 | 35.6 | 23.2 | 19.8 | 21.4 | 19.9 | 16.7 | 12.1 | 8.6 | 16.1 |
| Improved universe estimation method and newly available and revised source data | 0.2 | 0.4 | 0.2 | 0.7 | −0.9 | 0.1 | 0.1 | −0.2 | −0.2 | 1.0 | −0.3 |
| Compensation of employees | |||||||||||
| Revised | 5.7 | 5.9 | 6.1 | 6.3 | 6.6 | 6.5 | 6.6 | 6.3 | 6.3 | 6.7 | 6.7 |
| Previously published | 5.7 | 5.9 | 6.1 | 6.3 | 6.6 | 6.5 | 6.6 | 6.3 | 6.1 | 6.7 | 6.8 |
| Amount of revision | 0.0 | 0.0 | 0.0 | 0.0 | 0.0 | 0.0 | 0.0 | 0.0 | 0.2 | (*) | −0.1 |
| Newly available and revised source data | 0.0 | 0.0 | 0.0 | 0.0 | 0.0 | 0.0 | 0.0 | 0.0 | 0.2 | (*) | −0.1 |
| Secondary income receipts | |||||||||||
| Revised | 85.2 | 91.9 | 101.7 | 112.1 | 126.0 | 140.9 | 131.5 | 139.7 | 157.1 | 145.0 | 142.0 |
| Previously published | 86.8 | 90.8 | 99.7 | 108.7 | 126.0 | 140.6 | 130.5 | 137.2 | 159.0 | 150.2 | 142.8 |
| Amount of revision | −1.6 | 1.1 | 2.0 | 3.4 | (*) | 0.3 | 1.0 | 2.5 | −1.9 | −5.2 | −0.8 |
| Newly available and revised source data | −1.6 | 1.1 | 2.0 | 3.4 | (*) | 0.3 | 1.0 | 2.5 | −1.9 | −5.2 | −0.8 |
| Capital transfer receipts and other credits | |||||||||||
| Revised | (*) | (*) | (*) | 7.7 | (*) | (*) | 0.1 | 0.1 | 19.2 | 3.3 | 0.1 |
| Previously published | 0.0 | 0.0 | 0.0 | 7.7 | 0.0 | 0.0 | 0.0 | 0.0 | 19.2 | 3.2 | 0.0 |
| Amount of revision | (*) | (*) | (*) | (*) | (*) | (*) | 0.1 | 0.1 | (*) | (*) | 0.1 |
| Reclassifications from exports of services | (*) | (*) | (*) | (*) | (*) | (*) | 0.1 | 0.1 | (*) | (*) | 0.1 |
| Newly available and revised source data | 0.0 | 0.0 | 0.0 | 0.0 | 0.0 | 0.0 | 0.0 | 0.0 | 0.0 | 0.0 | 0.0 |
| Imports of goods and services and income payments | |||||||||||
| Revised | 2,710.9 | 3,119.5 | 3,492.0 | 3,569.3 | 3,587.6 | 3,746.9 | 3,643.7 | 3,630.3 | 3,907.3 | 4,242.6 | 4,286.2 |
| Previously published | 2,655.6 | 3,055.3 | 3,427.2 | 3,521.9 | 3,561.8 | 3,707.0 | 3,615.1 | 3,616.9 | 3,884.5 | 4,226.7 | 4,262.3 |
| Amount of revision | 55.3 | 64.2 | 64.8 | 47.4 | 25.8 | 40.0 | 28.7 | 13.4 | 22.8 | 15.9 | 23.9 |
| Imports of goods | |||||||||||
| Revised | 1,580.0 | 1,939.0 | 2,239.9 | 2,303.7 | 2,294.2 | 2,385.5 | 2,273.2 | 2,207.2 | 2,356.3 | 2,557.3 | 2,516.8 |
| Previously published | 1,580.0 | 1,939.0 | 2,239.9 | 2,303.7 | 2,294.2 | 2,385.5 | 2,273.2 | 2,207.2 | 2,358.8 | 2,561.7 | 2,519.0 |
| Amount of revision | 0.0 | 0.0 | 0.0 | 0.0 | 0.0 | 0.0 | 0.0 | 0.0 | −2.4 | −4.4 | −2.3 |
| Newly available and revised source data | 0.0 | 0.0 | 0.0 | 0.0 | 0.0 | 0.0 | 0.0 | 0.0 | −2.4 | −4.4 | −2.3 |
| Imports of services | |||||||||||
| Revised | 407.5 | 436.5 | 458.2 | 469.6 | 465.8 | 490.9 | 497.8 | 511.9 | 544.8 | 562.1 | 588.4 |
| Previously published | 386.8 | 409.3 | 435.8 | 452.0 | 461.1 | 480.8 | 492.0 | 511.6 | 543.9 | 567.3 | 595.4 |
| Amount of revision | 20.7 | 27.1 | 22.4 | 17.6 | 4.7 | 10.2 | 5.8 | 0.3 | 1.0 | −5.3 | −7.1 |
| Reclassification to capital-account payments | (*) | (*) | (*) | (*) | (*) | (*) | (*) | (*) | −0.1 | −0.1 | −0.1 |
| Improved estimation methods and newly available and revised source data | 20.7 | 27.2 | 22.4 | 17.6 | 4.8 | 10.2 | 5.8 | 0.3 | 1.0 | −5.2 | −6.9 |
| Manufacturing services on physical inputs owned by others (new major category) | n.a. | n.a. | n.a. | n.a. | n.a. | n.a. | n.a. | n.a. | n.a. | n.a. | n.a. |
| Maintenance and repair services n.i.e. | |||||||||||
| Revised | 5.3 | 5.9 | 7.2 | 7.1 | 6.7 | 6.7 | 8.1 | 7.6 | 6.8 | 7.1 | 7.8 |
| Previously published | 5.9 | 6.9 | 8.2 | 8.0 | 7.4 | 7.5 | 9.0 | 8.8 | 8.4 | 8.7 | 8.8 |
| Amount of revision | −0.7 | −1.1 | −1.1 | −0.9 | −0.7 | −0.8 | −0.9 | −1.2 | −1.6 | −1.6 | −1.0 |
| Reclassification of installation services to other business services | −0.3 | −1.0 | −1.1 | −0.8 | −0.5 | −0.5 | −0.5 | −1.0 | −1.9 | −2.2 | −2.1 |
| Improved universe estimation method and newly available and revised source data | −0.4 | (*) | (*) | −0.1 | −0.3 | −0.3 | −0.5 | −0.1 | 0.3 | 0.6 | 1.1 |
| Transport | |||||||||||
| Revised | 75.8 | 88.4 | 95.0 | 99.3 | 94.4 | 99.8 | 99.6 | 92.4 | 96.5 | 106.3 | 107.5 |
| Previously published | 64.1 | 74.6 | 81.4 | 85.0 | 90.6 | 94.2 | 97.0 | 97.0 | 101.8 | 108.2 | 110.1 |
| Amount of revision | 11.7 | 13.8 | 13.7 | 14.3 | 3.8 | 5.6 | 2.6 | −4.6 | −5.2 | −1.9 | −2.7 |
| Improved method for estimating air passenger transport | 11.1 | 15.2 | 17.2 | 18.3 | 9.2 | 9.1 | 6.5 | 1.1 | 1.5 | 4.5 | 4.5 |
| Improved estimation methods and newly available and revised source data for estimating sea freight and port services | 0.6 | −1.5 | −3.6 | −3.9 | −7.1 | −5.8 | −4.6 | −4.5 | −5.7 | −5.7 | −6.6 |
| Newly available and revised source data for air port services | 0.0 | 0.0 | 0.0 | 0.0 | 1.7 | 2.3 | 0.6 | −1.1 | −1.0 | −0.7 | −0.6 |
| Travel (for all purposes including education) | |||||||||||
| Revised | 82.5 | 85.2 | 86.6 | 90.3 | 91.1 | 96.2 | 102.7 | 109.2 | 118.0 | 126.0 | 134.6 |
| Previously published | 81.4 | 86.6 | 89.7 | 100.3 | 98.1 | 105.7 | 114.5 | 123.5 | 134.9 | 144.5 | 152.3 |
| Amount of revision | 1.1 | −1.5 | −3.1 | −10.0 | −7.0 | −9.4 | −11.9 | −14.4 | −16.9 | −18.5 | −17.7 |
| Improved estimation methods | 1.1 | −1.5 | −3.1 | −10.0 | −7.0 | −9.4 | −11.9 | −14.4 | −16.9 | −18.5 | −17.7 |
| Construction | |||||||||||
| Revised | 3.7 | 2.6 | 3.0 | 3.3 | 2.6 | 2.3 | 3.0 | 1.8 | 2.0 | 3.2 | 1.3 |
| Previously published1 | ..... | ..... | ..... | ..... | ..... | ..... | ..... | ..... | ..... | ..... | ..... |
| Amount of revision | 3.7 | 2.6 | 3.0 | 3.3 | 2.6 | 2.3 | 3.0 | 1.8 | 2.0 | 3.2 | 1.3 |
| Reclassification from other business services | 3.6 | 2.5 | 2.9 | 3.3 | 2.5 | 2.2 | 2.9 | 1.6 | 1.7 | 2.7 | 3.0 |
| Improved universe estimation method and newly available and revised source data | 0.1 | 0.1 | 0.1 | 0.1 | 0.1 | 0.1 | 0.1 | 0.1 | 0.2 | 0.5 | −1.6 |
| Insurance services | |||||||||||
| Revised | 64.0 | 63.5 | 58.3 | 58.7 | 53.0 | 52.8 | 49.8 | 52.1 | 50.9 | 43.7 | 51.5 |
| Previously published | 63.8 | 61.5 | 55.7 | 55.5 | 53.4 | 51.0 | 47.4 | 50.1 | 50.6 | 42.5 | 48.6 |
| Amount of revision | 0.2 | 2.0 | 2.6 | 3.2 | −0.4 | 1.7 | 2.4 | 1.9 | 0.3 | 1.3 | 3.0 |
| Improved universe estimation method and newly available and revised source data | 0.2 | 2.0 | 2.6 | 3.2 | −0.4 | 1.7 | 2.4 | 1.9 | 0.3 | 1.3 | 3.0 |
| Financial services | |||||||||||
| Revised | 24.9 | 27.2 | 30.3 | 28.7 | 29.3 | 32.8 | 32.6 | 32.7 | 36.6 | 39.2 | 40.4 |
| Previously published | 14.4 | 15.5 | 17.4 | 16.7 | 21.5 | 24.9 | 25.8 | 25.7 | 29.0 | 31.3 | 33.7 |
| Amount of revision | 10.5 | 11.7 | 12.9 | 12.0 | 7.7 | 7.9 | 6.8 | 7.0 | 7.7 | 8.0 | 6.7 |
| Introduction of FISIM | 10.1 | 10.1 | 10.2 | 8.0 | 7.1 | 7.3 | 6.6 | 6.2 | 6.6 | 7.2 | 7.1 |
| Introduction of market-making services | 0.4 | 0.3 | 0.3 | 0.3 | 0.3 | 0.3 | 0.2 | 0.2 | 0.2 | 0.2 | 0.2 |
| Improved universe estimation method and newly available and revised source data | (*) | 1.3 | 2.4 | 3.7 | 0.3 | 0.3 | (*) | 0.5 | 0.9 | 0.5 | −0.7 |
| Charges for the use of intellectual property n.i.e. | |||||||||||
| Revised | 29.4 | 31.1 | 32.9 | 35.1 | 35.3 | 37.6 | 35.2 | 42.0 | 44.4 | 43.9 | 42.7 |
| Previously published | 31.3 | 32.6 | 36.1 | 38.7 | 38.9 | 42.0 | 40.6 | 47.0 | 53.4 | 56.1 | 57.1 |
| Amount of revision | −1.9 | −1.4 | −3.2 | −3.6 | −3.6 | −4.4 | −5.4 | −5.0 | −9.0 | −12.2 | −14.3 |
| Reclassification to capital-account payments | (*) | (*) | (*) | (*) | (*) | (*) | (*) | (*) | −0.1 | −0.1 | −0.1 |
| Reclassification to telecommunications, computer, and information services | −0.1 | −0.2 | −0.1 | −0.2 | −0.2 | −0.2 | −0.2 | −0.2 | −0.2 | −0.1 | −0.1 |
| Reclassifications to other business services and to personal, cultural, and recreational services2 | −2.4 | −2.2 | −3.0 | −3.7 | −4.4 | −5.7 | −7.5 | −8.3 | −12.8 | −13.9 | −15.3 |
| Improved universe estimation method and newly available and revised source data | 0.7 | 1.0 | (*) | 0.3 | 1.1 | 1.5 | 2.3 | 3.6 | 4.1 | 1.9 | 1.2 |
| Telecommunications, computer, and information services | |||||||||||
| Revised | 26.0 | 29.4 | 32.8 | 33.3 | 35.9 | 38.5 | 38.8 | 39.7 | 43.1 | 42.6 | 43.7 |
| Previously published | 25.8 | 29.0 | 32.8 | 32.8 | 35.0 | 36.5 | 36.7 | 37.4 | 39.6 | 41.2 | 43.2 |
| Amount of revision | 0.3 | 0.4 | 0.1 | 0.5 | 0.8 | 2.0 | 2.1 | 2.3 | 3.5 | 1.4 | 0.6 |
| Reclassification from charges for the use of intellectual property n.i.e. | 0.1 | 0.2 | 0.1 | 0.2 | 0.2 | 0.2 | 0.2 | 0.2 | 0.2 | 0.1 | 0.1 |
| Improved universe estimation method and newly available and revised source data | 0.2 | 0.2 | (*) | 0.3 | 0.6 | 1.8 | 1.9 | 2.1 | 3.2 | 1.3 | 0.5 |
| Other business services | |||||||||||
| Revised | 59.5 | 65.9 | 74.1 | 78.7 | 84.0 | 90.7 | 95.1 | 100.5 | 107.0 | 107.8 | 113.6 |
| Previously published | 68.6 | 70.6 | 83.3 | 87.2 | 90.7 | 94.8 | 99.4 | 100.6 | 104.2 | 111.9 | 117.6 |
| Amount of revision | −9.0 | −4.7 | −9.2 | −8.5 | −6.7 | −4.1 | −4.2 | −0.1 | 2.8 | −4.0 | −4.0 |
| Reclassification from maintenance and repair services n.i.e. | 0.3 | 1.0 | 1.1 | 0.8 | 0.5 | 0.5 | 0.5 | 1.0 | 1.9 | 2.2 | 2.1 |
| Reclassification to construction | −3.6 | −2.5 | −2.9 | −3.3 | −2.5 | −2.2 | −2.9 | −1.6 | −1.7 | −2.7 | −3.0 |
| Reclassification to personal, cultural, and recreational services and reclassification from charges for the use of intellectual property n.i.e.2 | −2.5 | −3.1 | −3.8 | −3.5 | −3.4 | −3.0 | −3.4 | −3.4 | −3.9 | −4.4 | −5.4 |
| Improved universe estimation method and newly available and revised source data | −3.3 | −0.2 | −3.6 | −2.6 | −1.2 | 0.7 | 1.5 | 3.9 | 6.5 | 0.9 | 2.3 |
| Personal, cultural, and recreational services | |||||||||||
| Revised | 5.0 | 5.4 | 6.6 | 7.2 | 8.2 | 9.3 | 11.4 | 12.5 | 17.5 | 19.2 | 21.1 |
| Previously published1 | ..... | ..... | ..... | ..... | ..... | ..... | ..... | ..... | ..... | ..... | ..... |
| Amount of revision | 5.0 | 5.4 | 6.6 | 7.2 | 8.2 | 9.3 | 11.4 | 12.5 | 17.5 | 19.2 | 21.1 |
| Reclassifications from charges for the use of intellectual property n.i.e. and from other business services2 | 4.9 | 5.3 | 6.8 | 7.2 | 7.8 | 8.7 | 10.9 | 11.7 | 16.7 | 18.3 | 20.8 |
| Improved universe estimation method and newly available and revised source data | 0.1 | 0.1 | −0.1 | (*) | 0.4 | 0.6 | 0.5 | 0.8 | 0.8 | 0.9 | 0.4 |
| Government goods and services n.i.e. | |||||||||||
| Revised | 31.5 | 32.0 | 31.3 | 27.9 | 25.3 | 24.2 | 21.5 | 21.5 | 22.0 | 23.0 | 24.1 |
| Previously published | 31.5 | 32.0 | 31.3 | 27.9 | 25.3 | 24.2 | 21.5 | 21.5 | 22.0 | 23.0 | 24.1 |
| Amount of revision | 0.0 | 0.0 | 0.0 | 0.0 | 0.0 | 0.0 | 0.0 | 0.0 | 0.0 | 0.0 | (*) |
| Newly available and revised source data | 0.0 | 0.0 | 0.0 | 0.0 | 0.0 | 0.0 | 0.0 | 0.0 | 0.0 | 0.0 | (*) |
| Primary income payments | |||||||||||
| Revised | 537.7 | 553.3 | 589.0 | 593.8 | 616.0 | 645.6 | 639.7 | 660.8 | 739.7 | 857.3 | 899.3 |
| Previously published | 498.1 | 511.9 | 544.9 | 560.5 | 586.8 | 606.2 | 606.5 | 636.9 | 707.5 | 830.2 | 866.1 |
| Amount of revision | 39.6 | 41.4 | 44.2 | 33.3 | 29.2 | 39.5 | 33.3 | 23.9 | 32.2 | 27.1 | 33.2 |
| Direct investment | |||||||||||
| Revised | 119.9 | 164.5 | 184.9 | 179.3 | 192.9 | 197.8 | 177.6 | 177.6 | 210.7 | 245.4 | 248.8 |
| Previously published | 119.9 | 164.5 | 184.9 | 179.3 | 192.9 | 197.8 | 175.3 | 183.8 | 205.8 | 244.2 | 245.8 |
| Amount of revision | 0.0 | 0.0 | 0.0 | 0.0 | 0.0 | 0.0 | 2.3 | −6.2 | 4.9 | 1.2 | 3.0 |
| Newly available and revised source data | 0.0 | 0.0 | 0.0 | 0.0 | 0.0 | 0.0 | 2.3 | −6.2 | 4.9 | 1.2 | 3.0 |
| Portfolio investment | |||||||||||
| Revised | 332.3 | 315.6 | 332.2 | 351.3 | 365.1 | 384.4 | 399.5 | 416.9 | 445.9 | 488.2 | 495.6 |
| Previously published | 332.5 | 313.5 | 324.9 | 345.2 | 361.8 | 377.4 | 398.6 | 407.6 | 433.6 | 471.8 | 485.2 |
| Amount of revision | −0.2 | 2.0 | 7.2 | 6.1 | 3.4 | 7.0 | 0.9 | 9.3 | 12.3 | 16.4 | 10.4 |
| FISIM-related changes to primary income | (*) | (*) | (*) | (*) | (*) | (*) | (*) | (*) | 0.2 | 0.3 | 0.3 |
| Introduction of income from inflation adjustments to Treasury Inflation Protected Securities | −0.2 | 2.0 | 7.3 | 6.1 | 3.4 | 7.0 | 0.9 | 9.2 | 12.2 | 15.4 | 11.8 |
| Newly available and revised source data | 0.0 | 0.0 | 0.0 | 0.0 | 0.0 | 0.0 | (*) | (*) | (*) | 0.7 | −1.7 |
| Other investment | |||||||||||
| Revised | 71.6 | 59.8 | 58.0 | 48.8 | 42.8 | 47.4 | 46.0 | 49.0 | 66.2 | 106.6 | 136.2 |
| Previously published | 31.3 | 20.0 | 20.8 | 21.0 | 16.1 | 13.8 | 15.0 | 26.7 | 49.2 | 94.6 | 114.8 |
| Amount of revision | 40.3 | 39.8 | 37.2 | 27.8 | 26.6 | 33.6 | 31.0 | 22.3 | 17.0 | 12.0 | 21.4 |
| FISIM-related changes to primary income | 40.3 | 39.7 | 37.3 | 27.9 | 26.8 | 33.6 | 31.0 | 22.2 | 17.1 | 10.9 | 21.6 |
| Improved universe estimation method and newly available and revised source data | (*) | (*) | −0.1 | −0.1 | −0.2 | (*) | (*) | 0.1 | (*) | 1.1 | −0.2 |
| Compensation of employees | |||||||||||
| Revised | 13.9 | 13.5 | 13.9 | 14.3 | 15.2 | 15.9 | 16.7 | 17.3 | 16.9 | 17.1 | 18.8 |
| Previously published | 14.4 | 14.0 | 14.2 | 14.9 | 16.0 | 17.1 | 17.7 | 18.7 | 19.0 | 19.6 | 20.3 |
| Amount of revision | −0.5 | −0.4 | −0.2 | −0.6 | −0.8 | −1.1 | −1.0 | −1.4 | −2.1 | −2.5 | −1.5 |
| Improvements to compensation methodology and newly available and revised source data | −0.5 | −0.4 | −0.2 | −0.6 | −0.8 | −1.1 | −1.0 | −1.4 | −2.1 | −2.5 | −1.5 |
| Secondary income payments | |||||||||||
| Revised | 185.7 | 190.7 | 204.9 | 202.2 | 211.5 | 224.9 | 233.0 | 250.4 | 266.4 | 265.9 | 281.7 |
| Previously published | 190.7 | 195.0 | 206.7 | 205.6 | 219.6 | 234.6 | 243.4 | 261.2 | 274.3 | 267.5 | 281.7 |
| Amount of revision | −5.0 | −4.3 | −1.8 | −3.4 | −8.1 | −9.7 | −10.4 | −10.8 | −7.9 | −1.5 | (*) |
| Reclassification to capital-account payments | −5.7 | −6.7 | −7.8 | −5.9 | −6.1 | −6.5 | −7.9 | −6.5 | −6.5 | −7.4 | −6.2 |
| Methodological improvements | −0.1 | −0.2 | 0.3 | 0.2 | 0.2 | −0.5 | 0.2 | −0.4 | −1.4 | 1.7 | 4.8 |
| Newly available and revised source data | 0.8 | 2.6 | 5.7 | 2.3 | −2.2 | −2.7 | −2.8 | −3.9 | (*) | 4.1 | 1.4 |
| Capital transfer payments and other debits | |||||||||||
| Revised | 5.9 | 6.9 | 9.0 | 6.8 | 6.6 | 6.6 | 8.0 | 6.7 | 6.8 | 7.5 | 6.3 |
| Previously published | 0.1 | 0.2 | 1.2 | 0.8 | 0.4 | (*) | (*) | 0.2 | 0.2 | (*) | (*) |
| Amount of revision | 5.7 | 6.7 | 7.8 | 6.0 | 6.2 | 6.5 | 8.0 | 6.5 | 6.6 | 7.5 | 6.3 |
| Reclassifications from secondary income | 5.7 | 6.7 | 7.8 | 5.9 | 6.1 | 6.5 | 7.9 | 6.5 | 6.5 | 7.4 | 6.2 |
| Reclassifications from imports of services | (*) | (*) | (*) | (*) | (*) | (*) | (*) | (*) | 0.1 | 0.1 | 0.1 |
| Newly available and revised source data | (*) | (*) | (*) | (*) | (*) | 0.1 | 0.1 | 0.1 | (*) | (*) | (*) |
- (*)
- A nonzero value between −$50,000,000 and $50,000,000.
- n.a.
- Transactions are possible, but data are not available.
- .....
- Not applicable
- n.i.e.
- Not included elsewhere
Note. Reclassifications were calculated using unrevised values.
- Introduced in the 2020 annual update as a major category.
- The value of reclassifications to or from more than one major category were combined to avoid the disclosure of data of individual companies.
Primary income. Primary income receipts for 1999–2005 and 2008–2019 were revised up, while income receipts for 2006 and 2007 were revised down. The revisions for 1999–2014 reflect revisions to other investment income receipts, and the revisions for 2016–2018 mostly reflect the combination of revisions to direct investment income and other investment income. For 2015 and 2019, the revisions are more than accounted for by revisions to other investment income. Revisions to other investment income receipts mostly reflect FISIM-related changes to the methodology and source data used for estimation. For 2015, revisions to direct investment income receipts reflect revisions to current-cost adjustments due to newly available and revised source data from BEA annual direct investment surveys and from the BEA national accounts.22 For 2016–2019, revisions also reflect newly available and revised income data from BEA’s quarterly and annual direct investment surveys.
Primary income payments for 1999–2019 were revised upward each year. The largest upward revisions are in other investment income payments, which reflect FISIM-related changes, and in portfolio investment income, which reflect the introduction of estimates of income arising from inflation adjustments to TIPS.
Secondary income. Secondary income receipts were revised down for 1999–2009 and for 2017–2019; they were revised up for 2010–2016. The downward revisions for 1999–2009 are mainly accounted for by downward revisions to other private transfer receipts, primarily social benefits, reflecting newly available source data on pension receipts from Germany. The revisions for 2009–2019 are mainly accounted for by revisions to other private transfer receipts, mainly insurance-related transfers, reflecting improvements in the estimation methodology for nonsampled and nonreporting units in BEA’s survey on insurance services.23 In addition, taxes on income were revised down for all years, with revisions increasing in magnitude over time. These revisions partly offset the upward revisions to insurance-related transfers in 2010–2016 and contributed to the downward revision to total secondary income receipts for 2009 and 2017–2019.
Secondary income payments were revised down for most years. The revisions are mainly accounted for by general government transfer payments, which are revised down for all years (1999–2019), reflecting the reclassification of investment grants from secondary income to capital transfer payments. The upward revisions in 1999 and 2001 reflect revisions to charitable donations payments, which were reestimated for 1999–2007 to address a break in series in 2008.
Capital-account highlights
The balance on the capital account was revised down for 1999–2019 (lower surpluses or higher deficits). The largest revision was a downward revision of $12.2 billion in the capital account surplus for 2005. Revisions to capital transfer payments reflect the reclassification of investment grants from secondary income in the current account to the capital account, and averaging $6.1 billion upward revision per year over the period. Revisions to capital transfer receipts and payments also reflect the inclusion of outright sales or purchases of franchises and trademarks, which were previously recorded under charges for the use of intellectual property, and the use of new data sources to improve coverage of transfer fees related to professional athletes.
Financial-account highlights
Financial-account statistics for 1999–2019 were updated to include the new category “other equity assets,” a component of other investment assets. Beginning with statistics for 2015, revisions also reflect revisions to current-cost adjustments due to newly available and revised source data from BEA annual direct investment surveys and from the BEA national accounts. Statistics for 2016–2019 were also revised to incorporate newly available and revised source data from BEA quarterly and annual direct investment surveys, TIC surveys, and updated seasonal factors. Revisions to net borrowing from financial-account transactions for 1999–2019 did not alter its direction of change for any year. The largest revisions to net borrowing from financial-account transactions were a downward revision of $25.8 billion for 2018 and a downward revision of $23.5 billion for 2017 (table G, chart 4).
| 1999 | 2000 | 2001 | 2002 | 2003 | 2004 | 2005 | 2006 | 2007 | 2008 | |
|---|---|---|---|---|---|---|---|---|---|---|
| Net U.S. acquisition of financial assets excluding financial derivatives (line 67): | ||||||||||
| Revised | 526.6 | 587.7 | 386.3 | 319.2 | 371.1 | 1058.7 | 563.0 | 1324.6 | 1563.5 | −317.6 |
| Previously published | 526.6 | 587.7 | 386.3 | 319.2 | 371.1 | 1058.7 | 563.0 | 1324.6 | 1563.5 | −317.6 |
| Amount of revision | 0.0 | 0.0 | (*) | (*) | (*) | (*) | (*) | (*) | (*) | (*) |
| Direct investment assets (line 68): | ||||||||||
| Revised | 247.5 | 186.4 | 146.0 | 179.0 | 195.2 | 374.0 | 52.6 | 283.8 | 523.9 | 343.6 |
| Previously published | 247.5 | 186.4 | 146.0 | 179.0 | 195.2 | 374.0 | 52.6 | 283.8 | 523.9 | 343.6 |
| Amount of revision | 0.0 | 0.0 | 0.0 | 0.0 | 0.0 | 0.0 | 0.0 | 0.0 | 0.0 | 0.0 |
| Portfolio investment assets (line 71): | ||||||||||
| Revised | 141.0 | 159.7 | 106.9 | 79.5 | 133.1 | 192.0 | 267.3 | 493.4 | 380.8 | −284.3 |
| Previously published | 141.0 | 159.7 | 106.9 | 79.5 | 133.1 | 192.0 | 267.3 | 493.4 | 380.8 | −284.3 |
| Amount of revision | 0.0 | 0.0 | 0.0 | 0.0 | 0.0 | 0.0 | 0.0 | 0.0 | 0.0 | 0.0 |
| Equity and investment fund shares (line 72): | ||||||||||
| Revised | 114.3 | 106.7 | 109.1 | 17.0 | 118.0 | 84.8 | 186.7 | 137.3 | 147.8 | −38.6 |
| Previously published | 114.3 | 106.7 | 109.1 | 17.0 | 118.0 | 84.8 | 186.7 | 137.3 | 147.8 | −38.6 |
| Amount of revision | 0.0 | 0.0 | 0.0 | 0.0 | 0.0 | 0.0 | 0.0 | 0.0 | 0.0 | 0.0 |
| Debt securities (line 73): | ||||||||||
| Revised | 26.7 | 53.0 | −2.2 | 62.6 | 15.1 | 107.2 | 80.6 | 356.0 | 233.0 | −245.7 |
| Previously published | 26.7 | 53.0 | −2.2 | 62.6 | 15.1 | 107.2 | 80.6 | 356.0 | 233.0 | −245.7 |
| Amount of revision | 0.0 | 0.0 | 0.0 | 0.0 | 0.0 | 0.0 | 0.0 | 0.0 | 0.0 | 0.0 |
| Other investment assets (line 76): | ||||||||||
| Revised | 146.9 | 241.3 | 128.4 | 57.0 | 44.4 | 495.5 | 257.2 | 549.8 | 658.6 | −381.8 |
| Previously published | 146.9 | 241.3 | 128.4 | 57.0 | 44.3 | 495.5 | 257.2 | 549.8 | 658.6 | −381.8 |
| Amount of revision | 0.0 | 0.0 | (*) | (*) | (*) | (*) | (*) | (*) | (*) | (*) |
| Other equity (line 77): | ||||||||||
| Revised | 1.5 | 1.4 | 1.6 | 1.4 | 1.3 | 1.9 | 1.1 | 1.9 | 1.6 | 1.3 |
| Previously published | ..... | ..... | ..... | ..... | ..... | ..... | ..... | ..... | ..... | ..... |
| Amount of revision | 1.5 | 1.4 | 1.6 | 1.4 | 1.3 | 1.9 | 1.1 | 1.9 | 1.6 | 1.3 |
| Reclassification from loans to other equity | 1.5 | 1.4 | 1.6 | 1.4 | 1.3 | 1.8 | 1.1 | 1.9 | 1.6 | 1.3 |
| Newly available and revised source data | 0.0 | 0.0 | (*) | (*) | (*) | (*) | (*) | (*) | (*) | (*) |
| Currency and deposits (line 78): | ||||||||||
| Revised | n.a. | n.a. | n.a. | n.a. | 51.3 | 240.4 | 82.9 | 154.0 | 375.1 | 123.5 |
| Previously published | n.a. | n.a. | n.a. | n.a. | 51.3 | 240.4 | 82.9 | 154.0 | 375.1 | 123.5 |
| Amount of revision | n.a. | n.a. | n.a. | n.a. | 0.0 | 0.0 | 0.0 | 0.0 | 0.0 | 0.0 |
| Loans (line 79): | ||||||||||
| Revised | n.a. | n.a. | n.a. | n.a. | −10.5 | 254.4 | 171.9 | 390.3 | 271.2 | −502.8 |
| Previously published | n.a. | n.a. | n.a. | n.a. | −9.3 | 256.2 | 173.0 | 392.3 | 272.8 | −501.6 |
| Amount of revision | n.a. | n.a. | n.a. | n.a. | −1.3 | −1.8 | −1.1 | −1.9 | −1.6 | −1.3 |
| Reclassification from loans to other equity | n.a. | n.a. | n.a. | n.a. | −1.3 | −1.8 | −1.1 | −1.9 | −1.6 | −1.3 |
| Newly available and revised source data | n.a. | n.a. | n.a. | n.a. | 0.0 | 0.0 | 0.0 | 0.0 | 0.0 | 0.0 |
| Net U.S. incurrence of liabilities excluding financial derivatives (line 91): | ||||||||||
| Revised | 765.2 | 1066.1 | 788.3 | 821.8 | 911.7 | 1600.9 | 1277.1 | 2120.5 | 2190.1 | 462.4 |
| Previously published | 765.2 | 1066.1 | 788.3 | 821.8 | 911.7 | 1600.9 | 1277.1 | 2120.5 | 2190.1 | 462.4 |
| Amount of revision | 0.0 | 0.0 | 0.0 | 0.0 | 0.0 | 0.0 | 0.0 | 0.0 | 0.0 | 0.0 |
| Direct investment liabilities (line 92): | ||||||||||
| Revised | 312.4 | 349.1 | 172.5 | 111.1 | 117.1 | 213.6 | 142.3 | 298.5 | 346.6 | 341.1 |
| Previously published | 312.4 | 349.1 | 172.5 | 111.1 | 117.1 | 213.6 | 142.3 | 298.5 | 346.6 | 341.1 |
| Amount of revision | 0.0 | 0.0 | 0.0 | 0.0 | 0.0 | 0.0 | 0.0 | 0.0 | 0.0 | 0.0 |
| Portfolio investment liabilities (line 95): | ||||||||||
| Revised | 278.7 | 442.0 | 431.5 | 504.2 | 550.2 | 867.3 | 832.0 | 1126.7 | 1156.6 | 523.7 |
| Previously published | 278.7 | 442.0 | 431.5 | 504.2 | 550.2 | 867.3 | 832.0 | 1126.7 | 1156.6 | 523.7 |
| Amount of revision | 0.0 | 0.0 | 0.0 | 0.0 | 0.0 | 0.0 | 0.0 | 0.0 | 0.0 | 0.0 |
| Equity and investment fund shares (line 96): | ||||||||||
| Revised | 112.3 | 193.6 | 121.5 | 54.1 | 34.0 | 61.8 | 89.3 | 145.5 | 275.6 | 126.8 |
| Previously published | 112.3 | 193.6 | 121.5 | 54.1 | 34.0 | 61.8 | 89.3 | 145.5 | 275.6 | 126.8 |
| Amount of revision | 0.0 | 0.0 | 0.0 | 0.0 | 0.0 | 0.0 | 0.0 | 0.0 | 0.0 | 0.0 |
| Debt securities (line 97): | ||||||||||
| Revised | 166.4 | 248.4 | 310.0 | 450.1 | 516.2 | 805.6 | 742.8 | 981.3 | 881.0 | 396.9 |
| Previously published | 166.4 | 248.4 | 310.0 | 450.1 | 516.2 | 805.6 | 742.8 | 981.3 | 881.0 | 396.9 |
| Amount of revision | 0.0 | 0.0 | 0.0 | 0.0 | 0.0 | 0.0 | 0.0 | 0.0 | 0.0 | 0.0 |
| Other investment liabilities (line 100): | ||||||||||
| Revised | 174.1 | 275.0 | 184.4 | 206.6 | 244.4 | 519.9 | 302.7 | 695.3 | 686.9 | −402.4 |
| Previously published | 174.1 | 275.0 | 184.4 | 206.6 | 244.4 | 519.9 | 302.7 | 695.3 | 686.9 | −402.4 |
| Amount of revision | 0.0 | 0.0 | 0.0 | 0.0 | 0.0 | 0.0 | 0.0 | 0.0 | 0.0 | 0.0 |
| Currency and deposits (line 102): | ||||||||||
| Revised | n.a. | n.a. | n.a. | n.a. | 30.8 | 131.5 | −124.8 | 224.4 | 239.3 | 74.4 |
| Previously published | n.a. | n.a. | n.a. | n.a. | 30.8 | 131.5 | −124.8 | 224.4 | 239.3 | 74.4 |
| Amount of revision | n.a. | n.a. | n.a. | n.a. | 0.0 | 0.0 | 0.0 | 0.0 | 0.0 | 0.0 |
| Loans (line 103): | ||||||||||
| Revised | n.a. | n.a. | n.a. | n.a. | 214.5 | 386.4 | 415.8 | 465.2 | 427.0 | −483.6 |
| Previously published | n.a. | n.a. | n.a. | n.a. | 214.5 | 386.4 | 415.8 | 465.2 | 427.0 | −483.6 |
| Amount of revision | n.a. | n.a. | n.a. | n.a. | 0.0 | 0.0 | 0.0 | 0.0 | 0.0 | 0.0 |
| Financial derivatives other than reserves, net transactions (line 107): | ||||||||||
| Revised | n.a. | n.a. | n.a. | n.a. | n.a. | n.a. | n.a. | −29.7 | −6.2 | 32.9 |
| Previously published | n.a. | n.a. | n.a. | n.a. | n.a. | n.a. | n.a. | −29.7 | −6.2 | 32.9 |
| Amount of revision | n.a. | n.a. | n.a. | n.a. | n.a. | n.a. | n.a. | 0.0 | 0.0 | 0.0 |
| Net lending (+) or net borrowing (−) from financial-account transactions (line 117): | ||||||||||
| Revised | −238.6 | −478.4 | −402.0 | −502.7 | −540.6 | −542.2 | −714.1 | −825.6 | −632.8 | −747.1 |
| Previously published | −238.6 | −478.4 | −402.0 | −502.7 | −540.6 | −542.2 | −714.1 | −825.6 | −632.9 | −747.1 |
| Amount of revision | 0.0 | 0.0 | (*) | (*) | (*) | (*) | (*) | (*) | (*) | (*) |
| 2009 | 2010 | 2011 | 2012 | 2013 | 2014 | 2015 | 2016 | 2017 | 2018 | 2019 | |
|---|---|---|---|---|---|---|---|---|---|---|---|
| Net U.S. acquisition of financial assets excluding financial derivatives (line 67): | |||||||||||
| Revised | 131.1 | 958.7 | 492.6 | 176.9 | 649.8 | 866.7 | 197.4 | 335.2 | 1188.2 | 359.0 | 440.8 |
| Previously published | 131.1 | 958.7 | 492.5 | 176.8 | 649.6 | 866.5 | 202.2 | 353.0 | 1167.4 | 310.8 | 426.9 |
| Amount of revision | (*) | (*) | (*) | 0.2 | 0.2 | 0.2 | −4.8 | −17.8 | 20.7 | 48.1 | 13.8 |
| Direct investment assets (line 68): | |||||||||||
| Revised | 312.6 | 349.8 | 436.6 | 377.2 | 392.8 | 387.5 | 302.1 | 299.8 | 405.4 | −151.3 | 188.5 |
| Previously published | 312.6 | 349.8 | 436.6 | 377.2 | 392.8 | 387.5 | 307.1 | 318.3 | 384.6 | −78.5 | 197.7 |
| Amount of revision | 0.0 | 0.0 | 0.0 | 0.0 | 0.0 | 0.0 | −5.0 | −18.5 | 20.8 | −72.8 | −9.2 |
| Portfolio investment assets (line 71): | |||||||||||
| Revised | 375.9 | 199.6 | 85.4 | 248.8 | 481.3 | 582.7 | 160.4 | 36.3 | 569.4 | 335.3 | 46.6 |
| Previously published | 375.9 | 199.6 | 85.4 | 248.8 | 481.3 | 582.7 | 160.4 | 36.3 | 569.4 | 334.0 | 35.9 |
| Amount of revision | 0.0 | 0.0 | 0.0 | 0.0 | 0.0 | 0.0 | 0.0 | 0.0 | (*) | 1.2 | 10.7 |
| Equity and investment fund shares (line 72): | |||||||||||
| Revised | 63.7 | 79.2 | 7.0 | 104.0 | 287.4 | 431.6 | 196.9 | 21.7 | 139.9 | 171.3 | −191.3 |
| Previously published | 63.7 | 79.2 | 7.0 | 104.0 | 287.4 | 431.6 | 196.9 | 21.7 | 139.9 | 194.1 | −251.0 |
| Amount of revision | 0.0 | 0.0 | 0.0 | 0.0 | 0.0 | 0.0 | 0.0 | 0.0 | 0.0 | −22.8 | 59.7 |
| Debt securities (line 73): | |||||||||||
| Revised | 312.2 | 120.5 | 78.4 | 144.8 | 193.9 | 151.1 | −36.5 | 14.5 | 429.4 | 164.0 | 237.9 |
| Previously published | 312.2 | 120.5 | 78.4 | 144.8 | 193.9 | 151.1 | −36.5 | 14.5 | 429.4 | 139.9 | 286.8 |
| Amount of revision | 0.0 | 0.0 | 0.0 | 0.0 | 0.0 | 0.0 | 0.0 | 0.0 | (*) | 24.0 | −49.0 |
| Other investment assets (line 76): | |||||||||||
| Revised | −609.7 | 407.5 | −45.3 | −453.5 | −221.2 | −99.9 | −258.8 | −3.0 | 215.1 | 170.0 | 201.1 |
| Previously published | −609.7 | 407.4 | −45.3 | −453.7 | −221.4 | −100.1 | −259.0 | −3.7 | 215.2 | 50.3 | 188.7 |
| Amount of revision | (*) | (*) | (*) | 0.2 | 0.2 | 0.2 | 0.1 | 0.7 | −0.1 | 119.8 | 12.3 |
| Other equity (line 77): | |||||||||||
| Revised | 1.6 | 1.9 | 1.7 | 2.2 | 2.0 | 2.1 | 2.1 | 1.7 | 1.5 | 1.3 | 1.4 |
| Previously published | ..... | ..... | ..... | ..... | ..... | ..... | ..... | ..... | ..... | ..... | ..... |
| Amount of revision | 1.6 | 1.9 | 1.7 | 2.2 | 2.0 | 2.1 | 2.1 | 1.7 | 1.5 | 1.3 | 1.4 |
| Reclassification from loans to other equity | 1.6 | 1.9 | 1.7 | 2.1 | 2.0 | 2.0 | 2.1 | 1.7 | 1.5 | 1.3 | 1.3 |
| Newly available and revised source data | (*) | (*) | (*) | (*) | (*) | (*) | 0.0 | (*) | (*) | (*) | 0.1 |
| Currency and deposits (line 78): | |||||||||||
| Revised | −394.5 | 150.2 | −89.2 | −521.9 | −127.0 | −160.5 | −191.5 | −91.0 | 173.4 | 106.1 | 132.6 |
| Previously published | −394.5 | 150.2 | −89.2 | −521.9 | −127.0 | −160.5 | −191.5 | −91.3 | 169.2 | 71.8 | 106.2 |
| Amount of revision | 0.0 | 0.0 | 0.0 | 0.0 | 0.0 | 0.0 | 0.0 | 0.3 | 4.1 | 34.3 | 26.4 |
| Loans (line 79): | |||||||||||
| Revised | −217.3 | 249.3 | 38.1 | 65.6 | −106.1 | 64.3 | −67.8 | 85.4 | 34.8 | 61.4 | 66.1 |
| Previously published | −215.7 | 251.1 | 39.8 | 67.5 | −104.3 | 66.2 | −65.8 | 86.8 | 40.2 | −22.4 | 81.4 |
| Amount of revision | −1.6 | −1.9 | −1.7 | −2.0 | −1.9 | −1.9 | −2.0 | −1.3 | −5.4 | 83.9 | −15.3 |
| Reclassification from loans to other equity | −1.6 | −1.9 | −1.7 | −2.1 | −2.0 | −2.0 | −2.1 | −1.7 | −1.5 | −1.3 | −1.3 |
| Newly available and revised source data | 0.0 | 0.0 | 0.0 | 0.1 | 0.1 | 0.1 | 0.1 | 0.4 | −3.9 | 85.2 | −14.0 |
| Net U.S. incurrence of liabilities excluding financial derivatives (line 91): | |||||||||||
| Revised | 325.6 | 1391.0 | 983.5 | 632.0 | 1052.1 | 1109.4 | 503.5 | 706.7 | 1546.3 | 758.3 | 798.0 |
| Previously published | 325.6 | 1391.0 | 983.5 | 632.0 | 1052.1 | 1109.4 | 501.1 | 742.9 | 1549.0 | 735.6 | 784.4 |
| Amount of revision | 0.0 | 0.0 | 0.0 | 0.0 | 0.0 | 0.0 | 2.3 | −36.2 | −2.7 | 22.7 | 13.5 |
| Direct investment liabilities (line 92): | |||||||||||
| Revised | 161.1 | 264.0 | 263.5 | 250.3 | 288.1 | 251.9 | 511.4 | 474.4 | 367.0 | 261.5 | 351.6 |
| Previously published | 161.1 | 264.0 | 263.5 | 250.3 | 288.1 | 251.9 | 509.1 | 494.4 | 354.7 | 258.4 | 310.8 |
| Amount of revision | 0.0 | 0.0 | 0.0 | 0.0 | 0.0 | 0.0 | 2.3 | −20.1 | 12.3 | 3.1 | 40.8 |
| Portfolio investment liabilities (line 95): | |||||||||||
| Revised | 357.4 | 820.4 | 311.6 | 747.0 | 512.0 | 697.6 | 213.9 | 231.3 | 790.8 | 303.1 | 180.0 |
| Previously published | 357.4 | 820.4 | 311.6 | 747.0 | 512.0 | 697.6 | 213.9 | 231.3 | 792.5 | 315.7 | 231.6 |
| Amount of revision | 0.0 | 0.0 | 0.0 | 0.0 | 0.0 | 0.0 | 0.0 | −0.1 | −1.7 | −12.6 | −51.6 |
| Equity and investment fund shares (line 96): | |||||||||||
| Revised | 219.3 | 179.0 | 123.4 | 239.1 | −62.6 | 154.3 | −187.3 | −139.7 | 149.6 | 156.9 | −244.1 |
| Previously published | 219.3 | 179.0 | 123.4 | 239.1 | −62.6 | 154.3 | −187.3 | −139.7 | 149.6 | 142.4 | −226.8 |
| Amount of revision | 0.0 | 0.0 | 0.0 | 0.0 | 0.0 | 0.0 | 0.0 | 0.0 | 0.0 | 14.5 | −17.3 |
| Debt securities (line 97): | |||||||||||
| Revised | 138.1 | 641.5 | 188.3 | 508.0 | 574.6 | 543.3 | 401.2 | 371.0 | 641.2 | 146.2 | 424.0 |
| Previously published | 138.1 | 641.5 | 188.3 | 508.0 | 574.6 | 543.3 | 401.2 | 371.0 | 642.9 | 173.3 | 458.4 |
| Amount of revision | 0.0 | 0.0 | 0.0 | 0.0 | 0.0 | 0.0 | 0.0 | −0.1 | −1.7 | −27.1 | −34.4 |
| Other investment liabilities (line 100): | |||||||||||
| Revised | −192.8 | 306.6 | 408.4 | −365.3 | 251.9 | 160.0 | −221.9 | 1.0 | 388.5 | 193.7 | 266.4 |
| Previously published | −192.8 | 306.6 | 408.4 | −365.3 | 251.9 | 160.0 | −221.9 | 17.1 | 401.9 | 161.5 | 242.0 |
| Amount of revision | 0.0 | 0.0 | 0.0 | 0.0 | 0.0 | 0.0 | 0.0 | −16.1 | −13.4 | 32.2 | 24.3 |
| Currency and deposits (line 102): | |||||||||||
| Revised | −74.2 | 115.7 | 475.7 | −246.0 | 202.8 | 61.1 | 35.1 | −5.4 | 217.7 | 12.8 | 204.1 |
| Previously published | −74.2 | 115.7 | 475.7 | −246.0 | 202.8 | 61.1 | 35.1 | 18.7 | 217.8 | 32.3 | 196.4 |
| Amount of revision | 0.0 | 0.0 | 0.0 | 0.0 | 0.0 | 0.0 | 0.0 | −24.1 | −0.1 | −19.5 | 7.7 |
| Loans (line 103): | |||||||||||
| Revised | −172.5 | 172.3 | −84.8 | −130.3 | 41.3 | 87.9 | −265.0 | 0.5 | 156.4 | 165.0 | 52.4 |
| Previously published | −172.5 | 172.3 | −84.8 | −130.3 | 41.3 | 87.9 | −265.0 | −7.6 | 168.9 | 114.1 | 35.7 |
| Amount of revision | 0.0 | 0.0 | 0.0 | 0.0 | 0.0 | 0.0 | 0.0 | 8.1 | −12.5 | 50.9 | 16.7 |
| Financial derivatives other than reserves, net transactions (line 107): | |||||||||||
| Revised | −44.8 | −14.1 | −35.0 | 7.1 | 2.2 | −54.3 | −27.0 | 7.8 | 24.0 | −20.4 | −38.3 |
| Previously published | −44.8 | −14.1 | −35.0 | 7.1 | 2.2 | −54.3 | −27.0 | 7.8 | 24.0 | −20.7 | −38.4 |
| Amount of revision | 0.0 | 0.0 | 0.0 | 0.0 | 0.0 | 0.0 | 0.0 | 0.0 | 0.0 | 0.3 | (*) |
| Net lending (+) or net borrowing (−) from financial-account transactions (line 117): | |||||||||||
| Revised | −239.4 | −446.4 | −526.0 | −448.0 | −400.1 | −297.1 | −333.1 | −363.6 | −334.1 | −419.7 | −395.5 |
| Previously published | −239.4 | −446.4 | −526.0 | −448.2 | −400.3 | −297.3 | −325.9 | −382.0 | −357.6 | −445.5 | −395.9 |
| Amount of revision | (*) | (*) | (*) | 0.2 | 0.2 | 0.2 | −7.2 | 18.4 | 23.5 | 25.8 | 0.4 |
- (*)
- A nonzero value between −$50,000,000 and $50,000,000.
- .....
- Not applicable
Note. Line numbers refer to ITA table 1.2 on BEA's Web site.
Revisions to net borrowing reflect the combined revisions to net U.S. acquisition of financial assets excluding financial derivatives, to net U.S. incurrence of liabilities excluding financial derivatives, and to net transactions in financial derivatives. The revised annual financial transactions for each of these major accounts are similar in size and direction of change to the previously published financial transactions.
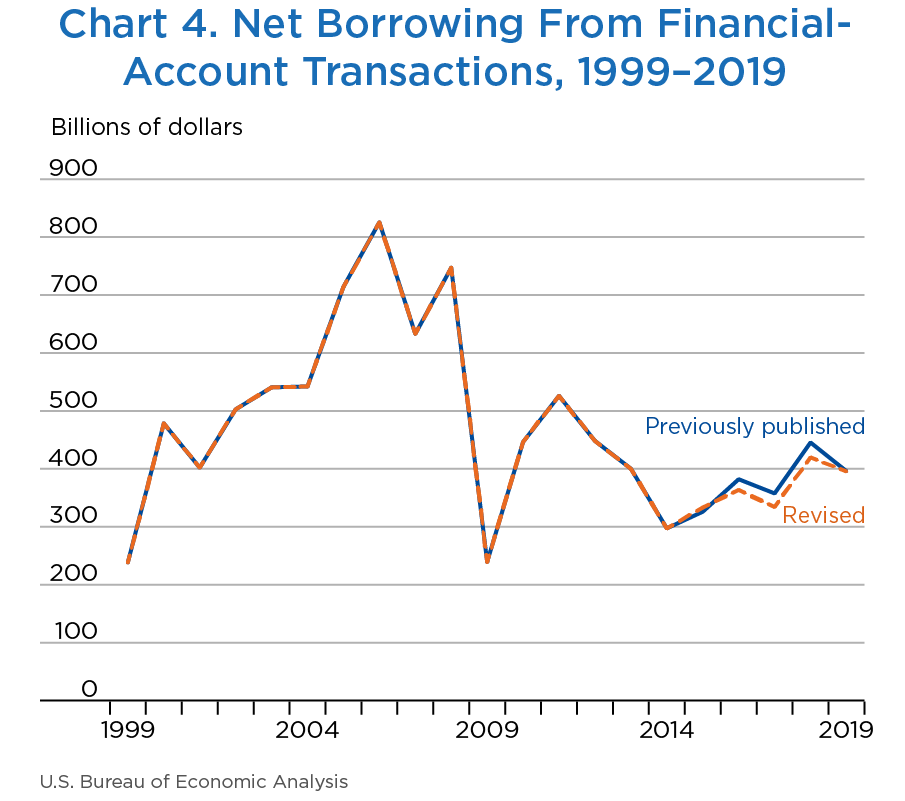
[Click chart to expand]
Net U.S. acquisition of financial assets excluding financial derivatives
Revisions to net U.S. transactions for financial assets excluding financial derivatives for 2001–2014 are small and reflect slight revisions to the net acquisition or liquidation of other investment assets. Net U.S. acquisition of financial assets was revised down for 2015 and 2016 and revised up for 2017–2019. The revisions for 2015–2019 mainly reflect (1) downward revisions to net acquisition of direct investment assets for 2015 and 2016, (2) an upward revision to net acquisition of direct investment assets for 2017, and (3) upward revisions to net acquisition of other investment and portfolio investment assets for 2019, which were partly offset by an upward revision to net liquidation of direct investment assets for 2018 and a downward revision to net acquisition of direct investment assets for 2019.
Direct investment assets. Net acquisition of direct investment assets was revised down for 2015–2016 and 2019, and up for 2017. Net withdrawal of direct investment assets was revised up for 2018. The revisions for 2016–2019 reflect newly available and revised source data from BEA quarterly and annual direct investment surveys. Revisions to 2015–2019 also reflect revised current-cost adjustments to direct investment income, which enter into net acquisition of direct investment assets as a component of reinvestment of earnings.
Portfolio investment assets. Net acquisition of portfolio investment assets (equity and debt securities) was revised down slightly for 2017 and revised up for 2018 and 2019. The largest revision was a $10.7 billion upward revision for 2019. The revisions reflect newly available and revised source data from the TIC surveys of U.S. holdings of foreign securities.24
Other investment assets. Net acquisition of other investment assets (other equity, currency and deposits, loans, insurance technical reserves, and trade credit and advances) was revised up for 2001–2007, 2010, and 2018–2019, and revised down for 2017. Net liquidation of other investment assets was revised down for 2008–2009 and 2011–2016. The largest revision was a $119.8 billion upward revision in net acquisition for 2018. Revisions for 2001–2015 reflect the incorporation of U.S. government transactions in other equity assets and loan assets that were not previously included in the ITAs. Revisions for 2016–2019 mainly reflect newly available and revised source data from the TIC surveys of U.S. claims on foreigners.
Net U.S. incurrence of liabilities excluding financial derivatives
Net U.S. incurrence of liabilities excluding financial derivatives was revised up for 2015, 2018, and 2019 and revised down for 2016 and 2017. The revisions mainly reflect (1) an upward revision to net incurrence of direct investment liabilities for 2015, (2) downward revisions to net incurrence of direct investment and other investment liabilities for 2016, (3) a downward revision to net incurrence of other investment liabilities for 2017, and (4) upward revisions to net incurrence of other investment and direct investment liabilities for 2018 and 2019, which were partly offset by downward revisions to net incurrence of portfolio investment liabilities.
Direct investment liabilities. Net incurrence of direct investment liabilities was revised up for 2015 and 2017–2019, and down for 2016. The largest revision was a $40.8 billion upward revision for 2019. The revisions mainly reflect newly available and revised source data from BEA’s quarterly and annual direct investment surveys. Revisions to 2015 reflect revised current-cost adjustments to direct investment income, which enter into net incurrence of direct investment liabilities as a component of reinvestment of earnings.
Portfolio investment liabilities. Net incurrence of portfolio investment liabilities was revised down for 2016–2019. The largest revisions were downward revisions of $12.6 billion for 2018 and $51.6 billion for 2019. The revisions reflect newly available and revised source data from the TIC surveys of foreign holdings of U.S. securities.25
Other investment liabilities. Net incurrence of other investment liabilities was revised down for 2016 and 2017 and up for 2018 and 2019. The largest revisions were upward revisions of $32.2 billion for 2018 and $24.3 billion for 2019. The revisions reflect newly available and revised source data from the TIC surveys of U.S. liabilities to foreigners.26
Statistical discrepancy
The statistical discrepancy is the difference between net acquisition of assets and net incurrence of liabilities in the financial account (including financial derivatives) less the difference between total credits and total debits recorded in the current and capital accounts. In principle, the combined deficit (or surplus) on recorded transactions in the current and capital accounts should equal net borrowing (or net lending) measured by recorded transactions in the financial account. In practice, however, they differ because of incomplete source data, gaps in coverage, and timing differences.
Table E presents revisions to the statistical discrepancy for 1999–2019. The largest revision was for 2017; that year the discrepancy was revised from $63.1 billion to $18.8 billion.
| Balance on goods and services | Balance on primary income | Balance on secondary income | |||||||
|---|---|---|---|---|---|---|---|---|---|
| Previously published | Revised | Revision | Previously published | Revised | Revision | Previously published | Revised | Revision | |
| 1999 | −255,809 | −258,617 | −2,808 | 11,134 | 9,974 | −1,160 | −40,881 | −40,777 | 104 |
| 2000 | −369,686 | −372,517 | −2,831 | 18,069 | 14,632 | −3,437 | −49,003 | −46,863 | 2,140 |
| 2001 | −360,373 | −361,511 | −1,138 | 27,530 | 23,244 | −4,286 | −55,708 | −56,953 | −1,245 |
| 2002 | −420,666 | −418,955 | 1,711 | 22,665 | 17,506 | −5,159 | −54,507 | −52,949 | 1,558 |
| 2003 | −496,243 | −493,890 | 2,353 | 34,716 | 29,254 | −5,462 | −59,571 | −55,300 | 4,271 |
| 2004 | −610,838 | −609,883 | 955 | 53,906 | 46,583 | −7,323 | −75,614 | −71,634 | 3,980 |
| 2005 | −716,542 | −714,245 | 2,297 | 53,898 | 44,186 | −9,712 | −84,887 | −76,876 | 8,011 |
| 2006 | −763,533 | −761,716 | 1,817 | 26,902 | 15,974 | −10,928 | −71,149 | −69,088 | 2,061 |
| 2007 | −710,997 | −705,375 | 5,622 | 85,005 | 64,356 | −20,649 | −90,665 | −89,910 | 755 |
| 2008 | −712,350 | −708,726 | 3,624 | 129,649 | 112,019 | −17,630 | −102,312 | −96,192 | 6,120 |
| 2009 | −394,771 | −383,774 | 10,997 | 115,160 | 115,539 | 379 | −103,907 | −100,496 | 3,411 |
| 2010 | −503,087 | −495,225 | 7,862 | 168,221 | 169,911 | 1,690 | −104,261 | −98,834 | 5,427 |
| 2011 | −554,522 | −549,699 | 4,823 | 211,084 | 202,431 | −8,653 | −107,047 | −103,211 | 3,836 |
| 2012 | −525,906 | −537,408 | −11,502 | 207,475 | 197,925 | −9,550 | −96,900 | −90,134 | 6,766 |
| 2013 | −446,829 | −461,135 | −14,306 | 205,977 | 195,520 | −10,457 | −93,643 | −85,545 | 8,098 |
| 2014 | −484,144 | −489,584 | −5,440 | 218,391 | 200,303 | −18,088 | −94,006 | −83,978 | 10,028 |
| 2015 | −491,261 | −498,525 | −7,264 | 203,608 | 185,376 | −18,232 | −112,848 | −101,470 | 11,378 |
| 2016 | −481,169 | −502,982 | −21,813 | 198,654 | 197,021 | −1,633 | −124,022 | −110,716 | 13,306 |
| 2017 | −513,791 | −550,123 | −36,332 | 225,799 | 257,793 | 31,994 | −115,322 | −109,272 | 6,050 |
| 2018 | −579,937 | −627,679 | −47,742 | 253,985 | 251,174 | −2,811 | −117,284 | −120,931 | −3,647 |
| 2019 | −576,865 | −616,425 | −39,560 | 256,997 | 236,344 | −20,653 | −138,923 | −139,705 | −782 |
| Balance on current account | Balance on capital account | Net lending (+) or net borrowing (−) from financial-account transactions | |||||||
|---|---|---|---|---|---|---|---|---|---|
| Previously published | Revised | Revision | Previously published | Revised | Revision | Previously published | Revised | Revision | |
| 1999 | −288,365 | −286,612 | 1,753 | −4,176 | −6,428 | −2,252 | −238,603 | −238,603 | 0 |
| 2000 | −403,450 | −401,918 | 1,532 | −1 | −4,217 | −4,216 | −478,392 | −478,392 | 0 |
| 2001 | −389,689 | −394,082 | −4,393 | 13,198 | 12,170 | −1,028 | −402,037 | −402,032 | 5 |
| 2002 | −450,797 | −456,110 | −5,313 | −141 | −3,825 | −3,684 | −502,673 | −502,668 | 5 |
| 2003 | −518,744 | −522,289 | −3,545 | −1,821 | −8,499 | −6,678 | −540,586 | −540,556 | 30 |
| 2004 | −631,591 | −635,890 | −4,299 | 3,049 | −4,344 | −7,393 | −542,226 | −542,220 | 6 |
| 2005 | −745,234 | −749,232 | −3,998 | 13,116 | 950 | −12,166 | −714,073 | −714,059 | 14 |
| 2006 | −805,964 | −816,646 | −10,682 | −1,788 | −7,439 | −5,651 | −825,583 | −825,567 | 16 |
| 2007 | −711,035 | −736,550 | −25,515 | 384 | −6,057 | −6,441 | −632,850 | −632,841 | 9 |
| 2008 | −681,389 | −696,523 | −15,134 | 6,010 | −172 | −6,182 | −747,069 | −747,053 | 16 |
| 2009 | −372,521 | −379,729 | −7,208 | −140 | −5,877 | −5,737 | −239,386 | −239,379 | 7 |
| 2010 | −431,265 | −432,009 | −744 | −157 | −6,891 | −6,734 | −446,415 | −446,381 | 34 |
| 2011 | −445,662 | −455,302 | −9,640 | −1,186 | −9,020 | −7,834 | −525,998 | −525,972 | 26 |
| 2012 | −426,832 | −418,115 | 8,717 | 6,904 | 931 | −5,973 | −448,205 | −448,032 | 173 |
| 2013 | −348,801 | −336,854 | 11,947 | −412 | −6,559 | −6,147 | −400,259 | −400,093 | 166 |
| 2014 | −365,199 | −367,819 | −2,620 | −45 | −6,535 | −6,490 | −297,255 | −297,076 | 179 |
| 2015 | −407,764 | −407,355 | 409 | −42 | −7,940 | −7,898 | −325,948 | −333,144 | −7,196 |
| 2016 | −428,349 | −394,865 | 33,484 | −152 | −6,606 | −6,454 | −382,042 | −363,633 | 18,409 |
| 2017 | −439,646 | −365,269 | 74,377 | 18,950 | 12,394 | −6,556 | −357,579 | −334,095 | 23,484 |
| 2018 | −490,978 | −449,693 | 41,285 | 3,235 | −4,196 | −7,431 | −445,477 | −419,724 | 25,753 |
| 2019 | −498,351 | −480,226 | 18,125 | −10 | −6,244 | −6,234 | −395,906 | −395,549 | 357 |
- (*)
- Between zero and +/− 500,000
| Balance on goods and services | Balance on primary income | Balance on secondary income | |||||||
|---|---|---|---|---|---|---|---|---|---|
| Previously published | Revised | Revision | Previously published | Revised | Revision | Previously published | Revised | Revision | |
| 1999: Q1 | −52,063 | −52,634 | −571 | 1,770 | 1,374 | −396 | −9,977 | −10,149 | −172 |
| Q2 | −60,884 | −61,598 | −714 | 2,891 | 2,577 | −314 | −9,378 | −9,650 | −272 |
| Q3 | −68,425 | −69,298 | −873 | 2,051 | 1,903 | −148 | −9,642 | −9,607 | 35 |
| Q4 | −74,437 | −75,090 | −653 | 4,427 | 4,123 | −304 | −11,884 | −11,371 | 513 |
| 2000: Q1 | −87,483 | −88,171 | −688 | 3,355 | 2,647 | −708 | −10,124 | −9,936 | 188 |
| Q2 | −88,167 | −89,579 | −1,412 | 3,904 | 3,073 | −831 | −11,192 | −11,297 | −105 |
| Q3 | −94,515 | −95,480 | −965 | 2,467 | 1,548 | −919 | −11,920 | −11,506 | 414 |
| Q4 | −99,521 | −99,287 | 234 | 8,345 | 7,365 | −980 | −15,769 | −14,124 | 1,645 |
| 2001: Q1 | −97,314 | −96,898 | 416 | 4,423 | 3,469 | −954 | −12,809 | −13,291 | −482 |
| Q2 | −86,767 | −87,800 | −1,033 | 6,408 | 5,370 | −1,038 | −13,300 | −13,854 | −554 |
| Q3 | −88,213 | −89,394 | −1,181 | 490 | −620 | −1,110 | −14,308 | −14,601 | −293 |
| Q4 | −88,079 | −87,415 | 664 | 16,207 | 15,023 | −1,184 | −15,292 | −15,206 | 86 |
| 2002: Q1 | −93,340 | −92,466 | 874 | 6,553 | 5,413 | −1,140 | −16,237 | −14,681 | 1,556 |
| Q2 | −102,723 | −102,488 | 235 | 1,867 | 689 | −1,178 | −12,436 | −12,635 | −199 |
| Q3 | −106,386 | −105,913 | 473 | 5,210 | 3,776 | −1,434 | −12,189 | −12,244 | −55 |
| Q4 | −118,217 | −118,090 | 127 | 9,040 | 7,632 | −1,408 | −13,643 | −13,390 | 253 |
| 2003: Q1 | −125,044 | −123,459 | 1,585 | 5,032 | 3,672 | −1,360 | −15,490 | −13,990 | 1,500 |
| Q2 | −122,778 | −122,384 | 394 | 7,990 | 6,809 | −1,181 | −14,264 | −13,367 | 897 |
| Q3 | −123,055 | −122,872 | 183 | 7,647 | 6,282 | −1,365 | −14,635 | −13,332 | 1,303 |
| Q4 | −125,366 | −125,175 | 191 | 14,041 | 12,487 | −1,554 | −15,182 | −14,611 | 571 |
| 2004: Q1 | −135,951 | −135,158 | 793 | 18,608 | 17,043 | −1,565 | −20,512 | −18,080 | 2,432 |
| Q2 | −149,005 | −150,348 | −1,343 | 12,249 | 10,687 | −1,562 | −18,140 | −17,791 | 349 |
| Q3 | −156,939 | −156,097 | 842 | 14,822 | 12,844 | −1,978 | −17,744 | −17,407 | 337 |
| Q4 | −168,943 | −168,281 | 662 | 8,227 | 6,008 | −2,219 | −19,218 | −18,355 | 863 |
| 2005: Q1 | −167,417 | −165,634 | 1,783 | 16,397 | 14,130 | −2,267 | −20,271 | −17,536 | 2,735 |
| Q2 | −171,504 | −171,639 | −135 | 13,351 | 10,925 | −2,426 | −21,066 | −20,064 | 1,002 |
| Q3 | −181,928 | −181,376 | 552 | 15,796 | 13,092 | −2,704 | −20,830 | −19,357 | 1,473 |
| Q4 | −195,693 | −195,596 | 97 | 8,353 | 6,039 | −2,314 | −22,719 | −19,919 | 2,800 |
| 2006: Q1 | −191,672 | −192,106 | −434 | 8,833 | 6,330 | −2,503 | −14,930 | −14,164 | 766 |
| Q2 | −191,220 | −191,169 | 51 | 7,436 | 4,757 | −2,679 | −18,614 | −18,489 | 125 |
| Q3 | −200,281 | −199,284 | 997 | 4,012 | 1,499 | −2,513 | −20,498 | −19,660 | 838 |
| Q4 | −180,360 | −179,157 | 1,203 | 6,621 | 3,389 | −3,232 | −17,107 | −16,775 | 332 |
| 2007: Q1 | −178,676 | −177,931 | 745 | 7,140 | 3,040 | −4,100 | −27,051 | −24,680 | 2,371 |
| Q2 | −180,063 | −179,322 | 741 | 12,566 | 7,531 | −5,035 | −20,589 | −20,802 | −213 |
| Q3 | −175,619 | −174,713 | 906 | 26,959 | 21,545 | −5,414 | −20,968 | −21,683 | −715 |
| Q4 | −176,639 | −173,409 | 3,230 | 38,340 | 32,240 | −6,100 | −22,059 | −22,745 | −686 |
| 2008: Q1 | −185,764 | −185,551 | 213 | 34,253 | 29,580 | −4,673 | −29,524 | −26,100 | 3,424 |
| Q2 | −186,932 | −186,349 | 583 | 35,327 | 31,129 | −4,198 | −24,901 | −24,013 | 888 |
| Q3 | −189,676 | −189,449 | 227 | 39,923 | 35,821 | −4,102 | −25,116 | −24,338 | 778 |
| Q4 | −149,978 | −147,376 | 2,602 | 20,147 | 15,490 | −4,657 | −22,772 | −21,741 | 1,031 |
| 2009: Q1 | −98,313 | −94,771 | 3,542 | 22,655 | 21,620 | −1,035 | −23,553 | −22,709 | 844 |
| Q2 | −83,464 | −81,444 | 2,020 | 22,252 | 22,056 | −196 | −27,145 | −25,681 | 1,464 |
| Q3 | −100,228 | −98,547 | 1,681 | 36,093 | 36,888 | 795 | −28,559 | −28,044 | 515 |
| Q4 | −112,766 | −109,012 | 3,754 | 34,160 | 34,975 | 815 | −24,652 | −24,063 | 589 |
| 2010: Q1 | −119,519 | −118,266 | 1,253 | 41,658 | 42,194 | 536 | −29,032 | −25,708 | 3,324 |
| Q2 | −130,900 | −128,809 | 2,091 | 41,903 | 42,778 | 875 | −24,438 | −23,613 | 825 |
| Q3 | −131,561 | −129,557 | 2,004 | 40,366 | 40,570 | 204 | −26,108 | −25,627 | 481 |
| Q4 | −121,106 | −118,594 | 2,512 | 44,294 | 44,370 | 76 | −24,683 | −23,885 | 798 |
| 2011: Q1 | −137,189 | −135,041 | 2,148 | 47,701 | 46,789 | −912 | −28,506 | −28,836 | −330 |
| Q2 | −140,291 | −138,842 | 1,449 | 48,662 | 46,718 | −1,944 | −27,090 | −25,862 | 1,228 |
| Q3 | −134,599 | −134,670 | −71 | 55,165 | 52,596 | −2,569 | −25,287 | −24,857 | 430 |
| Q4 | −142,443 | −141,146 | 1,297 | 59,555 | 56,329 | −3,226 | −26,165 | −23,656 | 2,509 |
| 2012: Q1 | −142,655 | −144,840 | −2,185 | 55,965 | 52,811 | −3,154 | −26,615 | −24,052 | 2,563 |
| Q2 | −134,888 | −136,728 | −1,840 | 50,835 | 48,329 | −2,506 | −25,686 | −23,428 | 2,258 |
| Q3 | −125,229 | −127,977 | −2,748 | 50,908 | 48,631 | −2,277 | −23,592 | −22,252 | 1,340 |
| Q4 | −123,134 | −127,863 | −4,729 | 49,768 | 48,153 | −1,615 | −21,007 | −20,402 | 605 |
| 2013: Q1 | −115,417 | −119,068 | −3,651 | 47,204 | 45,308 | −1,896 | −22,441 | −20,183 | 2,258 |
| Q2 | −114,590 | −117,165 | −2,575 | 50,805 | 48,579 | −2,226 | −24,432 | −22,482 | 1,950 |
| Q3 | −112,888 | −117,425 | −4,537 | 54,259 | 51,420 | −2,839 | −24,950 | −23,223 | 1,727 |
| Q4 | −103,934 | −107,478 | −3,544 | 53,709 | 50,213 | −3,496 | −21,821 | −19,657 | 2,164 |
| 2014: Q1 | −120,543 | −120,547 | −4 | 54,918 | 50,664 | −4,254 | −22,944 | −20,340 | 2,604 |
| Q2 | −122,263 | −124,597 | −2,334 | 53,143 | 48,387 | −4,756 | −14,453 | −12,675 | 1,778 |
| Q3 | −117,593 | −120,226 | −2,633 | 59,169 | 54,283 | −4,886 | −27,536 | −25,361 | 2,175 |
| Q4 | −123,745 | −124,213 | −468 | 51,161 | 46,969 | −4,192 | −29,072 | −25,602 | 3,470 |
| 2015: Q1 | −121,445 | −125,743 | −4,298 | 51,882 | 46,974 | −4,908 | −28,280 | −24,574 | 3,706 |
| Q2 | −120,906 | −122,091 | −1,185 | 48,740 | 44,290 | −4,450 | −24,694 | −22,702 | 1,992 |
| Q3 | −126,322 | −127,450 | −1,128 | 49,335 | 44,606 | −4,729 | −31,073 | −27,922 | 3,151 |
| Q4 | −122,588 | −123,241 | −653 | 53,651 | 49,505 | −4,146 | −28,800 | −26,271 | 2,529 |
| 2016: Q1 | −119,793 | −125,634 | −5,841 | 45,374 | 44,770 | −604 | −32,175 | −28,227 | 3,948 |
| Q2 | −118,566 | −123,150 | −4,584 | 48,496 | 45,803 | −2,693 | −28,662 | −26,216 | 2,446 |
| Q3 | −117,645 | −122,090 | −4,445 | 46,367 | 46,817 | 450 | −31,069 | −28,103 | 2,966 |
| Q4 | −125,166 | −132,108 | −6,942 | 58,418 | 59,631 | 1,213 | −32,116 | −28,170 | 3,946 |
| 2017: Q1 | −123,326 | −134,050 | −10,724 | 53,609 | 60,469 | 6,860 | −23,854 | −21,036 | 2,818 |
| Q2 | −129,618 | −139,677 | −10,059 | 49,606 | 58,241 | 8,635 | −32,804 | −30,983 | 1,821 |
| Q3 | −125,535 | −131,422 | −5,887 | 59,693 | 66,734 | 7,041 | −27,979 | −27,433 | 546 |
| Q4 | −135,311 | −144,974 | −9,663 | 62,890 | 72,349 | 9,459 | −30,686 | −29,820 | 866 |
| 2018: Q1 | −138,855 | −153,108 | −14,253 | 66,372 | 70,187 | 3,815 | −27,264 | −27,918 | −654 |
| Q2 | −130,230 | −140,001 | −9,771 | 62,829 | 64,494 | 1,665 | −30,139 | −29,678 | 461 |
| Q3 | −152,406 | −163,424 | −11,018 | 64,724 | 56,638 | −8,086 | −27,039 | −29,473 | −2,434 |
| Q4 | −158,445 | −171,146 | −12,701 | 60,059 | 59,855 | −204 | −32,841 | −33,861 | −1,020 |
| 2019: Q1 | −145,237 | −157,758 | −12,521 | 57,039 | 53,298 | −3,741 | −36,180 | −34,677 | 1,503 |
| Q2 | −152,210 | −160,390 | −8,180 | 66,769 | 59,467 | −7,302 | −32,632 | −34,948 | −2,316 |
| Q3 | −149,658 | −158,423 | −8,765 | 65,905 | 61,621 | −4,284 | −32,860 | −33,556 | −696 |
| Q4 | −129,759 | −139,854 | −10,095 | 67,283 | 61,958 | −5,325 | −37,251 | −36,524 | 727 |
| Balance on current account | Balance on capital account | Net lending (+) or net borrowing (−) from financial-account transactions | |||||||
|---|---|---|---|---|---|---|---|---|---|
| Previously published | Revised | Revision | Previously published | Revised | Revision | Previously published | Revised | Revision | |
| 1999: Q1 | −60,841 | −60,838 | 3 | −7 | −278 | −271 | −23,694 | −23,694 | 0 |
| Q2 | −68,085 | −67,957 | 128 | −1 | −358 | −357 | −64,885 | −64,885 | 0 |
| Q3 | −76,889 | −76,129 | 760 | −3 | −337 | −334 | −32,734 | −32,734 | 0 |
| Q4 | −82,546 | −81,685 | 861 | −4,165 | −5,455 | −1,290 | −117,290 | −117,290 | 0 |
| 2000: Q1 | −94,940 | −94,772 | 168 | (*) | −502 | −502 | −35,314 | −35,314 | 0 |
| Q2 | −96,866 | −96,392 | 474 | 2 | −355 | −357 | −139,423 | −139,423 | 0 |
| Q3 | −104,933 | −104,474 | 459 | −10 | −811 | −801 | −160,400 | −160,400 | 0 |
| Q4 | −106,712 | −106,279 | 433 | 6 | −2,550 | −2,556 | −143,256 | −143,256 | 0 |
| 2001: Q1 | −105,283 | −107,136 | −1,853 | (*) | −90 | −90 | −114,955 | −114,950 | 5 |
| Q2 | −94,693 | −95,251 | −558 | 4 | −126 | −130 | −120,619 | −120,619 | 0 |
| Q3 | −103,211 | −103,435 | −224 | 13,188 | 12,850 | −338 | −57,569 | −57,569 | 0 |
| Q4 | −86,499 | −88,263 | −1,764 | 6 | −465 | −471 | −108,896 | −108,896 | 0 |
| 2002: Q1 | −102,150 | −102,608 | −458 | 7 | −2,146 | −2,153 | −88,703 | −88,698 | 5 |
| Q2 | −113,057 | −114,669 | −1,612 | −2 | −346 | −344 | −91,961 | −91,961 | 0 |
| Q3 | −112,893 | −114,854 | −1,961 | −69 | −371 | −302 | −161,771 | −161,771 | 0 |
| Q4 | −122,694 | −123,975 | −1,281 | −77 | −962 | −885 | −160,233 | −160,233 | 0 |
| 2003: Q1 | −133,916 | −135,362 | −1,446 | −82 | −1,910 | −1,828 | −160,053 | −160,053 | 0 |
| Q2 | −128,659 | −129,336 | −677 | −1,252 | −2,891 | −1,639 | −62,159 | −62,144 | 15 |
| Q3 | −129,860 | −130,105 | −245 | −492 | −2,408 | −1,916 | −130,548 | −130,548 | 0 |
| Q4 | −126,316 | −127,490 | −1,174 | 5 | −1,290 | −1,295 | −187,831 | −187,816 | 15 |
| 2004: Q1 | −137,062 | −136,989 | 73 | −56 | −2,883 | −2,827 | −107,801 | −107,801 | 0 |
| Q2 | −156,240 | −156,109 | 131 | (*) | −1,118 | −1,118 | −163,502 | −163,502 | 0 |
| Q3 | −159,019 | −161,502 | −2,483 | 3,173 | 1,801 | −1,372 | −107,200 | −107,193 | 7 |
| Q4 | −179,272 | −181,291 | −2,019 | −68 | −2,143 | −2,075 | −163,723 | −163,723 | 0 |
| 2005: Q1 | −169,508 | −170,824 | −1,316 | −2,160 | −6,133 | −3,973 | −107,979 | −107,979 | 0 |
| Q2 | −179,354 | −180,642 | −1,288 | −83 | −1,931 | −1,848 | −85,705 | −85,692 | 13 |
| Q3 | −186,410 | −188,193 | −1,783 | 15,362 | 12,984 | −2,378 | −224,506 | −224,506 | 0 |
| Q4 | −209,961 | −209,573 | 388 | −3 | −3,970 | −3,967 | −295,883 | −295,883 | 0 |
| 2006: Q1 | −198,203 | −199,506 | −1,303 | −1,220 | −2,515 | −1,295 | −163,570 | −163,554 | 16 |
| Q2 | −202,347 | −204,953 | −2,606 | −487 | −1,845 | −1,358 | −201,915 | −201,915 | 0 |
| Q3 | −215,769 | −218,442 | −2,673 | −2 | −1,428 | −1,426 | −249,371 | −249,371 | 0 |
| Q4 | −189,644 | −193,746 | −4,102 | −79 | −1,651 | −1,572 | −210,726 | −210,726 | 0 |
| 2007: Q1 | −197,842 | −200,315 | −2,473 | 0 | −3,074 | −3,074 | −258,049 | −258,040 | 9 |
| Q2 | −187,344 | −193,334 | −5,990 | 443 | −327 | −770 | −156,983 | −156,983 | 0 |
| Q3 | −168,722 | −175,756 | −7,034 | −57 | −930 | −873 | −89,726 | −89,726 | 0 |
| Q4 | −157,128 | −167,144 | −10,016 | −2 | −1,726 | −1,724 | −128,093 | −128,093 | 0 |
| 2008: Q1 | −180,823 | −182,284 | −1,461 | −8 | −2,864 | −2,856 | −214,367 | −214,359 | 8 |
| Q2 | −175,923 | −179,816 | −3,893 | −18 | −896 | −878 | −160,172 | −160,164 | 8 |
| Q3 | −174,642 | −178,194 | −3,552 | 6,043 | 5,150 | −893 | −184,795 | −184,795 | 0 |
| Q4 | −150,002 | −156,229 | −6,227 | −7 | −1,562 | −1,555 | −187,735 | −187,735 | 0 |
| 2009: Q1 | −95,670 | −99,402 | −3,732 | −20 | −951 | −931 | −16,117 | −16,117 | 0 |
| Q2 | −86,336 | −87,089 | −753 | −29 | −2,311 | −2,282 | −20,061 | −20,054 | 7 |
| Q3 | −91,013 | −91,384 | −371 | −36 | −1,359 | −1,323 | −38,861 | −38,861 | 0 |
| Q4 | −99,503 | −101,854 | −2,351 | −56 | −1,255 | −1,199 | −164,347 | −164,347 | 0 |
| 2010: Q1 | −105,640 | −103,034 | 2,606 | −3 | −3,168 | −3,165 | −79,102 | −79,102 | 0 |
| Q2 | −111,344 | −111,736 | −392 | −2 | −1,076 | −1,074 | −34,663 | −34,656 | 7 |
| Q3 | −115,299 | −116,619 | −1,320 | −146 | −1,171 | −1,025 | −238,472 | −238,472 | 0 |
| Q4 | −98,983 | −100,621 | −1,638 | −7 | −1,476 | −1,469 | −94,177 | −94,151 | 26 |
| 2011: Q1 | −115,847 | −119,236 | −3,389 | −29 | −1,695 | −1,666 | −209,742 | −209,742 | 0 |
| Q2 | −117,269 | −119,435 | −2,166 | −854 | −4,093 | −3,239 | −138,259 | −138,259 | 0 |
| Q3 | −104,792 | −106,860 | −2,068 | −300 | −1,534 | −1,234 | −165,911 | −165,886 | 25 |
| Q4 | −107,755 | −109,771 | −2,016 | −3 | −1,699 | −1,696 | −12,085 | −12,085 | 0 |
| 2012: Q1 | −115,491 | −113,896 | 1,595 | −53 | −2,047 | −1,994 | −258,914 | −258,914 | 0 |
| Q2 | −111,579 | −109,987 | 1,592 | −241 | −1,794 | −1,553 | −53,226 | −53,109 | 117 |
| Q3 | −100,661 | −98,850 | 1,811 | −470 | −1,525 | −1,055 | −1,628 | −1,628 | 0 |
| Q4 | −99,102 | −95,382 | 3,720 | 7,668 | 6,297 | −1,371 | −134,437 | −134,382 | 55 |
| 2013: Q1 | −94,304 | −90,293 | 4,011 | −40 | −1,671 | −1,631 | −47,980 | −47,936 | 44 |
| Q2 | −90,791 | −88,493 | 2,298 | −227 | −1,882 | −1,655 | −36,060 | −35,979 | 81 |
| Q3 | −88,116 | −84,691 | 3,425 | −146 | −1,462 | −1,316 | −141,943 | −141,903 | 40 |
| Q4 | −75,590 | −73,377 | 2,213 | (*) | −1,544 | −1,544 | −174,276 | −174,276 | 0 |
| 2014: Q1 | −88,573 | −90,219 | −1,646 | −43 | −2,361 | −2,318 | −113,490 | −113,490 | 0 |
| Q2 | −85,907 | −86,551 | −644 | −2 | −1,298 | −1,296 | −82,758 | −82,615 | 143 |
| Q3 | −88,594 | −88,671 | −77 | −1 | −1,220 | −1,219 | −58,651 | −58,651 | 0 |
| Q4 | −102,125 | −102,378 | −253 | (*) | −1,655 | −1,655 | −42,355 | −42,320 | 35 |
| 2015: Q1 | −102,141 | −99,045 | 3,096 | −22 | −2,999 | −2,977 | −121,328 | −124,436 | −3,108 |
| Q2 | −98,045 | −99,318 | −1,273 | −20 | −1,266 | −1,246 | −134,301 | −137,039 | −2,738 |
| Q3 | −109,188 | −109,638 | −450 | −1 | −2,184 | −2,183 | −36,347 | −36,886 | −539 |
| Q4 | −98,390 | −99,354 | −964 | 0 | −1,490 | −1,490 | −33,972 | −34,782 | −810 |
| 2016: Q1 | −112,435 | −103,250 | 9,185 | −58 | −2,236 | −2,178 | −104,226 | −84,791 | 19,435 |
| Q2 | −103,316 | −98,979 | 4,337 | (*) | −1,078 | −1,078 | −17,016 | −4,856 | 12,160 |
| Q3 | −106,792 | −98,931 | 7,861 | −94 | −1,352 | −1,258 | −197,610 | −222,895 | −25,285 |
| Q4 | −105,806 | −93,705 | 12,101 | 0 | −1,940 | −1,940 | −63,190 | −51,090 | 12,100 |
| 2017: Q1 | −104,295 | −83,894 | 20,401 | −58 | −2,116 | −2,058 | −67,234 | −70,674 | −3,440 |
| Q2 | −122,874 | −102,359 | 20,515 | −96 | −1,999 | −1,903 | −151,704 | −115,623 | 36,081 |
| Q3 | −99,708 | −86,234 | 13,474 | 19,144 | 18,213 | −931 | −116,317 | −90,608 | 25,709 |
| Q4 | −112,769 | −92,782 | 19,987 | −40 | −1,703 | −1,663 | −22,324 | −57,190 | −34,866 |
| 2018: Q1 | −114,001 | −96,587 | 17,414 | −2 | −1,406 | −1,404 | −93,376 | −96,265 | −2,889 |
| Q2 | −107,311 | −95,414 | 11,897 | −5 | −2,912 | −2,907 | −133,098 | −103,970 | 29,128 |
| Q3 | −125,739 | −125,241 | 498 | 521 | −455 | −976 | −57,381 | −16,796 | 40,585 |
| Q4 | −143,927 | −132,452 | 11,475 | 2,721 | 576 | −2,145 | −161,621 | −202,693 | −41,072 |
| 2019: Q1 | −136,898 | −126,616 | 10,282 | 0 | −2,542 | −2,542 | −35,376 | −95,175 | −59,799 |
| Q2 | −126,252 | −127,691 | −1,439 | 0 | −848 | −848 | −212,323 | −167,903 | 44,420 |
| Q3 | −125,378 | −121,594 | 3,784 | −10 | −835 | −825 | −76,417 | −103,125 | −26,708 |
| Q4 | −109,822 | −104,324 | 5,498 | 0 | −2,019 | −2,019 | −71,790 | −29,345 | 42,445 |
- (*)
- Between zero and +/− 500,000
- This article focuses primarily on the update to the ITAs. See Elena L. Nguyen and Erin M. Whitaker, “U.S. Net International Investment Position: First Quarter 2020, Year 2019, and Annual Update” in this issue of the Survey of Current Business for details on the annual update of the IIP accounts. Several of the updates to the ITAs also affect the detailed annual trade in services statistics. Further details on updates to the most detailed annual trade in services statistics will be included in an October Survey article.
- Presentational changes that affect all of the accounts are discussed in the box “Other Changes in Presentation.”
- For a comparison of these revisions with past annual revisions, see the box “2020 Annual Update in Historical Context”.
- For information on improvements introduced during the first two phases of the trade in services initiative, see Elye Bliss “Preview of the 2020 Annual Update of the International Economic Accounts” Survey of Current Business 100 (April 2020).
- BEA indistinguishably includes a partial measure of trade in manufacturing services under technical, trade-related, and other business services in the other business services major category. BEA will replace the “n.a.” in this new major category with values when it is able to produce a more reliable and comprehensive estimate of manufacturing services on inputs owned by others. At the same time, BEA will adjust its trade in goods measures to remove goods sent or received from abroad for processing without a change in ownership (and the return of the resulting processed goods). At present, these goods are not separately identifiable in U.S. customs data, meaning all exports from and imports into the United States appear as if there is a change in economic ownership when the goods cross the U.S. border. In the absence of a direct means to measure the value of goods crossing the U.S. border without a change in economic ownership, BEA is researching methods to estimate their value indirectly and remove them from the goods trade statistics so that these types of global manufacturing arrangements are reflected, in accordance with international guidelines, as only involving services trade.
- The construction subcategory was shown in international services table 2.1, but it was not shown separately in ITA table 3.1. In ITA table 3.1, it was included in technical, trade-related, and other business services.
- Transactions related to intellectual property that fall outside the types presented in chart 1 continue to be classified in charges for the use of intellectual property, regardless of the rights conveyed with the transaction.
- These changes were made to align with international guidelines, which, for architectural, engineering, or mining services, do not prescribe the removal of goods exports related to these services from the statistics and which do not prescribe the reporting of foreign expenses. For construction services, however, related goods exports continue to be removed and foreign expenses continue to be included in construction imports.
- The 52 newly added countries and areas include Austria, Bulgaria, Croatia, Cyprus, Czech Republic, Denmark, Estonia, Finland, Greece, Hungary, Ireland, Latvia, Lithuania, Malta, Norway, Poland, Portugal, Romania, Russia, Slovakia, Slovenia, Spain, Sweden, Switzerland, Turkey, Chile, Colombia, Costa Rica, El Salvador, Guatemala, Honduras, Nicaragua, Panama, Peru, Bermuda, Dominican Republic, United Kingdom Islands, Caribbean, Morocco, Nigeria, Bahrain, Israel, Jordan, Oman, Saudi Arabia, Brunei, Indonesia, Malaysia, New Zealand, Philippines, Thailand, Vietnam, and CAFTA-DR (Dominican Republic-Central America FTA) countries.
- The most recent report was in Shari A. Allen, Thomas Anderson, Alexis N. Grimm, and Michael Mann “U.S. International Services: Trade in Services in 2018 and Services Through Affiliates in 2017,” Survey of Current Business 99 (October 2019).
- Recent consultation with responding airline operators suggested that the survey data did not entirely align with the interline settlements they were intended to capture.
- Port services include cargo handling, storage, warehousing, and other related transport services.
- Statistics for Canada and Mexico are based on data provided to BEA by Statistics Canada and the Bank of Mexico. Statistics for travel by cruise are based on data from DHS and several private sources.
- Baseline estimates of average expenditures using data from the SIAT are adjusted to account for particular limitations often faced by expenditure surveys, including underreported spending.
- For more information on the 2014 comprehensive restructuring, see Jeffrey R. Bogen, Mai-Chi Hoang, Kristy L. Howell, and Erin M. Whitaker, “Comprehensive Restructuring and Annual Revision of the U.S. International Transactions Accounts,” Survey 94 (July 2014).
- For instance, the emergency room expenses of a traveler whose primary purpose for travel is hiking are not included in health-related travel; these expenses are recorded in other personal travel.
- As with average expenditures for the subaggregate, average health-related travel expenditures are adjusted to account for underreporting and other survey limitations.
- The July 30, 2020 annual update of the NIPAs will incorporate the ITA FISIM estimate for data beginning in 2015. The ITA FISIM estimate will be incorporated for earlier years in a future annual update. For more information, refer to the box “ Preview of the 2020 NIPA Annual Update” in the May 2020 SCB article “GDP and the Economy Advance Estimates for the First Quarter of 2020”.
- See Jeffrey R. Bogen and Jessica M. Hanson, “Annual Revision of the U.S. International Transactions Accounts” Survey 94 (July 2012) and Christopher L. Bach, “Annual Revision of the U.S. International Accounts, 1991–2004” Survey 85 (July 2005): 64–66.
- The future goods and services involved in the entitlement are to be interpreted broadly and may include services provided to an employer by an employee.
- This change also impacts the IIP accounts; loan asset positions are reclassified as other equity positions beginning with statistics for 1976.
- The current-cost adjustment to direct investment income substitutes economic depreciation charges for the financial-accounting-based depreciation and depletion charges against equity income that are reported on BEA surveys of direct investment. These adjustments put depreciation on a replacement-cost basis and more closely align parents’ claims on affiliates’ income with charges against income in the same period, as required by economic accounting principles.
- Insurance-related transfers are derived from insurance premiums and losses collected on BEA’s survey.
- Revised data from the following TIC surveys were incorporated: (1) Aggregate Holdings of Long-Term Securities by U.S. and Foreign Residents (foreign securities), (2) Report of U.S. Ownership of Foreign Securities, Including Selected Money Market Instruments, and (3) Reports by Financial Institutions of Liabilities to, and Claims on, Foreign Residents by U.S. Residents (claims).
- Revised data from the following TIC surveys were incorporated: (1) Aggregate Holdings of Long-Term Securities by U.S. and Foreign Residents (U.S. securities), (2) Foreign-residents’ Holdings of U.S. Securities, including Selected Money Market Instruments, and (3) Reports by Financial Institutions of Liabilities to, and Claims on, Foreign Residents by U.S. Residents (liabilities).
- Revised data from the following TIC surveys were incorporated: (1) Reports by Financial Institutions of Liabilities to, and Claims on, Foreign Residents by U.S. Residents (liabilities) and (2) Reports of Liabilities to, and Claims on, Unaffiliated Foreign Residents by U.S. Resident Nonfinancial Institutions (liabilities).