Government Receipts and Expenditures
Second Quarter 2020
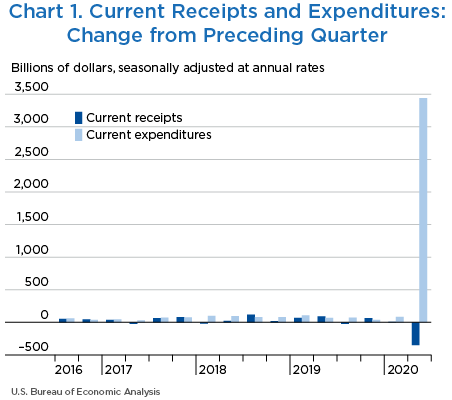
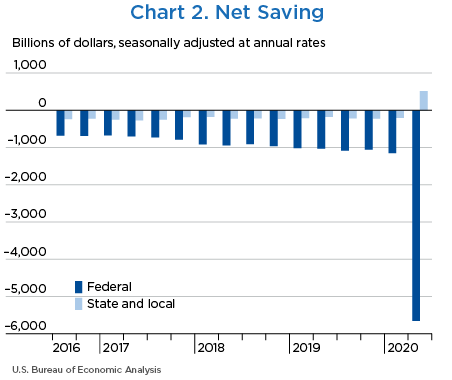
Net government saving, the difference between current receipts and current expenditures in the federal government and state and local governments, was −$5,142.6 billion in the second quarter of 2020, decreasing $3,789.1 billion from −$1,353.5 billion in the first quarter of 2020 (charts 1 and 2 and table 1).
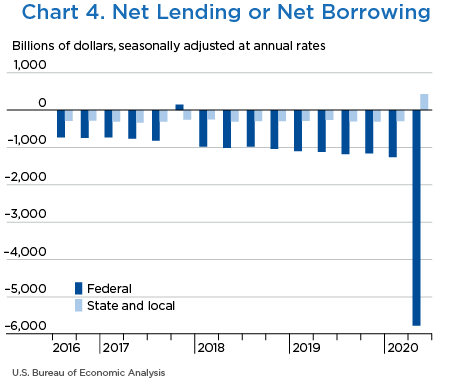
“Net lending or net borrowing (−)” is an alternative measure of the government fiscal position. Net borrowing is the financing requirement of the government sector, and it is derived as net government saving plus the consumption of fixed capital and net capital transfers received less gross investment and net purchases of nonproduced assets.
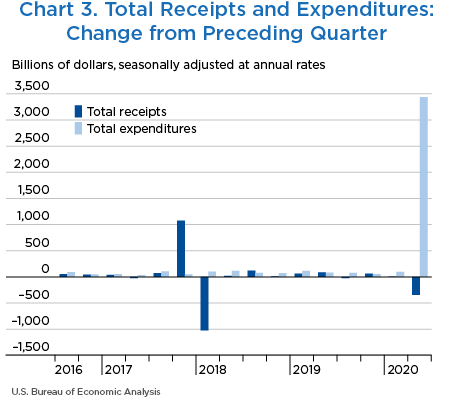
Net borrowing was $5,337.8 billion in the second quarter, increasing $3,781.0 billion from $1,556.8 billion in the second quarter (charts 3 and 4 and table 1).
| Line | Level | Change from preceding quarter | ||||
|---|---|---|---|---|---|---|
| 2020 | 2019 | 2019 | 2020 | 2020 | ||
| II | III | IV | I | II | ||
| 1 | Current receipts | 5,560.8 | −23.3 | 63.2 | 6.0 | −349.4 |
| 2 | Current expenditures | 10,703.4 | 72.4 | 36.6 | 82.2 | 3,439.7 |
| 3 | Net government saving | −5,142.6 | −95.7 | 26.6 | −76.2 | −3,789.1 |
| 4 | Federal | −5,659.1 | −51.1 | 29.2 | −95.9 | −4,508.3 |
| 5 | State and local | 516.5 | −44.6 | −2.6 | 19.7 | 719.2 |
| 6 | Net lending or net borrowing (−) | −5,337.8 | −98.7 | 9.5 | −90.7 | −3,781.0 |
| 7 | Federal | −5,764.4 | −60.2 | 15.3 | −99.5 | −4,504.4 |
| 8 | State and local | 426.7 | −38.7 | −5.7 | 8.7 | 723.6 |
Net federal government saving was −$5,659.1 billion in the second quarter, decreasing $4,508.3 billion from −$1,150.8 billion in the first quarter (table 2). In the second quarter, current receipts continued to decrease and current expenditures accelerated.
Federal government net borrowing was $5,764.4 billion in the second quarter, increasing $4,504.4 billion from $1,260.0 billion in the first quarter.
- Personal current taxes (line 3) turned down in the second quarter, reflecting a downturn in withheld taxes and nonwithheld taxes. The downturn in withheld taxes reflects the pattern of wages. The downturn in nonwithheld taxes reflects a downturn in the pattern of nonwage income.
- Taxes on production and imports (line 4) turned down in the second quarter. Excise taxes turned down, reflecting a larger decrease in air transport excise taxes due to the suspension of certain aviation excise taxes by the Coronavirus Aid, Relief, and Economic Security (CARES) Act. Health excise taxes also decelerated following the reintroduction of annual fees on health insurance providers in the first quarter of 2020; these fees were temporarily suspended in 2019. Gasoline excise taxes, diesel fuel excise taxes, and tobacco excise taxes also continued to decrease. Additionally, customs duties continued to decrease in the second quarter, decreasing $22.4 billion after decreasing $3.0 billion in the first quarter, primarily reflecting a reduction in the volume of imports.
- Taxes on corporate income (line 5) decreased less in the second quarter, reflecting a smaller decrease in corporate profits.
- Contributions for government social insurance (line 7) turned down in the second quarter, reflecting the pattern of wages.
- Current transfer receipts (line 9) turned up in the second quarter, reflecting an upturn in fines paid by foreign businesses to the federal government. Transfers from persons decreased less in the second quarter. The larger decrease in the first quarter reflected the suspension of Affordable Care Act fines for tax year 2019.
- Nondefense consumption expenditures (line 14) accelerated in the second quarter, reflecting an upturn in nondefense services. Spending on services was boosted by fees paid to private lenders for administering Paycheck Protection Program loans that were authorized by the CARES Act.
- Government social benefits to persons (line 17) accelerated in the second quarter, reflecting the coronavirus economic impact payments authorized by the CARES Act. Additionally, unemployment benefits accelerated, reflecting expanded unemployment insurance benefits provided through three programs. The Federal Pandemic Unemployment Compensation program provides a temporary weekly supplemental payment of $600 to people receiving unemployment benefits. The Pandemic Unemployment Assistance program provides temporary unemployment benefits to people who are not usually eligible for unemployment insurance benefits. The Pandemic Emergency Unemployment Compensation program provides a temporary extension of unemployment benefits for 13 weeks to people who exhausted all available regular and extended unemployment benefits. Transfers to nonprofit institutions also accelerated, reflecting transfers from the Provider Relief Fund and the Paycheck Protection Program, both authorized by the CARES Act. The Provider Relief Fund provides funding to assist nonprofit hospitals in their response to the COVID-19 pandemic, of which the forgivable portion of these loans are treated as transfer payments. The Paycheck Protection Program provides loans to nonprofit institutions. Supplemental Nutrition Assistance Program benefits accelerated in the second quarter, reflecting an increase in emergency benefits as well as an increase in the number of people receiving benefits in response to the COVID-19 pandemic. Medicare also accelerated in the second quarter, reflecting a temporary 2 percent increase in reimbursements paid to Medicare service providers as a provision of the CARES Act.
- Grants-in-aid to state and local governments (line 20) accelerated in the second quarter, reflecting an increase in grants funding COVID-19 response efforts appropriated through the CARES Act. General economic and labor affairs grants accelerated, reflecting payments from the Coronavirus Relief Fund to cover expenditures incurred due to the public health emergency. Health grants accelerated, reflecting an increase in federal Medicaid matching funds to assist states with responding to the COVID-19 pandemic. Education grants also accelerated, reflecting funds provided to handle COVID-19 response activities at public schools and colleges.
- Interest payments (line 22) continued to decrease in the second quarter, reflecting a downturn in interest paid on public issues of debt resulting from lower interest rates in the second quarter.
- Subsidies (line 23) turned up in the second quarter, reflecting funds appropriated through the CARES Act, including Paycheck Protection Program loans to businesses, tax credits to fund paid sick leave, employee retention tax credits, grants to the airline industry, public health and social services emergency funding for private health care providers, and support for public transit agencies.
| Line | Level | Change from preceding quarter | ||||
|---|---|---|---|---|---|---|
| 2020 | 2019 | 2019 | 2020 | 2020 | ||
| II | III | IV | I | II | ||
| 1 | Current receipts | 3,468.3 | −2.1 | 61.3 | −10.6 | −284.8 |
| 2 | Current tax receipts | 1,930.8 | −5.7 | 59.4 | −27.1 | −219.2 |
| 3 | Personal current taxes | 1,599.7 | 10.1 | 27.0 | 16.4 | −156.9 |
| 4 | Taxes on production and imports | 131.1 | 6.7 | 4.2 | 4.6 | −52.7 |
| 5 | Taxes on corporate income | 173.4 | −22.6 | 28.1 | −49.2 | −7.1 |
| 6 | Taxes from the rest of the world | 26.7 | 0.1 | 0.0 | 1.2 | −2.4 |
| 7 | Contributions for government social insurance | 1,366.2 | 4.5 | 14.6 | 19.5 | −70.2 |
| 8 | Income receipts on assets | 113.7 | −20.6 | 9.6 | 1.6 | 0.9 |
| 9 | Current transfer receipts | 57.9 | 19.9 | −22.4 | −5.7 | 3.1 |
| 10 | Current surplus of government enterprises | −0.3 | −0.2 | 0.1 | 1.0 | 0.7 |
| 11 | Current expenditures | 9,127.4 | 48.9 | 32.2 | 85.3 | 4,223.5 |
| 12 | Consumption expenditures | 1,167.6 | 9.7 | 9.1 | 4.3 | 49.6 |
| 13 | National defense | 688.3 | 6.8 | 9.4 | 1.0 | −2.6 |
| 14 | Nondefense | 479.3 | 2.9 | −0.3 | 3.3 | 52.2 |
| 15 | Current transfer payments | 6,314.5 | 18.0 | 23.4 | 89.8 | 3,184.8 |
| 16 | Government social benefits | 4,869.5 | 16.1 | 16.4 | 75.3 | 2,422.1 |
| 17 | To persons | 4,836.1 | 15.6 | 16.3 | 74.8 | 2,413.6 |
| 18 | To the rest of the world | 33.4 | 0.5 | 0.1 | 0.5 | 8.5 |
| 19 | Other current transfer payments | 1,445.0 | 1.9 | 6.9 | 14.6 | 762.7 |
| 20 | Grants-in-aid to state and local governments | 1,396.9 | −2.2 | 5.1 | 12.4 | 769.1 |
| 21 | To the rest of the world | 48.1 | 4.2 | 1.8 | 2.2 | −6.4 |
| 22 | Interest payments | 559.1 | 0.3 | 0.6 | −2.8 | −22.6 |
| 23 | Subsidies | 1,086.2 | 20.9 | −0.9 | −6.0 | 1,011.7 |
| 24 | Net federal government saving | −5,659.1 | −51.1 | 29.2 | −95.9 | −4,508.3 |
| 25 | Social insurance funds | −1,624.9 | −14.5 | −3.5 | −29.5 | −1,170.1 |
| 26 | Other | −4,034.1 | −36.5 | 32.6 | −66.4 | −3,338.1 |
| Addenda: | ||||||
| 27 | Total receipts | 3,485.6 | −2.4 | 61.5 | −9.4 | −284.3 |
| 28 | Current receipts | 3,468.3 | −2.1 | 61.3 | −10.6 | −284.8 |
| 29 | Capital transfer receipts | 17.3 | −0.3 | 0.2 | 1.2 | 0.5 |
| 30 | Total expenditures | 9,250.0 | 57.7 | 46.1 | 90.1 | 4,220.2 |
| 31 | Current expenditures | 9,127.4 | 48.9 | 32.2 | 85.3 | 4,223.5 |
| 32 | Gross government investment | 341.7 | 9.0 | 9.6 | 0.3 | 7.1 |
| 33 | Capital transfer payments | 84.6 | 2.4 | 6.1 | 6.3 | −7.8 |
| 34 | Net purchases of nonproduced assets | −0.1 | 0.1 | 0.9 | 0.4 | 0.4 |
| 35 | Less: Consumption of fixed capital | 303.6 | 2.7 | 2.5 | 2.2 | 3.1 |
| 36 | Net lending or net borrowing (−) | −5,764.4 | −60.2 | 15.3 | −99.5 | −4,504.4 |
Net state and local government saving was $516.5 billion in the second quarter, increasing $719.2 billion from −$202.7 billion in the first quarter. In the second quarter, current receipts accelerated and current expenditures turned down (table 3).
The state and local government fiscal position improved. In the second quarter, net lending was $426.7 billion, an improvement of $723.6 billion; in the first quarter, net borrowing was $296.9 billion.
- Personal current taxes (line 3) turned down in the second quarter, reflecting a downturn in personal income taxes. The downturn in personal income taxes reflects the pattern of wages.
- Taxes on production and imports (line 4) turned down in the second quarter, reflecting downturns in sales taxes and in severance taxes.
- Federal grants-in-aid (line 9) accelerated in the second quarter, reflecting an increase in grants funding COVID-19 response efforts appropriated through the CARES Act. General economic and labor affairs grants accelerated, reflecting payments from the Coronavirus Relief Fund to cover expenditures incurred due to the public health emergency. Health grants accelerated, reflecting an increase in federal Medicaid matching funds to assist states with responding to the COVID-19 pandemic. Education grants also accelerated, reflecting funds provided to handle COVID-19 response activities at public schools and colleges.
- Current surplus of government enterprises (line 11) continued to decrease, reflecting a drop in sales revenue by government enterprises, including drops in revenue from toll roads and public transit as a result of reduced travel in response to the COVID-19 pandemic.
- Consumption expenditures (line 13) turned down in the second quarter, reflecting a downturn in compensation of general government and a larger decrease in intermediate purchases of goods and services.
- Government social benefits (line 14) accelerated in the second quarter, reflecting an acceleration in Medicaid benefits.
- Gross government investment (line 25) turned down in the second quarter, reflecting a downturn in investment in structures, specifically for highways and streets.
| Line | Level | Change from preceding quarter | ||||
|---|---|---|---|---|---|---|
| 2020 | 2019 | 2019 | 2020 | 2020 | ||
| II | III | IV | I | II | ||
| 1 | Current receipts | 3,489.4 | −23.4 | 7.0 | 29.1 | 704.4 |
| 2 | Current tax receipts | 1,851.5 | −20.2 | 2.1 | 22.3 | −53.2 |
| 3 | Personal current taxes | 495.7 | −35.5 | −3.0 | 14.9 | −0.1 |
| 4 | Taxes on production and imports | 1,301.4 | 14.1 | 3.9 | 15.8 | −44.8 |
| 5 | Taxes on corporate income | 54.4 | 1.1 | 1.2 | −8.3 | −8.3 |
| 6 | Contributions for government social insurance | 19.1 | −0.3 | −0.7 | −0.7 | −1.3 |
| 7 | Income receipts on assets | 97.7 | 0.4 | 0.8 | 0.2 | −0.1 |
| 8 | Current transfer receipts | 1,543.7 | −3.1 | 4.6 | 13.2 | 769.9 |
| 9 | Federal grants-in-aid | 1,396.9 | −2.2 | 5.1 | 12.4 | 769.1 |
| 10 | Other | 146.8 | −0.9 | −0.4 | 0.8 | 0.8 |
| 11 | Current surplus of government enterprises | −22.5 | −0.2 | 0.0 | −5.9 | −10.7 |
| 12 | Current expenditures | 2,973.0 | 21.3 | 9.5 | 9.4 | −14.7 |
| 13 | Consumption expenditures | 1,884.6 | 11.8 | 14.2 | 9.2 | −43.4 |
| 14 | Government social benefits | 801.1 | 8.2 | −2.4 | 6.1 | 34.0 |
| 15 | Interest payments | 286.7 | 1.3 | −2.3 | −5.9 | −5.3 |
| 16 | Subsidies | 0.6 | 0.0 | 0.0 | 0.0 | 0.0 |
| 17 | Net state and local government saving | 516.5 | −44.6 | −2.6 | 19.7 | 719.2 |
| 18 | Social insurance funds | 3.4 | −0.5 | −0.8 | −1.0 | −1.5 |
| 19 | Other | 513.1 | −44.3 | −1.7 | 20.7 | 720.7 |
| Addenda: | ||||||
| 20 | Total receipts | 3,571.8 | −21.1 | 7.8 | 31.8 | 708.8 |
| 21 | Current receipts | 3,489.4 | −23.4 | 7.0 | 29.1 | 704.4 |
| 22 | Capital transfer receipts | 82.4 | 2.3 | 0.9 | 2.8 | 4.3 |
| 23 | Total expenditures | 3,145.1 | 17.5 | 13.6 | 23.1 | −14.8 |
| 24 | Current expenditures | 2,973.0 | 21.3 | 9.5 | 9.4 | −14.7 |
| 25 | Gross government investment | 448.6 | −1.0 | 5.3 | 15.1 | −5.0 |
| 26 | Capital transfer payments | |||||
| 27 | Net purchases of nonproduced assets | 24.2 | 0.2 | 0.3 | 1.2 | 5.8 |
| 28 | Less: Consumption of fixed capital | 300.6 | 2.9 | 1.7 | 2.4 | 0.9 |
| 29 | Net lending or net borrowing (−) | 426.7 | −38.7 | −5.7 | 8.7 | 723.6 |


