
GDP and the Economy
Second Estimates for the Fourth Quarter of 2020
Real gross domestic product (GDP) increased at an annual rate of 4.1 percent in the fourth quarter of 2020, according to the second estimates of the National Income and Product Accounts (NIPAs) (chart 1 and table 1).1 With the second estimate, real GDP growth was revised up 0.1 percentage point from the advance estimate issued last month. In the third quarter, real GDP increased 33.4 percent.
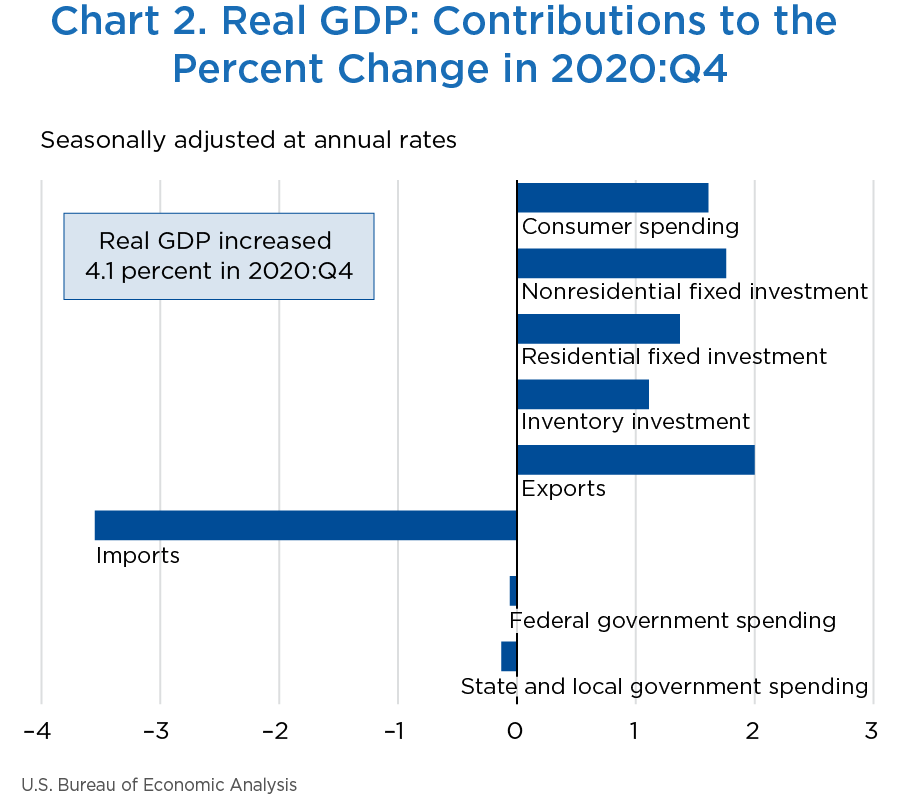
The increase in real GDP in the fourth quarter reflected increases in exports, nonresidential fixed investment, consumer spending, residential fixed investment, and private inventory investment that were partly offset by decreases in state and local government spending and federal government spending.2 Imports, which are a subtraction in the calculation of GDP, increased (chart 2).
In 2020 (from the 2019 annual level to the 2020 annual level), real GDP decreased 3.5 percent after increasing 2.2 percent in 2019 (see “Real GDP, 2020”).

[Click chart to expand]
[Click chart to expand]
The smaller increase in real GDP growth in the fourth quarter followed a record quarterly GDP growth rate in the third quarter and continued the economic recovery from the sharp decreases in 2020 at the start of the COVID-19 pandemic. Led by a smaller increase in consumer spending, most GDP components contributed to the slower rate of growth, except for federal government spending and state and local government spending. Imports slowed.
- The smaller increase in consumer spending reflected a downturn in spending on goods and a smaller increase in spending on services.
- Within goods, all components of both durable and nondurable goods contributed to the downturn. The leading contributors were a sharp slowdown in spending on clothing and footwear and a downturn in spending on motor vehicles and parts.
- Within services, the leading contributors to the smaller increase were a sharp slowdown in spending on health care and a downturn in spending on food services and accommodations.
- A smaller increase in private inventory investment was the second largest contributor to the slowdown in real GDP. The smaller increase was more than accounted for by a downturn in inventory investment by motor vehicle dealers. A notable offset was an upturn in inventories for petroleum and coal product manufacturing.
- Exports slowed, reflecting a sharp slowdown in exports of goods (mainly automotive vehicles, engines, and parts) that was partly offset by an upturn in exports of services (more than accounted for by travel services).
- Nonresidential fixed investment slowed, reflecting slowdowns in investment in equipment and intellectual property products that were partly offset by an upturn in investment in structures.
- The slowdown in equipment investment mainly reflected a slowdown in spending on transportation equipment.
- Within intellectual property products, slowdowns in research and development and in software were partly offset by an upturn in entertainment, literary, and artistic originals.
- The upturn in structures was more than accounted for by an upturn in mining exploration, shafts, and wells.
- Imports slowed. As a subtraction in the calculation of GDP, imports therefore contributed positively to GDP growth in the fourth quarter. The main contributor was a slowdown in imports of automotive vehicles, engines, and parts.
| Line | Series | Share of current-dollar GDP (percent) | Change from preceding period (percent) | Contribution to percent change in real GDP (percentage points) | ||||||
|---|---|---|---|---|---|---|---|---|---|---|
| 2020 | 2020 | 2020 | ||||||||
| Q4 | Q1 | Q2 | Q3 | Q4 | Q1 | Q2 | Q3 | Q4 | ||
| 1 | Gross domestic product (GDP)1 | 100.0 | −5.0 | −31.4 | 33.4 | 4.1 | −5.0 | −31.4 | 33.4 | 4.1 |
| 2 | Personal consumption expenditures | 67.7 | −6.9 | −33.2 | 41.0 | 2.4 | −4.75 | −24.01 | 25.44 | 1.61 |
| 3 | Goods | 22.6 | 0.1 | −10.8 | 47.2 | −0.9 | 0.03 | −2.06 | 9.55 | −0.20 |
| 4 | Durable goods | 8.1 | −12.5 | −1.7 | 82.7 | −0.6 | −0.93 | 0.00 | 5.20 | −0.04 |
| 5 | Nondurable goods | 14.5 | 7.1 | −15.0 | 31.1 | −1.1 | 0.97 | −2.05 | 4.35 | −0.15 |
| 6 | Services | 45.1 | −9.8 | −41.8 | 38.0 | 4.0 | −4.78 | −21.95 | 15.89 | 1.80 |
| 7 | Gross private domestic investment | 18.2 | −9.0 | −46.6 | 86.3 | 26.5 | −1.56 | −8.77 | 11.96 | 4.23 |
| 8 | Fixed investment | 18.0 | −1.4 | −29.2 | 31.3 | 19.1 | −0.23 | −5.27 | 5.39 | 3.12 |
| 9 | Nonresidential | 13.4 | −6.7 | −27.2 | 22.9 | 14.0 | −0.91 | −3.67 | 3.20 | 1.76 |
| 10 | Structures | 2.6 | −3.7 | −33.6 | −17.4 | 1.1 | −0.11 | −1.11 | −0.53 | 0.03 |
| 11 | Equipment | 5.9 | −15.2 | −35.9 | 68.2 | 25.7 | −0.91 | −2.03 | 3.26 | 1.33 |
| 12 | Intellectual property products | 4.9 | 2.4 | −11.4 | 8.4 | 8.4 | 0.11 | −0.53 | 0.46 | 0.40 |
| 13 | Residential | 4.6 | 19.0 | −35.6 | 63.0 | 35.8 | 0.68 | −1.60 | 2.19 | 1.37 |
| 14 | Change in private inventories | 0.2 | ...... | ...... | ...... | ...... | −1.34 | −3.50 | 6.57 | 1.11 |
| 15 | Net exports of goods and services | −3.7 | ...... | ...... | ...... | ...... | 1.13 | 0.62 | −3.21 | −1.55 |
| 16 | Exports | 10.3 | −9.5 | −64.4 | 59.6 | 21.8 | −1.12 | −9.51 | 4.89 | 2.00 |
| 17 | Goods | 7.1 | −2.7 | −66.8 | 104.3 | 30.8 | −0.20 | −6.56 | 4.87 | 1.86 |
| 18 | Services | 3.2 | −20.8 | −59.6 | −0.5 | 4.3 | −0.92 | −2.95 | 0.03 | 0.13 |
| 19 | Imports | 14.0 | −15.0 | −54.1 | 93.1 | 29.6 | 2.25 | 10.13 | −8.10 | −3.55 |
| 20 | Goods | 11.9 | −11.4 | −49.6 | 110.2 | 30.7 | 1.36 | 7.32 | −7.67 | −3.10 |
| 21 | Services | 2.1 | −28.5 | −69.9 | 24.9 | 23.9 | 0.90 | 2.80 | −0.43 | −0.45 |
| 22 | Government consumption expenditures and gross investment | 17.8 | 1.3 | 2.5 | −4.8 | −1.1 | 0.22 | 0.77 | −0.75 | −0.19 |
| 23 | Federal | 7.0 | 1.6 | 16.4 | −6.2 | −0.9 | 0.10 | 1.17 | −0.38 | −0.06 |
| 24 | National defense | 4.2 | −0.3 | 3.8 | 3.2 | 4.7 | −0.01 | 0.18 | 0.17 | 0.20 |
| 25 | Nondefense | 2.7 | 4.4 | 37.6 | −18.3 | −8.9 | 0.11 | 0.98 | −0.55 | −0.26 |
| 26 | State and local | 10.9 | 1.1 | −5.4 | −3.9 | −1.2 | 0.12 | −0.40 | −0.37 | −0.13 |
| Addenda: | ||||||||||
| 27 | Gross domestic income (GDI)2 | ...... | −2.5 | −32.6 | 24.1 | ...... | ...... | ...... | ...... | ...... |
| 28 | Average of GDP and GDI | ...... | −3.7 | −32.0 | 28.7 | ...... | ...... | ...... | ...... | ...... |
| 29 | Final sales of domestic product | 99.8 | −3.6 | −28.1 | 25.9 | 3.0 | −3.62 | −27.88 | 26.87 | 2.98 |
| 30 | Goods | 30.9 | −3.5 | −29.0 | 62.4 | 4.7 | −0.98 | −7.40 | 17.42 | 1.46 |
| 31 | Services | 60.2 | −7.6 | −32.9 | 23.7 | 1.9 | −4.82 | −21.32 | 14.60 | 1.15 |
| 32 | Structures | 8.9 | 10.3 | −28.4 | 14.9 | 18.3 | 0.85 | −2.66 | 1.42 | 1.49 |
| 33 | Motor vehicle output | 2.8 | −24.7 | −86.9 | 1,133.9 | −13.9 | −0.73 | −3.99 | 5.92 | −0.44 |
| 34 | GDP excluding motor vehicle output | 97.2 | −4.4 | −29.0 | 26.7 | 4.7 | −4.23 | −27.39 | 27.52 | 4.53 |
- The GDP estimates under the contribution columns are also percent changes.
- GDI is deflated by the implicit price deflator for GDP. The third-quarter 2020 change in GDI reflects the incorporation of new data on private wages and salaries.
Prices for gross domestic purchases—goods and services purchased by U.S. residents—increased 1.8 percent in the fourth quarter after increasing 3.3 percent in the third quarter (table 2 and chart 3). The leading contributors to the slowdown were smaller increases in the prices paid for consumer spending, mainly motor vehicles and parts and gasoline and other energy goods. Notable offsets included an upturn in prices for consumer spending on transportation services and a smaller decrease in prices for food and beverages purchased for off-premises consumption.

[Click chart to expand]
Food prices were unchanged in the fourth quarter after decreasing 1.7 percent in the third quarter. Prices for energy goods and services increased 9.2 percent after increasing 27.4 percent. Gross domestic purchases prices excluding food and energy increased 1.7 percent after increasing 3.0 percent.
Consumer prices excluding food and energy, a measure of the “core” rate of inflation, slowed, increasing 1.4 percent in the fourth quarter after increasing 3.4 percent in the third quarter.
| Line | Series | Change from preceding period (percent) | Contribution to percent change in gross domestic purchases prices (percentage points) | ||||||
|---|---|---|---|---|---|---|---|---|---|
| 2020 | 2020 | ||||||||
| Q1 | Q2 | Q3 | Q4 | Q1 | Q2 | Q3 | Q4 | ||
| 1 | Gross domestic purchases1 | 1.4 | −1.4 | 3.3 | 1.8 | 1.4 | −1.4 | 3.3 | 1.8 |
| 2 | Personal consumption expenditures | 1.3 | −1.6 | 3.7 | 1.6 | 0.85 | −1.06 | 2.39 | 1.03 |
| 3 | Goods | −0.9 | −5.6 | 5.4 | 0.1 | −0.19 | −1.21 | 1.18 | 0.03 |
| 4 | Durable goods | −1.7 | −3.1 | 8.2 | 0.0 | −0.12 | −0.23 | 0.62 | 0.00 |
| 5 | Nondurable goods | −0.5 | −6.8 | 4.0 | 0.2 | −0.07 | −0.98 | 0.56 | 0.02 |
| 6 | Services | 2.3 | 0.3 | 2.8 | 2.3 | 1.04 | 0.15 | 1.21 | 1.01 |
| 7 | Gross private domestic investment | 1.8 | −0.1 | 2.7 | 1.5 | 0.29 | 0.00 | 0.43 | 0.26 |
| 8 | Fixed investment | 1.3 | 0.8 | 2.2 | 1.8 | 0.21 | 0.14 | 0.38 | 0.31 |
| 9 | Nonresidential | 1.0 | 0.8 | 0.1 | 0.1 | 0.12 | 0.11 | 0.02 | 0.02 |
| 10 | Structures | 1.5 | −1.1 | 0.5 | 0.1 | 0.04 | −0.03 | 0.01 | 0.00 |
| 11 | Equipment | 0.7 | 0.0 | −0.6 | −2.0 | 0.04 | 0.00 | −0.03 | −0.11 |
| 12 | Intellectual property products | 0.9 | 2.9 | 0.7 | 2.8 | 0.04 | 0.14 | 0.04 | 0.13 |
| 13 | Residential | 2.3 | 1.0 | 9.5 | 6.9 | 0.09 | 0.04 | 0.37 | 0.29 |
| 14 | Change in private inventories | ...... | ...... | ...... | ...... | 0.08 | −0.14 | 0.05 | −0.04 |
| 15 | Government consumption expenditures and gross investment | 1.8 | −1.9 | 2.6 | 2.8 | 0.31 | −0.35 | 0.48 | 0.48 |
| 16 | Federal | −0.3 | −1.1 | 1.7 | 2.7 | −0.02 | −0.08 | 0.12 | 0.18 |
| 17 | National defense | −0.1 | −2.5 | 2.0 | 2.9 | −0.01 | −0.10 | 0.08 | 0.12 |
| 18 | Nondefense | −0.5 | 1.0 | 1.3 | 2.4 | −0.01 | 0.03 | 0.04 | 0.06 |
| 19 | State and local | 3.1 | −2.4 | 3.2 | 2.9 | 0.32 | −0.28 | 0.36 | 0.30 |
| Addenda: | |||||||||
| Gross domestic purchases: | |||||||||
| 20 | Food | 3.2 | 15.7 | −1.7 | 0.0 | 0.15 | 0.77 | −0.09 | 0.00 |
| 21 | Energy goods and services | −7.0 | −45.7 | 27.4 | 9.2 | −0.19 | −1.47 | 0.59 | 0.19 |
| 22 | Excluding food and energy | 1.6 | −0.8 | 3.0 | 1.7 | 1.49 | −0.71 | 2.80 | 1.59 |
| Personal consumption expenditures: | |||||||||
| 23 | Food and beverages purchased for off-premises consumption | 3.1 | 15.4 | −1.9 | −0.4 | ...... | ...... | ...... | ...... |
| 24 | Energy goods and services | −9.8 | −44.9 | 24.9 | 11.5 | ...... | ...... | ...... | ...... |
| 25 | Excluding food and energy | 1.6 | −0.8 | 3.4 | 1.4 | ...... | ...... | ...... | ...... |
| 26 | Gross domestic product | 1.4 | −1.8 | 3.5 | 2.1 | ...... | ...... | ...... | ...... |
| 27 | Exports of goods and services | −2.5 | −18.8 | 12.8 | 5.9 | ...... | ...... | ...... | ...... |
| 28 | Imports of goods and services | −1.4 | −12.8 | 8.6 | 2.2 | ...... | ...... | ...... | ...... |
- The estimates for gross domestic purchases under the contribution columns are also percent changes.
Measured in current dollars, personal income decreased $349.1 billion in the fourth quarter, compared with a decrease of $603.8 billion (revised, see below) in the third quarter (table 3). The decrease in personal income was more than accounted for by decreases in personal current transfer receipts (notably, government social benefits related to the winding down of certain pandemic relief programs) and proprietors' income that were partly offset by increases in compensation and personal dividend income. The addenda lines in table 3 include detail on the effects of selected federal pandemic response programs on personal income.
- Within government social benefits, unemployment insurance and “other” social benefits decreased, primarily reflecting declines in payments from Federal Pandemic Unemployment Compensation and Lost Wages Assistance, two programs that aid individuals impacted by the COVID-19 pandemic.
- Within proprietors' income, a decrease in nonfarm proprietors' income was partly offset by an increase in farm proprietors' income.
- In nonfarm proprietors' income, the decrease primarily reflected a decline in Paycheck Protection Program loans.
- In farm proprietors' income, the increase primarily reflected an increase in payments under the Coronavirus Food Assistance Program, which provides support to farmers and ranchers impacted by COVID-19.
- Within compensation, the leading contributor to the increase was private wages and salaries.
- The increase in personal dividend income was based primarily on company financial data for the fourth quarter.
Personal current taxes increased $44.5 billion in the fourth quarter after increasing $95.1 billion (revised) in the third quarter.
Disposable personal income (DPI) decreased $393.6 billion in the fourth quarter after decreasing $698.9 billion (revised) in the third quarter. Personal outlays increased $130.9 billion after increasing $1.30 trillion in the third quarter.
The personal saving rate (chart 4)—personal saving as a percentage of DPI—was 13.0 percent in the fourth quarter; in the third quarter, the personal saving rate was 15.7 percent (revised).
Real DPI (chart 5) decreased 10.0 percent in the fourth quarter after decreasing 17.4 percent (revised) in the third quarter. Current-dollar DPI decreased 8.6 percent after decreasing 14.4 percent (revised).
With the release of the second estimate of GDP, the Bureau of Economic Analysis also released revised estimates of third-quarter 2020 wages and salaries, personal taxes, contributions for social insurance, and gross domestic income (GDI). These estimates reflect new data for third-quarter private wages and salaries from the Bureau of Labor Statistics Quarterly Census of Employment and Wages. As a result:
- Wages and salaries is now estimated to have increased $434.5 billion in the third quarter, a downward revision of $66.5 billion.
- Personal income is now estimated to have decreased $603.8 billion, a downward revision of $62.3 billion.
- Real DPI is now estimated to have decreased 17.4 percent; in the previously published estimate, real DPI decreased 16.3 percent.
- The personal saving rate is now estimated at 15.7 percent; in the previously published estimate, the personal saving rate was 16.0 percent.
- The percent change in third-quarter real GDI (table 1) is now estimated at 24.1 percent; in the previously published estimate, real GDI increased 25.8 percent.

[Click chart to expand]

[Click chart to expand]
| Line | Series | Level | Change from preceding period | ||||
|---|---|---|---|---|---|---|---|
| 2020 | 2020 | ||||||
| Q3 | Q4 | Q1 | Q2 | Q3 | Q4 | ||
| 1 | Personal income | 19,853.5 | 19,504.4 | 190.2 | 1,506.3 | −603.8 | −349.1 |
| 2 | Compensation of employees | 11,466.2 | 11,707.8 | 109.6 | −724.9 | 516.7 | 241.6 |
| 3 | Wages and salaries | 9,343.3 | 9,549.4 | 103.6 | −617.3 | 434.5 | 206.1 |
| 4 | Private industries | 7,900.9 | 8,112.4 | 91.5 | −557.3 | 413.7 | 211.4 |
| 5 | Goods-producing industries | 1,506.3 | 1,529.5 | 1.8 | −112.1 | 75.3 | 23.2 |
| 6 | Manufacturing | 887.0 | 888.8 | −3.6 | −56.0 | 29.2 | 1.8 |
| 7 | Services-producing industries | 6,394.6 | 6,582.9 | 89.8 | −445.2 | 338.4 | 188.3 |
| 8 | Trade, transportation, and utilities | 1,447.8 | 1,472.1 | 17.0 | −82.0 | 85.7 | 24.3 |
| 9 | Other services-producing industries | 4,946.8 | 5,110.7 | 72.8 | −363.2 | 252.7 | 164.0 |
| 10 | Government | 1,442.4 | 1,437.0 | 12.1 | −60.0 | 20.8 | −5.4 |
| 11 | Supplements to wages and salaries | 2,122.9 | 2,158.4 | 6.0 | −107.7 | 82.2 | 35.5 |
| 12 | Proprietors' income with IVA and CCAdj | 1,803.0 | 1,757.4 | 8.3 | −194.1 | 291.1 | −45.6 |
| 13 | Farm | 62.8 | 100.0 | −2.3 | −17.5 | 23.8 | 37.2 |
| 14 | Nonfarm | 1,740.2 | 1,657.4 | 10.6 | −176.6 | 267.2 | −82.8 |
| 15 | Rental income of persons with CCAdj | 804.4 | 804.9 | 6.8 | −6.3 | 8.3 | 0.5 |
| 16 | Personal income receipts on assets | 2,852.3 | 2,902.3 | 3.9 | −74.1 | −57.9 | 49.9 |
| 17 | Personal interest income | 1,619.8 | 1,622.3 | −13.7 | −42.7 | −17.3 | 2.5 |
| 18 | Personal dividend income | 1,232.6 | 1,280.0 | 17.6 | −31.4 | −40.6 | 47.4 |
| 19 | Personal current transfer receipts | 4,369.3 | 3,794.9 | 80.3 | 2,442.5 | −1,308.8 | −574.4 |
| 20 | Government social benefits to persons | 4,323.4 | 3,748.6 | 80.9 | 2,437.8 | −1,304.0 | −574.7 |
| 21 | Social security | 1,080.7 | 1,089.1 | 25.4 | 6.9 | 5.2 | 8.4 |
| 22 | Medicare | 842.7 | 860.6 | 6.7 | 19.4 | 18.7 | 17.9 |
| 23 | Medicaid | 683.7 | 684.5 | 4.7 | 44.7 | 14.9 | 0.8 |
| 24 | Unemployment insurance | 775.2 | 297.8 | 15.5 | 1,041.1 | −309.4 | −477.3 |
| 25 | Veterans' benefits | 145.3 | 148.2 | 4.1 | 3.5 | 3.3 | 2.9 |
| 26 | Other | 795.8 | 668.4 | 24.4 | 1,322.1 | −1,036.7 | −127.4 |
| 27 | Other current transfer receipts, from business (net) | 45.9 | 46.2 | −0.6 | 4.7 | −4.7 | 0.3 |
| 28 | Less: Contributions for government social insurance | 1,441.6 | 1,462.9 | 18.7 | −63.2 | 53.3 | 21.2 |
| 29 | Less: Personal current taxes | 2,191.6 | 2,236.1 | 31.2 | −155.9 | 95.1 | 44.5 |
| 30 | Equals: Disposable personal income (DPI) | 17,661.9 | 17,268.3 | 159.0 | 1,662.2 | −698.9 | −393.6 |
| 31 | Less: Personal outlays | 14,887.1 | 15,018.1 | −232.5 | −1,513.3 | 1,297.2 | 130.9 |
| 32 | Personal consumption expenditures | 14,401.5 | 14,542.4 | −213.7 | −1,448.1 | 1,304.2 | 140.8 |
| 33 | Personal interest payments1 | 287.2 | 270.7 | −11.7 | −66.9 | 1.2 | −16.4 |
| 34 | Personal current transfer payments | 198.4 | 205.0 | −7.1 | 1.7 | −8.2 | 6.5 |
| 35 | Equals: Personal saving | 2,774.8 | 2,250.2 | 391.5 | 3,175.5 | −1,996.0 | −524.6 |
| 36 | Personal saving as a percentage of DPI | 15.7 | 13.0 | ...... | ...... | ...... | ...... |
| Addenda: | |||||||
| Percent change at annual rate | |||||||
| 37 | Current-dollar DPI | ...... | ...... | 3.9 | 46.2 | −14.4 | −8.6 |
| 38 | Real DPI, chained (2012) dollars | ...... | ...... | 2.6 | 48.6 | −17.4 | −10.0 |
| The effects of selected federal pandemic response programs on personal income (billions of dollars) | |||||||
| In farm proprietors' income with IVA and CCAdj: | |||||||
| 39 | Coronovirus Food Assistance Program2 | 18.5 | 46.3 | ...... | 16.9 | 1.6 | 27.8 |
| 40 | Paycheck Protecton Program loans to businesses3 | 9.2 | 2.8 | ...... | 6.5 | 2.7 | −6.4 |
| In nonfarm proprietors' income with IVA and CCAdj: | |||||||
| 41 | Paycheck Protecton Program loans to businesses3 | 297.1 | 89.4 | ...... | 209.1 | 88.0 | −207.7 |
| In government social benefits to persons, Medicare: | |||||||
| 42 | Increase in Medicare rembursement rates4 | 14.8 | 15.1 | ...... | 9.7 | 5.1 | 0.3 |
| In government social benefits to persons, Unemployment insurance5: | |||||||
| 43 | Extended Unemployment Benefits | 3.1 | 10.9 | ...... | ...... | 3.1 | 7.9 |
| 44 | Pandemic Emergency Unemployment Compensation | 23.9 | 64.9 | ...... | 7.2 | 16.7 | 40.1 |
| 45 | Pandemic Unemployment Assistance | 156.1 | 112.0 | ...... | 101.5 | 54.6 | −45.3 |
| 46 | Pandemic Unemployment Compensation Payments | 373.1 | 16.1 | ...... | 679.2 | −306.1 | −359.5 |
| In government social benefits to persons, Other: | 0.0 | 0.0 | |||||
| 47 | Economic impact payments6 | 15.6 | 5.1 | ...... | 1,078.1 | −1,062.5 | −10.5 |
| 48 | Lost wages supplemental payments7 | 106.2 | 35.8 | ...... | ...... | 106.2 | −70.4 |
| 49 | Paycheck Protecton Program loans to NPISH3 | 27.0 | 10.8 | ...... | 19.1 | 7.9 | −16.2 |
| 50 | Provider Relief Fund to NPISH8 | 58.4 | 34.4 | ...... | 160.9 | −102.5 | −24.0 |
| In personal outlays, personal interest payments: | |||||||
| 51 | Student loan forbearance9 | −36.0 | −36.0 | −7.1 | −28.9 | 0.0 | 0.0 |
- CCAdj
- Capital consumption adjustment
- IVA
- Inventory valuation adjustment
- Consists of nonmortgage interest paid by households. Note that mortgage interest paid by households is an expense item in the calculation of rental income of persons.
- The Coronavirus Food Assistance Program, initially established by the Coronavirus Aid, Relief and Economic Security Act (CARES) provides direct support to farmers and ranchers where prices and market supply chains have been impacted by the COVID-19 pandemic.
- The Paycheck Protection Program, initially established by the CARES Act, provides forgivable loans to help small businesses and nonprofit institutions make payroll and cover other expenses. It also provides funding to reimburse private lending institutions for the costs of administering these loans. For more information, see “How does the Paycheck Protection Program impact the national income and product accounts (NIPAs)?”.
- A two percent reduction in reimbursements paid to Medicare service providers that went into effect in 2013 was initially suspended by the CARES Act. The resulting increased reimbursement rates went into effect beginning on May 1, 2020.
- Unemployment insurance benefits were expanded through several programs that were initially established through the CARES Act. For more information, see “How will the expansion of unemployment benefits in response to the COVID-19 pandemic be recorded in the NIPAs?”.
- Economic impact payments, initially established by the CARES Act, provide direct payments to individuals. For more information, see “How are the economic impact payments to support individuals during the COVID-19 pandemic recorded in the NIPAs?”
- The Federal Emergency Mangement Agency (FEMA) was authorized to make payments from the Disaster Relief Fund to supplement wages lost as a result of the COVID-19 pandemic.
- The Department of Health and Human Services distributes money from the Provider Relief Fund to hospitals and health care providers on the front lines of the coronavirus response. This funding supports health care-related expenses or lost revenue attributable to COVID-19 and ensures uninsured Americans can get treatment for COVID-19. In the NIPAs, funds provided to nonprofit hospitals are recorded as social benefits.
- Interest payments due on certain categories of federally-held student loans were initially suspended by the CARES Act. For more information, see “How does the federal response to the COVID-19 affect BEA's estimate of personal interest payments”.
In the second estimate of the fourth quarter, the growth rate in real GDP was revised up 0.1 percentage point from the advance estimate. The updated estimates primarily reflected upward revisions to residential fixed investment, private inventory investment, and state and local government spending. These upward revisions were partly offset by a downward revision to consumer spending.
- Within residential fixed investment, the revision primarily reflected an upward revision to structures, mainly new single-family housing.
- The revision to private inventory investment reflected an upward revision to nonfarm inventories. Upward revisions to nondurable goods manufacturing (notably, food and chemicals) and retail trade (notably, motor vehicle dealers) were partly offset by downward revisions to construction, mining, and utilities as well as wholesale trade.
- The revision to state and local government primarily reflected an upward revision to structures investment.
- The revision to consumer spending reflected a downward revision to goods that was led by motor vehicles.
| Line | Series | Change from preceding period (percent) | Contribution to percent change in real GDP (percentage points) | ||||
|---|---|---|---|---|---|---|---|
| Advance estimate | Second estimate | Second estimate minus advance estimate | Advance estimate | Second estimate | Second estimate minus advance estimate | ||
| 1 | Gross domestic product (GDP)1 | 4.0 | 4.1 | 0.1 | 4.0 | 4.1 | 0.1 |
| 2 | Personal consumption expenditures | 2.5 | 2.4 | −0.1 | 1.70 | 1.61 | −0.09 |
| 3 | Goods | −0.4 | −0.9 | −0.5 | −0.10 | −0.20 | −0.10 |
| 4 | Durable goods | 0.0 | −0.6 | −0.6 | 0.00 | −0.04 | −0.04 |
| 5 | Nondurable goods | −0.7 | −1.1 | −0.4 | −0.10 | −0.15 | −0.05 |
| 6 | Services | 4.0 | 4.0 | 0.0 | 1.80 | 1.80 | 0.00 |
| 7 | Gross private domestic investment | 25.3 | 26.5 | 1.2 | 4.06 | 4.23 | 0.17 |
| 8 | Fixed investment | 18.4 | 19.1 | 0.7 | 3.02 | 3.12 | 0.10 |
| 9 | Nonresidential | 13.8 | 14.0 | 0.2 | 1.73 | 1.76 | 0.03 |
| 10 | Structures | 3.0 | 1.1 | −1.9 | 0.08 | 0.03 | −0.05 |
| 11 | Equipment | 24.9 | 25.7 | 0.8 | 1.30 | 1.33 | 0.03 |
| 12 | Intellectual property products | 7.5 | 8.4 | 0.9 | 0.35 | 0.40 | 0.05 |
| 13 | Residential | 33.5 | 35.8 | 2.3 | 1.29 | 1.37 | 0.08 |
| 14 | Change in private inventories | ...... | ...... | ...... | 1.04 | 1.11 | 0.07 |
| 15 | Net exports of goods and services | ...... | ...... | ...... | −1.52 | −1.55 | −0.03 |
| 16 | Exports | 22.0 | 21.8 | −0.2 | 2.01 | 2.00 | −0.01 |
| 17 | Goods | 31.1 | 30.8 | −0.3 | 1.88 | 1.86 | −0.02 |
| 18 | Services | 4.3 | 4.3 | 0.0 | 0.14 | 0.13 | −0.01 |
| 19 | Imports | 29.5 | 29.6 | 0.1 | −3.53 | −3.55 | −0.02 |
| 20 | Goods | 30.8 | 30.7 | −0.1 | −3.11 | −3.10 | 0.01 |
| 21 | Services | 22.2 | 23.9 | 1.7 | −0.42 | −0.45 | −0.03 |
| 22 | Government consumption expenditures and gross investment | −1.2 | −1.1 | 0.1 | −0.22 | −0.19 | 0.03 |
| 23 | Federal | −0.5 | −0.9 | −0.4 | −0.04 | −0.06 | −0.02 |
| 24 | National defense | 5.0 | 4.7 | −0.3 | 0.21 | 0.20 | −0.01 |
| 25 | Nondefense | −8.4 | −8.9 | −0.5 | −0.24 | −0.26 | −0.02 |
| 26 | State and local | −1.7 | −1.2 | 0.5 | −0.19 | −0.13 | 0.06 |
| Addenda: | |||||||
| 27 | Final sales of domestic product | 3.0 | 3.0 | 0.0 | 2.97 | 2.98 | 0.01 |
| 28 | Gross domestic purchases price index | 1.7 | 1.8 | 0.1 | ...... | ...... | ...... |
| 29 | GDP price index | 2.0 | 2.1 | 0.1 | ...... | ...... | ...... |
- The GDP estimates under the contribution columns are also percent changes.
Real GDP decreased 3.5 percent in 2020 (from the 2019 annual level to the 2020 annual level), compared with an increase of 2.2 percent in 2019 (table 4). The decrease in real GDP in 2020 reflected decreases in consumer spending, exports, private inventory investment, nonresidential fixed investment, and state and local government that were partly offset by increases in federal government spending and residential fixed investment. Imports decreased (chart 6).
- The decrease in consumer spending in 2020 was more than accounted for by a decrease in spending on services (led by food services and accommodations, health care, and recreation services).

[Click chart to expand]
- The decrease in exports reflected decreases in both services (led by travel) and goods (mainly nonautomotive capital goods).
- The decrease in private inventory investment reflected widespread decreases led by retail trade (mainly motor vehicle dealers) and wholesale trade (mainly durable-goods industries).
- The decrease in nonresidential fixed investment reflected decreases in structures (led by mining exploration, shafts, and wells) and equipment (led by transportation equipment) that were partly offset by an increase in intellectual property products (more than accounted for by software).
- The decrease in state and local government spending reflected a decrease in consumption expenditures (led by compensation).
- The increase in federal government spending reflected an increase in nondefense consumption expenditures (led by an increase in purchases of intermediate services that supported the processing and administration of Paycheck Protection Program loan applications by banks on behalf of the federal government).
- The increase in residential fixed investment primarily reflected increases in improvements as well as brokers' commissions and other ownership transfer costs.
| Line | Series | Share of current-dollar GDP (percent) | Change from preceding period (percent) | Contribution to percent change in real GDP (percentage points) | ||
|---|---|---|---|---|---|---|
| 2020 | 2019 | 2020 | 2019 | 2020 | ||
| 1 | Gross domestic product1 | 100.0 | 2.2 | −3.5 | 2.2 | −3.5 |
| 2 | Personal consumption expenditures | 67.6 | 2.4 | −3.9 | 1.64 | −2.63 |
| 3 | Goods | 22.3 | 3.7 | 3.9 | 0.78 | 0.81 |
| 4 | Durable goods | 7.7 | 4.8 | 6.4 | 0.34 | 0.45 |
| 5 | Nondurable goods | 14.5 | 3.1 | 2.6 | 0.44 | 0.36 |
| 6 | Services | 45.3 | 1.8 | −7.3 | 0.86 | −3.44 |
| 7 | Gross private domestic investment | 17.2 | 1.7 | −5.3 | 0.30 | −0.93 |
| 8 | Fixed investment | 17.6 | 1.9 | −1.8 | 0.32 | −0.30 |
| 9 | Nonresidential | 13.3 | 2.9 | −4.0 | 0.39 | −0.53 |
| 10 | Structures | 2.8 | −0.6 | −10.6 | −0.02 | −0.32 |
| 11 | Equipment | 5.6 | 2.1 | −5.0 | 0.12 | −0.29 |
| 12 | Intellectual property products | 4.9 | 6.4 | 1.6 | 0.29 | 0.08 |
| 13 | Residential | 4.2 | −1.7 | 6.0 | −0.07 | 0.23 |
| 14 | Change in private inventories | −0.4 | ...... | ...... | −0.02 | −0.62 |
| 15 | Net exports of goods and services | −3.1 | ...... | ...... | −0.18 | −0.14 |
| 16 | Exports | 10.2 | −0.1 | −13.0 | −0.01 | −1.47 |
| 17 | Goods | 6.8 | −0.1 | −9.5 | −0.01 | −0.69 |
| 18 | Services | 3.4 | −0.1 | −19.2 | −0.01 | −0.78 |
| 19 | Imports | 13.2 | 1.1 | −9.3 | −0.16 | 1.33 |
| 20 | Goods | 11.0 | 0.5 | −6.1 | −0.06 | 0.71 |
| 21 | Services | 2.2 | 3.7 | −22.5 | −0.10 | 0.62 |
| 22 | Government consumption expenditures and gross investment | 18.3 | 2.3 | 1.1 | 0.40 | 0.19 |
| 23 | Federal | 7.1 | 4.0 | 4.3 | 0.26 | 0.29 |
| 24 | National defense | 4.2 | 5.6 | 3.5 | 0.21 | 0.14 |
| 25 | Nondefense | 2.9 | 1.8 | 5.6 | 0.05 | 0.15 |
| 26 | State and local | 11.2 | 1.3 | −0.8 | 0.14 | −0.09 |
| Addenda: | ||||||
| 27 | Gross domestic income (GDI)2 | ...... | 1.8 | ...... | ...... | ...... |
| 28 | Average of GDP and GDI | ...... | 2.0 | ...... | ...... | ...... |
- The GDP estimates under the contribution columns are also percent changes.
- GDI is deflated by the implicit price deflator for GDP.
- “Real” estimates are in chained (2012) dollars, and price indexes are chain-type measures. Each GDP estimate for a quarter (advance, second, and third) incorporates increasingly comprehensive and improved source data; for more information, see “The Revisions to GDP, GDI, and Their Major Components” in the January 2018 Survey of Current Business. Quarterly estimates are expressed at seasonally adjusted annual rates, which reflect a rate of activity for a quarter as if it were maintained for a year.
- In this article, “consumer spending” refers to “personal consumption expenditures,” “inventory investment” refers to “change in private inventories,” and “government spending” refers to “government consumption expenditures and gross investment.”
- Footnote/endnote 3, etc.