
Annual Update of the U.S. International Transactions Accounts
In June 2021, the Bureau of Economic Analysis (BEA) released the results of the 2021 annual updates of the U.S. International Transactions Accounts (ITAs) and the U.S. International Investment Position (IIP) Accounts.1 With this annual update of the ITAs, quarterly and annual statistics on U.S. international transactions were revised to incorporate newly available and revised source data and updated seasonal and trading-day adjustments as follows:
- Goods exports and imports for 2018–2020 were updated to incorporate newly available and revised source data, mainly from the U.S. Census Bureau.
- Services exports and imports for 2013–2020 were updated to incorporate newly available and revised source data, mainly from BEA's surveys of international services, including the 2018 Benchmark Survey of Insurance Transactions by U.S. Insurance Companies with Foreign Persons. For personal, cultural, and recreational services, exports and imports for 2020 were updated to also incorporate newly available source data on remote education during the COVID-19 pandemic from the Institute of International Education (IIE).
- Primary income receipts and payments for 2017–2020 were updated to incorporate newly available and revised source data, mainly from BEA's surveys of direct investment, including the 2017 Benchmark Survey of Foreign Direct Investment in the United States, and the U.S. Department of the Treasury's Treasury International Capital (TIC) surveys.
- Secondary income receipts and payments for 2013–2020 were updated to incorporate newly available and revised source data, mainly from BEA's 2018 Benchmark Survey of Insurance Transactions by U.S. Insurance Companies with Foreign Persons.
- Financial asset and liability transactions for direct investment, portfolio investment, other investment, and financial derivatives for 2017–2020 were updated to incorporate newly available and revised source data, mainly from BEA's surveys of direct investment, including the 2017 Benchmark Survey of Foreign Direct Investment in the United States, and the TIC surveys.
- Seasonal factors and trading-day adjustments were revised for 2016–2020.
Appendix A provides a numerical summary of quarterly revisions to key ITA balances. For a comparison of this year's revisions with revisions from past annual updates, see the box “2021 Annual Update in Historical Context.”
For 2013–2020, this annual update has not altered the overall picture of U.S. international transactions. Revisions to the current-account deficit and to net borrowing from financial-account transactions generally did not alter their direction of change (increase or decrease). The exception was net borrowing for 2019, which decreased $24.2 billion in the previously published statistics and increased $132.0 billion in the revised statistics. The largest revision to the current-account deficit was a downward revision of $31.1 billion for 2020 (table A, chart 1). The largest revision to net borrowing from financial-account transactions was a downward revision of $90.6 billion for 2020 (chart 2).
The next section of this article discusses the incorporation of the 2017 Benchmark Survey of Foreign Direct Investment in the United States, the incorporation of the 2018 Benchmark Survey of Insurance Transactions by U.S. Insurance Companies with Foreign Persons, and special adjustments to source data. The final section summarizes the effects of the revisions on the current account, the financial account, and the statistical discrepancy of the ITAs.
| Balances and statistical discrepancy | 2013 | 2014 | 2015 | 2016 | 2017 | 2018 | 2019 | 2020 |
|---|---|---|---|---|---|---|---|---|
| Balance on current account (line 101): | ||||||||
| Revised | −339.5 | −370.0 | −408.9 | −397.6 | −361.7 | −438.2 | −472.1 | −616.1 |
| Previously published | −336.9 | −367.8 | −407.4 | −394.9 | −365.3 | −449.7 | −480.2 | −647.2 |
| Amount of revision | −2.6 | −2.2 | −1.5 | −2.7 | 3.6 | 11.5 | 8.1 | 31.1 |
| Balance on goods and services (line 102): | ||||||||
| Revised | −446.9 | −484.0 | −491.4 | −481.5 | −512.7 | −581.0 | −576.3 | −676.7 |
| Previously published | −446.8 | −484.1 | −491.3 | −481.2 | −513.8 | −579.9 | −576.9 | −681.7 |
| Amount of revision | (*) | 0.2 | −0.2 | −0.3 | 1.1 | −1.0 | 0.5 | 5.0 |
| Balance on primary income (line 105): | ||||||||
| Revised | 195.5 | 200.3 | 185.4 | 197.0 | 259.5 | 259.1 | 231.9 | 188.5 |
| Previously published | 195.5 | 200.3 | 185.4 | 197.0 | 257.8 | 251.2 | 236.3 | 181.6 |
| Amount of revision | 0.0 | 0.0 | 0.0 | 0.0 | 1.8 | 8.0 | −4.4 | 6.9 |
| Balance on secondary income (line 106): | ||||||||
| Revised | −88.1 | −86.3 | −102.8 | −113.1 | −108.5 | −116.4 | −127.7 | −127.9 |
| Previously published | −85.5 | −84.0 | −101.5 | −110.7 | −109.3 | −120.9 | −139.7 | −147.1 |
| Amount of revision | −2.6 | −2.4 | −1.4 | −2.4 | 0.8 | 4.5 | 12.0 | 19.2 |
| Balance on capital account (line 107): | ||||||||
| Revised | −6.6 | −6.5 | −7.9 | −6.6 | 12.4 | −4.3 | −6.4 | −5.5 |
| Previously published | −6.6 | −6.5 | −7.9 | −6.6 | 12.4 | −4.2 | −6.2 | −6.0 |
| Amount of revision | 0.0 | 0.0 | 0.0 | 0.0 | 0.0 | −0.1 | −0.2 | 0.5 |
| Net lending (+) or net borrowing (−) from financial-account transactions (line 109): | ||||||||
| Revised | −400.1 | −297.1 | −333.1 | −363.6 | −344.6 | −348.4 | −480.4 | −653.0 |
| Previously published | −400.1 | −297.1 | −333.1 | −363.6 | −334.1 | −419.7 | −395.5 | −743.6 |
| Amount of revision | 0.0 | 0.0 | 0.0 | 0.0 | −10.5 | 71.4 | −84.8 | 90.6 |
| Statistical discrepancy (line 100): | ||||||||
| Revised | −54.1 | 79.4 | 83.7 | 40.5 | 4.7 | 94.1 | −1.8 | −31.4 |
| Previously published | −56.7 | 77.3 | 82.2 | 37.8 | 18.8 | 34.2 | 90.9 | −90.3 |
| Amount of revision | 2.6 | 2.2 | 1.5 | 2.7 | −14.1 | 60.0 | −92.7 | 58.9 |
- (*)
- Transactions between +/− $50,000,000.
Note. Line numbers refer to ITA table 1.2 on BEA's website.

[Click chart to expand]

[Click chart to expand]
Results from the 2017 Benchmark Survey of Foreign Direct Investment in the United States
BEA collects information on direct investment and trade in services through mandatory surveys of U.S. companies. In addition to quarterly and annual surveys, which collect information from a sample of companies whose transactions are covered in the ITAs, BEA also conducts benchmark surveys every 5 years to collect information from the entire population—or universe—of these companies.2 BEA extrapolates data from benchmark surveys for companies that are not required to report on the sample surveys using trends in the data of companies that report on the sample surveys. Therefore, statistical coverage is complete whether the periods are covered by benchmark surveys or only sample surveys.
Direct investment and related income receipts and payments for 2017–2020 were revised to incorporate the results of BEA's 2017 Benchmark Survey of Foreign Direct Investment in the United States. This survey collected data on the finances and operations of U.S. affiliates of foreign multinational enterprises.3 Estimates for 2017–2020 income and transactions for U.S. affiliates that are not required to file the quarterly survey were previously extrapolated from the 2012 benchmark survey and have been replaced with estimates that are extrapolated from the 2017 benchmark survey.
Results from the 2018 Benchmark Survey of Insurance Transactions by U.S. Insurance Companies with Foreign Persons
Insurance services exports and imports, and insurance-related transfers in secondary income receipts and payments, for 2013–2020 were revised to incorporate the results of BEA's 2018 Benchmark Survey of Insurance Transactions by U.S. Insurance Companies with Foreign Persons. This survey covered all U.S. insurance companies that engaged in reinsurance transactions with foreign persons; that earned premiums from, or incurred losses to, foreign persons in the capacity of primary insurers; or that had receipts or payments for international auxiliary insurance services.4 Estimates for 2013–2020 insurance services exports and imports, and insurance-related transfer receipts and payments, which were previously extrapolated from the 2013 benchmark survey, have been replaced with estimates that are extrapolated from the 2018 benchmark survey.
Improved coverage of aircraft imports
BEA's statistics on goods trade are based primarily on data that are collected by U.S. Customs and Border Protection (CBP) and compiled by the Census Bureau. These data generally reflect the movement of goods across the U.S. border. BEA applies adjustments to the data to align them with the coverage, valuation, definitions, and concepts used for the International Economic Accounts and the National Economic Accounts.
With the release of the third-quarter 2020 ITAs, BEA introduced a new coverage adjustment to record deliveries of foreign-manufactured aircraft to U.S. air carriers at foreign airports. Because these aircraft did not cross the U.S. border, they were not reported on CBP import declarations. However, according to international guidelines, they should be recorded in goods imports in the ITAs because a change in ownership between a U.S. resident and a nonresident has occurred. With this annual update, BEA extended this adjustment to the first quarter of 2020 to record additional deliveries at foreign ports. BEA has found no evidence of aircraft deliveries at foreign ports prior to 2020.
Improved estimates to include remote learning
Personal, cultural, and recreational services exports and imports were revised for the third and fourth quarters of 2020 based on the IIE's Fall 2020 International Students Enrollment Snapshot to account for the COVID-19 pandemic's effect on students, their global mobility, and remote education. The snapshot provides information from U.S. higher education institutions on international students studying in person or online, whether in the United States or abroad, for the 2020–2021 academic year. BEA used this information to estimate the tuition expenditures of foreign students studying remotely at U.S. higher education institutions from abroad and U.S. students studying remotely at foreign institutions from the United States. These expenditures are included in other personal, cultural, and recreational services. Although the report does not include information on the share of U.S. students studying remotely at foreign institutions, BEA assumed a similar share as the foreign students studying at U.S. institutions. Tuition and living expenses of international students that study in person, or remotely from the country of the institution, are included in education-related travel.
Current-account highlights
Current-account statistics were updated to incorporate newly available and revised source data for 2013–2020 and updated seasonal factors, which only affected quarterly statistics, for 2016–2020 (table B). Revisions to the current-account deficit for 2013–2020 did not alter its direction of change (increase or decrease) for any year. The current-account deficit was revised up for 2013–2016 and revised down for 2017–2020. The revisions to the quarterly statistics did not affect the direction (increase or decrease) of the quarter-to-quarter changes in the current-account deficit for 2013–2020, with one exception: for the second quarter of 2019, a $1.1 billion increase in the deficit was revised to a decrease of $3.2 billion (chart 3). For most quarters, the revisions also did not significantly affect the magnitude of the quarter-to-quarter changes in the current-account deficit. The largest revision to the quarter-to-quarter change was for the second quarter of 2020; the previously published $48.7 billion increase in the deficit was revised down $9.6 billion to a $39.1 billion increase.
Goods and services. The deficit on goods and services was revised up for 2013, 2015, 2016, and 2018 and revised down for 2014, 2017, 2019, and 2020. The largest revision was a downward revision of $5.0 billion for 2020. The revised statistics show the same trend as the previously published statistics.
The deficit on goods was revised down for 2018 and 2019 and revised up for 2020. The largest revision was an upward revision of $6.5 billion for 2020. The revisions to exports and imports of goods primarily reflect revised source data from the Census Bureau.
The surplus on services was revised down for 2013, 2015, 2016, 2018, and 2019 and revised up for 2014, 2017, and 2020. The largest revision was an upward revision of $11.5 billion for 2020. The revisions to exports and imports of services primarily reflect newly available and revised source data from BEA's surveys of international services, including the results of the 2018 Benchmark Survey of Insurance Transactions by U.S. Insurance Companies with Foreign Persons, newly available data on foreign students in the United States from U.S. Immigration and Customs Enforcement, and newly available data on U.S. purchases of tickets from foreign air carriers from the Airlines Reporting Corporation.
Primary income. The surplus on primary income was revised down for 2019 and revised up for 2017, 2018, and 2020. The largest revision was an upward revision of $8.0 billion for 2018. The revisions to primary income receipts and payments primarily reflect newly available and revised source data from BEA's 2017 Benchmark Survey of Foreign Direct Investment in the United States, BEA's quarterly and annual direct investment surveys, and the TIC surveys.5
Secondary income. The deficit on secondary income (current transfers) was revised up for 2013–2016 and revised down for 2017–2020. The largest revisions were downward revisions of $12.0 billion for 2019 and $19.2 billion for 2020. The revisions to secondary income primarily reflect revisions from incorporating the results of BEA's 2018 Benchmark Survey of Insurance Transactions by U.S. Insurance Companies with Foreign Persons and the TIC surveys.
| Selected current-account transactions | 2013 | 2014 | 2015 | 2016 | 2017 | 2018 | 2019 | 2020 |
|---|---|---|---|---|---|---|---|---|
| Exports of goods and services and income receipts (line 1): | ||||||||
| Revised | 3,250.5 | 3,379.1 | 3,238.0 | 3,237.3 | 3,548.3 | 3,793.6 | 3,812.5 | 3,258.6 |
| Previously published | 3,250.8 | 3,379.1 | 3,236.3 | 3,235.4 | 3,542.0 | 3,792.9 | 3,805.9 | 3,227.6 |
| Amount of revision | −0.3 | (*) | 1.7 | 1.8 | 6.3 | 0.8 | 6.5 | 31.0 |
| Exports of goods (line 3): | ||||||||
| Revised | 1,593.7 | 1,635.6 | 1,511.4 | 1,457.4 | 1,557.0 | 1,676.9 | 1,652.1 | 1,428.8 |
| Previously published | 1,593.7 | 1,635.6 | 1,511.4 | 1,457.4 | 1,557.0 | 1,677.0 | 1,652.4 | 1,435.1 |
| Amount of revision | 0.0 | 0.0 | 0.0 | 0.0 | 0.0 | (*) | −0.4 | −6.3 |
| Exports of services (line 13): | ||||||||
| Revised | 719.4 | 757.1 | 768.7 | 780.9 | 833.8 | 861.7 | 876.3 | 705.6 |
| Previously published | 719.5 | 756.7 | 768.4 | 780.5 | 830.4 | 862.4 | 875.8 | 692.1 |
| Amount of revision | −0.1 | 0.3 | 0.3 | 0.4 | 3.4 | −0.7 | 0.5 | 13.5 |
| Insurance services | −0.1 | 0.3 | 0.3 | 0.4 | 0.8 | 1.2 | 2.3 | 3.8 |
| Travel (for all purposes including education) | 0.0 | 0.0 | 0.0 | 0.0 | 2.6 | 4.3 | 6.0 | 1.1 |
| Personal, cultural, and recreational services | 0.0 | 0.0 | 0.0 | 0.0 | 0.0 | −1.0 | −1.2 | 2.8 |
| Other services | 0.0 | 0.0 | 0.0 | 0.0 | 0.0 | −5.1 | −6.7 | 5.9 |
| Primary income receipts (line 23): | ||||||||
| Revised | 811.6 | 845.9 | 825.1 | 857.8 | 997.0 | 1,106.4 | 1,124.9 | 957.9 |
| Previously published | 811.6 | 845.9 | 825.1 | 857.8 | 997.5 | 1,108.5 | 1,135.7 | 958.3 |
| Amount of revision | 0.0 | 0.0 | 0.0 | 0.0 | −0.5 | −2.1 | −10.8 | −0.5 |
| Direct investment income | 0.0 | 0.0 | 0.0 | 0.0 | 0.2 | −2.6 | −9.0 | 1.0 |
| Other primary income | 0.0 | 0.0 | 0.0 | 0.0 | −0.7 | 0.5 | −1.8 | −1.4 |
| Secondary income receipts (line 30): | ||||||||
| Revised | 125.8 | 140.6 | 132.9 | 141.1 | 160.5 | 148.6 | 159.2 | 166.3 |
| Previously published | 126.0 | 140.9 | 131.5 | 139.7 | 157.1 | 145.0 | 142.0 | 142.0 |
| Amount of revision | −0.2 | −0.3 | 1.4 | 1.4 | 3.4 | 3.6 | 17.2 | 24.3 |
| Insurance-related transfers | −0.2 | −0.3 | 1.4 | 1.4 | 3.0 | 4.1 | 16.9 | 25.0 |
| Other secondary income | 0.0 | 0.0 | 0.0 | 0.0 | 0.4 | −0.5 | 0.2 | −0.7 |
| Imports of goods and services and income payments (line 31): | ||||||||
| Revised | 3,589.9 | 3,749.1 | 3,646.9 | 3,634.9 | 3,910.1 | 4,231.9 | 4,284.6 | 3,874.7 |
| Previously published | 3,587.6 | 3,746.9 | 3,643.7 | 3,630.3 | 3,907.3 | 4,242.6 | 4,286.2 | 3,874.8 |
| Amount of revision | 2.3 | 2.2 | 3.2 | 4.6 | 2.8 | −10.7 | −1.6 | −0.1 |
| Imports of goods (line 33): | ||||||||
| Revised | 2,294.2 | 2,385.5 | 2,273.2 | 2,207.2 | 2,356.3 | 2,555.7 | 2,513.6 | 2,350.8 |
| Previously published | 2,294.2 | 2,385.5 | 2,273.2 | 2,207.2 | 2,356.3 | 2,557.3 | 2,516.8 | 2,350.7 |
| Amount of revision | 0.0 | 0.0 | 0.0 | 0.0 | 0.0 | −1.6 | −3.2 | 0.1 |
| Civilian aircraft | 0.0 | 0.0 | 0.0 | 0.0 | 0.0 | 0.0 | 0.0 | 0.1 |
| Other goods | 0.0 | 0.0 | 0.0 | 0.0 | 0.0 | −1.6 | −3.2 | (*) |
| Imports of services (line 42): | ||||||||
| Revised | 465.7 | 491.1 | 498.2 | 512.6 | 547.2 | 563.9 | 591.1 | 460.3 |
| Previously published | 465.8 | 490.9 | 497.8 | 511.9 | 544.8 | 562.1 | 588.4 | 458.3 |
| Amount of revision | −0.1 | 0.2 | 0.5 | 0.7 | 2.3 | 1.9 | 2.8 | 2.0 |
| Insurance services | −0.1 | 0.2 | 0.5 | 0.7 | 2.4 | 0.1 | 0.1 | −5.9 |
| Transport | 0.0 | 0.0 | 0.0 | 0.0 | 0.0 | 4.1 | 5.3 | 0.8 |
| Personal, cultural, and recreational services | 0.0 | 0.0 | 0.0 | 0.0 | 0.0 | −0.4 | −0.7 | −1.0 |
| Other services | 0.0 | 0.0 | 0.0 | 0.0 | 0.0 | −2.0 | −2.0 | 8.2 |
| Primary income payments (line 52): | ||||||||
| Revised | 616.0 | 645.6 | 639.7 | 660.8 | 737.5 | 847.3 | 893.0 | 769.4 |
| Previously published | 616.0 | 645.6 | 639.7 | 660.8 | 739.7 | 857.3 | 899.3 | 776.7 |
| Amount of revision | 0.0 | 0.0 | 0.0 | 0.0 | −2.2 | −10.0 | −6.3 | −7.3 |
| Direct investment income | 0.0 | 0.0 | 0.0 | 0.0 | −1.3 | −10.1 | −15.9 | −0.2 |
| Other primary income | 0.0 | 0.0 | 0.0 | 0.0 | −1.0 | 0.1 | 9.6 | −7.2 |
| Secondary income payments (line 58): | ||||||||
| Revised | 213.9 | 226.9 | 235.7 | 254.2 | 269.0 | 265.0 | 286.9 | 294.2 |
| Previously published | 211.5 | 224.9 | 233.0 | 250.4 | 266.4 | 265.9 | 281.7 | 289.1 |
| Amount of revision | 2.4 | 2.0 | 2.7 | 3.8 | 2.7 | −0.9 | 5.2 | 5.1 |
| Insurance-related transfers | 2.4 | 2.0 | 2.7 | 3.8 | 1.5 | −0.9 | 4.9 | 1.1 |
| Transfers to foreign students | 0.0 | 0.0 | 0.0 | 0.0 | 0.4 | 0.8 | 0.7 | 0.6 |
| Other secondary income | 0.0 | 0.0 | 0.0 | 0.0 | 0.7 | −0.8 | −0.5 | 3.3 |
- (*)
- Transactions between +/− $50,000,000.
Note. Line numbers refer to ITA table 1.2 on BEA's website.

[Click chart to expand]
[Click chart to expand]
Financial-account transactions highlights
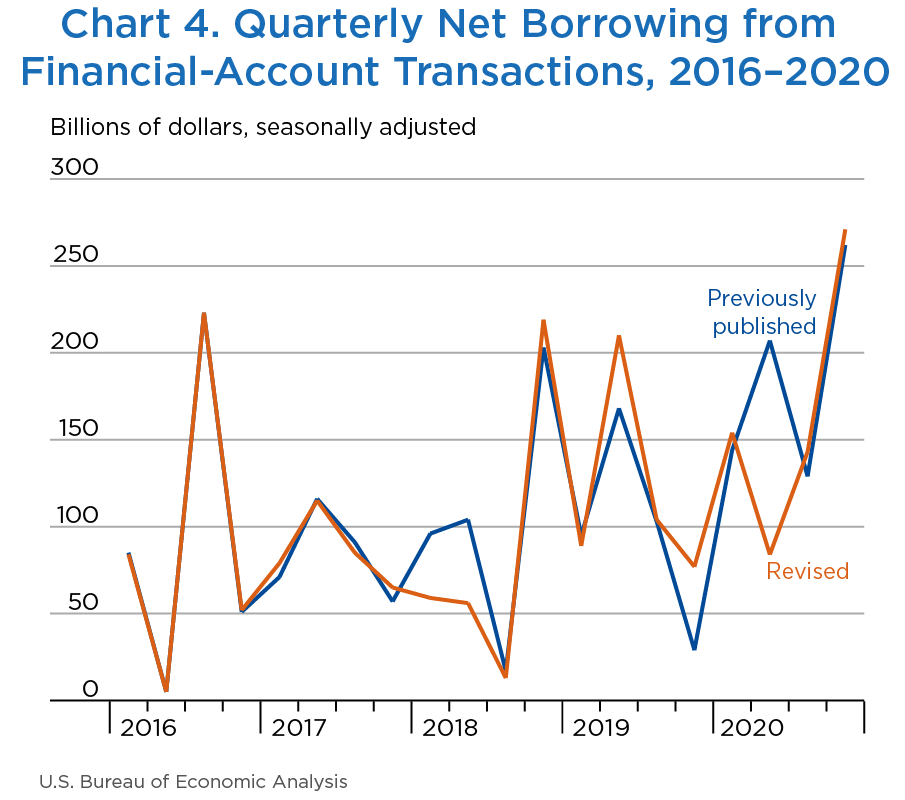
Financial-account statistics for 2017–2020 were updated to incorporate newly available and revised source data and updated seasonal factors. The largest revisions to net borrowing from financial-account transactions were a downward revision of $90.6 billion for 2020 and an upward revision of $84.8 billion for 2019 (table C).
Revisions to net borrowing reflect the combined revisions to net U.S. acquisition of financial assets excluding financial derivatives, to net U.S. incurrence of liabilities excluding financial derivatives, and to net transactions in financial derivatives. The revised annual financial transactions for each of these major accounts are similar in size to the previously published financial transactions. The revised quarterly financial transactions are mostly similar in size to the previously published financial transactions, with notable exceptions in the first and second quarters of 2018, the fourth quarter of 2019, and the second quarter of 2020 (chart 4).
| Selected financial-account transactions | 2017 | 2018 | 2019 | 2020 |
|---|---|---|---|---|
| Net U.S. acquisition of financial assets excluding financial derivatives (net increase in assets/financial outflow (+)) (line 61): | ||||
| Revised | 1,190.6 | 383.8 | 317.0 | 809.3 |
| Previously published | 1,188.2 | 359.0 | 440.8 | 763.5 |
| Amount of revision | 2.4 | 24.8 | −123.7 | 45.8 |
| Direct investment assets (line 62): | ||||
| Revised | 409.4 | −130.0 | 122.2 | 311.7 |
| Previously published | 405.4 | −151.3 | 188.5 | 153.3 |
| Amount of revision | 4.0 | 21.3 | −66.3 | 158.4 |
| Portfolio investment assets (line 65): | ||||
| Revised | 569.4 | 335.3 | −13.5 | 220.0 |
| Previously published | 569.4 | 335.3 | 46.6 | 350.2 |
| Amount of revision | (*) | 0.0 | −60.0 | −130.2 |
| Equity and investment fund shares (line 66): | ||||
| Revised | 139.9 | 171.3 | −163.4 | 241.8 |
| Previously published | 139.9 | 171.3 | −191.3 | 299.7 |
| Amount of revision | 0.0 | 0.0 | 27.9 | −57.9 |
| Debt securities | ||||
| Short term (line 68): | ||||
| Revised | 191.7 | 14.3 | 135.6 | −53.8 |
| Previously published | 191.7 | 14.3 | 167.6 | 3.9 |
| Amount of revision | (*) | 0.0 | −32.0 | −57.7 |
| Long term (line 69): | ||||
| Revised | 237.8 | 149.7 | 14.3 | 32.0 |
| Previously published | 237.8 | 149.7 | 70.3 | 46.6 |
| Amount of revision | 0.0 | 0.0 | −56.0 | −14.6 |
| Other investment assets (line 70): | ||||
| Revised | 213.5 | 173.6 | 203.6 | 268.6 |
| Previously published | 215.1 | 170.0 | 201.1 | 251.0 |
| Amount of revision | −1.6 | 3.6 | 2.6 | 17.6 |
| Currency and deposits (line 71): | ||||
| Revised | 170.9 | 106.1 | 132.4 | 92.9 |
| Previously published | 173.4 | 106.1 | 132.6 | 51.8 |
| Amount of revision | −2.5 | (*) | −0.2 | 41.1 |
| Loans (line 72): | ||||
| Revised | 35.7 | 64.9 | 68.7 | 182.2 |
| Previously published | 34.8 | 61.4 | 66.1 | 200.6 |
| Amount of revision | 0.9 | 3.5 | 2.6 | −18.4 |
| Net U.S. incurrence of liabilities excluding financial derivatives (net increase in liabilities/financial inflow (+)) (line 84): | ||||
| Revised | 1,559.2 | 711.8 | 755.7 | 1,456.5 |
| Previously published | 1,546.3 | 758.3 | 798.0 | 1,503.7 |
| Amount of revision | 12.9 | −46.5 | −42.2 | −47.2 |
| Direct investment liabilities (line 85): | ||||
| Revised | 380.8 | 214.3 | 302.2 | 211.3 |
| Previously published | 367.0 | 261.5 | 351.6 | 212.4 |
| Amount of revision | 13.8 | −47.2 | −49.4 | −1.1 |
| Portfolio investment liabilities (line 88): | ||||
| Revised | 790.8 | 303.1 | 177.2 | 710.2 |
| Previously published | 790.8 | 303.1 | 180.0 | 760.0 |
| Amount of revision | (*) | 0.0 | −2.8 | −49.8 |
| Equity and investment fund shares (line 89): | ||||
| Revised | 149.6 | 156.9 | −244.1 | 648.4 |
| Previously published | 149.6 | 156.9 | −244.1 | 725.7 |
| Amount of revision | 0.0 | 0.0 | (*) | −77.3 |
| Debt securities | ||||
| Short term (line 91): | ||||
| Revised | 11.9 | 30.4 | −33.1 | 272.5 |
| Previously published | 11.8 | 30.5 | −43.2 | 267.3 |
| Amount of revision | 0.1 | −0.1 | 10.0 | 5.1 |
| Long term (line 92): | ||||
| Revised | 629.3 | 115.8 | 454.4 | −210.7 |
| Previously published | 629.3 | 115.7 | 467.2 | −233.1 |
| Amount of revision | −0.1 | 0.1 | −12.8 | 22.4 |
| Other investment liabilities (line 93): | ||||
| Revised | 387.6 | 194.4 | 276.4 | 535.1 |
| Previously published | 388.5 | 193.7 | 266.4 | 531.4 |
| Amount of revision | −0.9 | 0.7 | 10.0 | 3.7 |
| Currency and deposits (line 94): | ||||
| Revised | 218.8 | 12.7 | 204.3 | 323.6 |
| Previously published | 217.7 | 12.8 | 204.1 | 323.9 |
| Amount of revision | 1.1 | −0.2 | 0.1 | −0.3 |
| Loans (line 95): | ||||
| Revised | 154.4 | 165.8 | 62.1 | 198.9 |
| Previously published | 156.4 | 165.0 | 52.4 | 193.4 |
| Amount of revision | −2.0 | 0.8 | 9.7 | 5.5 |
| Financial derivatives other than reserves, net transactions (line 99): | ||||
| Revised | 24.0 | −20.4 | −41.7 | −5.8 |
| Previously published | 24.0 | −20.4 | −38.3 | −3.3 |
| Amount of revision | 0.0 | 0.0 | −3.3 | −2.5 |
| Net lending (+) or net borrowing (−) from financial-account transactions (line 109): | ||||
| Revised | −344.6 | −348.4 | −480.4 | −653.0 |
| Previously published | −334.1 | −419.7 | −395.5 | −743.6 |
| Amount of revision | −10.5 | 71.4 | −84.8 | 90.6 |
- (*)
- Transactions between +/− $50,000,000.
Note. Line numbers refer to ITA table 1.2 on BEA's website.
Net U.S. acquisition of financial assets excluding financial derivatives
Net U.S. acquisition of financial assets excluding financial derivatives was revised down for 2019 and revised up for 2017, 2018, and 2020. The revisions reflect (1) an upward revision to net acquisition of direct investment assets for 2017, (2) a downward revision to net withdrawal of direct investment assets for 2018, (3) a downward revision to net acquisition of direct investment assets and a shift from net acquisition to net withdrawal of portfolio investment assets for 2019, and (4) upward revisions to net acquisitions of direct investment assets and other investment assets that were largely offset by a downward revision to net acquisition of portfolio investment assets for 2020.
Direct investment assets. Net acquisition of direct investment assets was revised up for 2017 and 2020 and revised down for 2019. Net withdrawal of direct investment assets was revised down for 2018. The largest revisions were a $158.4 billion upward revision to net acquisition for 2020 and a $66.3 billion downward revision for 2019. The revisions for 2017–2020 reflect newly available and revised source data from BEA's quarterly and annual direct investment surveys and the incorporation of the 2017 Benchmark Survey of Foreign Direct Investment in the United States.
Portfolio investment assets. Net acquisition of portfolio investment assets (equity and debt securities) was nearly unrevised for 2017, was unrevised for 2018, and was revised down for 2020. Transactions shifted to net withdrawal from net acquisition for 2019. The largest revisions were a $130.2 billion downward revision to net acquisition for 2020 and a $60.0 billion shift to net withdrawal from net acquisition for 2019. The revisions reflect newly available and revised source data from the TIC surveys of U.S. holdings of foreign securities.6
Other investment assets. Net acquisition of other investment assets (currency and deposits, loans, insurance technical reserves, and trade credit and advances) was revised down for 2017 and revised up for 2018–2020. The largest revision was a $17.6 billion upward revision for 2020. The revisions mainly reflect newly available and revised source data from the TIC surveys of U.S. claims on foreigners.
Net U.S. incurrence of liabilities excluding financial derivatives
Net U.S. incurrence of liabilities excluding financial derivatives was revised up for 2017 and revised down for 2018–2020. The revisions reflect (1) an upward revision to net incurrence of direct investment liabilities for 2017, (2) downward revisions to net incurrence of direct investment liabilities for 2018 and 2019, and (3) a downward revision to net incurrence of portfolio investment liabilities for 2020.
Direct investment liabilities. Net incurrence of direct investment liabilities was revised up for 2017 and revised down for 2018–2020. The largest revisions were a $47.2 billion downward revision for 2018 and a $49.4 billion downward revision for 2019. The revisions mainly reflect newly available and revised source data from BEA's quarterly and annual direct investment surveys and the incorporation of the 2017 Benchmark Survey of Foreign Direct Investment in the United States.
Portfolio investment liabilities. Net incurrence of portfolio investment liabilities was nearly unrevised for 2017, was unrevised for 2018, and was revised down for 2019 and 2020. The largest revision was a $49.8 billion downward revision for 2020. The revisions reflect newly available and revised source data from the TIC surveys of foreign holdings of U.S. securities.7
Other investment liabilities. Net incurrence of other investment liabilities was revised down for 2017 and revised up for 2018–2020. The largest revision was a $10.0 billion upward revision for 2018. The revisions reflect newly available and revised source data from the TIC surveys of U.S. liabilities to foreigners.8
Statistical discrepancy
The statistical discrepancy is the difference between net acquisition of assets and net incurrence of liabilities in the financial account (including financial derivatives) less the difference between total credits and total debits recorded in the current and capital accounts. In principle, the combined deficit (or surplus) on recorded transactions in the current and capital accounts should equal net borrowing (or net lending) measured by recorded transactions in the financial account. In practice, however, they differ because of incomplete source data, gaps in coverage, and timing differences.
Table A presents revisions to the statistical discrepancy for 2013–2020. The largest revisions to the statistical discrepancy were for 2018–2020.
| Quarters | Balance on goods and services | Balance on primary income | Balance on secondary income | ||||||
|---|---|---|---|---|---|---|---|---|---|
| Previously published | Revised | Revision | Previously published | Revised | Revision | Previously published | Revised | Revision | |
| 2013: I | −115,417 | −115,453 | −36 | 45,308 | 45,308 | 0 | −20,183 | −20,761 | −578 |
| II | −114,590 | −114,614 | −24 | 48,579 | 48,579 | 0 | −22,482 | −23,111 | −629 |
| III | −112,888 | −112,890 | −2 | 51,420 | 51,420 | 0 | −23,223 | −23,909 | −686 |
| IV | −103,934 | −103,904 | 30 | 50,213 | 50,213 | 0 | −19,657 | −20,334 | −677 |
| 2014: I | −120,543 | −120,492 | 51 | 50,664 | 50,664 | 0 | −20,340 | −21,070 | −730 |
| II | −122,263 | −122,205 | 58 | 48,387 | 48,387 | 0 | −12,675 | −13,335 | −660 |
| III | −117,593 | −117,542 | 51 | 54,283 | 54,283 | 0 | −25,361 | −25,912 | −551 |
| IV | −123,745 | −123,713 | 32 | 46,969 | 46,969 | 0 | −25,602 | −26,022 | −420 |
| 2015: I | −121,445 | −121,459 | −14 | 46,974 | 46,974 | 0 | −24,574 | −24,819 | −245 |
| II | −120,906 | −120,941 | −35 | 44,290 | 44,290 | 0 | −22,702 | −22,972 | −270 |
| III | −126,322 | −126,376 | −54 | 44,606 | 44,606 | 0 | −27,922 | −28,301 | −379 |
| IV | −122,588 | −122,647 | −59 | 49,505 | 49,505 | 0 | −26,271 | −26,751 | −480 |
| 2016: I | −119,793 | −120,528 | −735 | 44,770 | 45,073 | 303 | −28,227 | −28,778 | −551 |
| II | −118,566 | −119,150 | −584 | 45,803 | 45,352 | −451 | −26,216 | −26,875 | −659 |
| III | −117,645 | −117,806 | −161 | 46,817 | 46,354 | −463 | −28,103 | −28,676 | −573 |
| IV | −125,166 | −123,991 | 1,175 | 59,631 | 60,242 | 611 | −28,170 | −28,787 | −617 |
| 2017: I | −123,326 | −124,233 | −907 | 60,469 | 59,650 | −819 | −21,036 | −20,320 | 716 |
| II | −129,618 | −131,484 | −1,866 | 58,241 | 56,828 | −1,413 | −30,983 | −30,422 | 561 |
| III | −125,535 | −124,635 | 900 | 66,734 | 67,585 | 851 | −27,433 | −27,274 | 159 |
| IV | −135,311 | −132,388 | 2,923 | 72,349 | 75,482 | 3,133 | −29,820 | −30,495 | −675 |
| 2018: I | −138,855 | −140,186 | −1,331 | 70,187 | 70,374 | 187 | −27,918 | −27,457 | 461 |
| II | −130,230 | −131,162 | −932 | 64,494 | 66,417 | 1,923 | −29,678 | −28,839 | 839 |
| III | −152,406 | −151,023 | 1,383 | 56,638 | 59,131 | 2,493 | −29,473 | −27,982 | 1,491 |
| IV | −158,445 | −158,579 | −134 | 59,855 | 63,209 | 3,354 | −33,861 | −32,139 | 1,722 |
| 2019: I | −145,237 | −146,627 | −1,390 | 53,298 | 54,497 | 1,199 | −34,677 | −34,977 | −300 |
| II | −152,210 | −152,367 | −157 | 59,467 | 60,267 | 800 | −34,948 | −31,815 | 3,133 |
| III | −149,658 | −148,609 | 1,049 | 61,621 | 60,332 | −1,289 | −33,556 | −29,208 | 4,348 |
| IV | −129,759 | −128,737 | 1,022 | 61,958 | 56,823 | −5,135 | −36,524 | −31,725 | 4,799 |
| 2020: I | −129,630 | −134,248 | −4,618 | 52,152 | 51,464 | −688 | −37,083 | −32,004 | 5,079 |
| II | −160,687 | −158,549 | 2,138 | 33,342 | 34,524 | 1,182 | −35,903 | −29,841 | 6,062 |
| III | −191,398 | −187,101 | 4,297 | 48,218 | 48,257 | 39 | −37,737 | −33,519 | 4,218 |
| IV | −199,985 | −196,787 | 3,198 | 47,861 | 54,216 | 6,355 | −36,361 | −32,508 | 3,853 |
| Quarters | Balance on current account | Balance on capital account | Net lending (+) or net borrowing (−) from financial-account transactions |
||||||
|---|---|---|---|---|---|---|---|---|---|
| Previously published | Revised | Revision | Previously published | Revised | Revision | Previously published | Revised | Revision | |
| 2013: I | −90,293 | −90,907 | −614 | −1,671 | −1,671 | 0 | −47,936 | −47,936 | 0 |
| II | −88,493 | −89,146 | −653 | −1,882 | −1,882 | 0 | −35,979 | −35,979 | 0 |
| III | −84,691 | −85,379 | −688 | −1,462 | −1,462 | 0 | −141,903 | −141,903 | 0 |
| IV | −73,377 | −74,025 | −648 | −1,544 | −1,544 | 0 | −174,276 | −174,276 | 0 |
| 2014: I | −90,219 | −90,898 | −679 | −2,361 | −2,361 | 0 | −113,490 | −113,490 | 0 |
| II | −86,551 | −87,153 | −602 | −1,298 | −1,298 | 0 | −82,615 | −82,615 | 0 |
| III | −88,671 | −89,171 | −500 | −1,220 | −1,220 | 0 | −58,651 | −58,651 | 0 |
| IV | −102,378 | −102,766 | −388 | −1,655 | −1,655 | 0 | −42,320 | −42,320 | 0 |
| 2015: I | −99,045 | −99,304 | −259 | −2,999 | −2,999 | 0 | −124,436 | −124,436 | 0 |
| II | −99,318 | −99,622 | −304 | −1,266 | −1,266 | 0 | −137,039 | −137,039 | 0 |
| III | −109,638 | −110,070 | −432 | −2,184 | −2,184 | 0 | −36,886 | −36,886 | 0 |
| IV | −99,354 | −99,892 | −538 | −1,490 | −1,490 | 0 | −34,782 | −34,782 | 0 |
| 2016: I | −103,250 | −104,234 | −984 | −2,236 | −2,236 | 0 | −84,791 | −84,133 | 658 |
| II | −98,979 | −100,673 | −1,694 | −1,078 | −1,078 | 0 | −4,856 | −4,687 | 169 |
| III | −98,931 | −100,127 | −1,196 | −1,352 | −1,352 | 0 | −222,895 | −222,890 | 5 |
| IV | −93,705 | −92,536 | 1,169 | −1,940 | −1,940 | 0 | −51,090 | −51,922 | −832 |
| 2017: I | −83,894 | −84,903 | −1,009 | −2,116 | −2,116 | 0 | −70,674 | −79,387 | −8,713 |
| II | −102,359 | −105,077 | −2,718 | −1,999 | −1,999 | 0 | −115,623 | −114,592 | 1,031 |
| III | −86,234 | −84,324 | 1,910 | 18,213 | 18,213 | 0 | −90,608 | −85,388 | 5,220 |
| IV | −92,782 | −87,401 | 5,381 | −1,703 | −1,703 | 0 | −57,190 | −65,221 | −8,031 |
| 2018: I | −96,587 | −97,269 | −682 | −1,406 | −1,347 | 59 | −96,265 | −59,376 | 36,889 |
| II | −95,414 | −93,584 | 1,830 | −2,912 | −2,937 | −25 | −103,970 | −56,343 | 47,627 |
| III | −125,241 | −119,874 | 5,367 | −455 | −449 | 6 | −16,796 | −13,199 | 3,597 |
| IV | −132,452 | −127,508 | 4,944 | 576 | 472 | −104 | −202,693 | −219,448 | −16,755 |
| 2019: I | −126,616 | −127,106 | −490 | −2,542 | −2,732 | −190 | −95,175 | −89,292 | 5,883 |
| II | −127,691 | −123,915 | 3,776 | −848 | −865 | −17 | −167,903 | −209,551 | −41,648 |
| III | −121,594 | −117,485 | 4,109 | −835 | −899 | −64 | −103,125 | −104,132 | −1,007 |
| IV | −104,324 | −103,640 | 684 | −2,019 | −1,947 | 72 | −29,345 | −77,402 | −48,057 |
| 2020: I | −114,561 | −114,788 | −227 | −2,971 | −2,867 | 104 | −144,317 | −154,122 | −9,805 |
| II | −163,248 | −153,866 | 9,382 | −1,054 | −946 | 108 | −207,440 | −84,255 | 123,185 |
| III | −180,917 | −172,362 | 8,555 | −672 | −550 | 122 | −129,427 | −143,408 | −13,981 |
| IV | −188,484 | −175,079 | 13,405 | −1,333 | −1,124 | 209 | −262,383 | −271,199 | −8,816 |
- For a discussion of the revisions to the IIP Accounts, see Erin M. Whitaker, “U.S. Net International Investment Position: First Quarter 2021, Annual Update, and Year 2020 (Revised),” in this issue of the Survey of Current Business.
- For more information, see A Guide to BEA's Direct Investment Surveys and A Guide to BEA's Services Surveys on BEA's website.
- The benchmark survey data are also the source of BEA's statistics on the U.S. activities of foreign multinational enterprises for 2017. These statistics are available on BEA's website.
- Auxiliary insurance services include agents' commissions; insurance brokering and agency services; insurance consulting services; evaluation, loss adjustment expenses, and adjustment services; and regulatory and monitoring services on indemnities and recovery services.
- Statistics for portfolio investment income and for other investment income are based partly on resident-nonresident transactions and positions collected monthly and quarterly on the TIC surveys, as explained in U.S. International Economic Accounts: Concepts and Methods, chapter 13, paragraphs 13.28–13.48.
- Revised data from the following TIC surveys were incorporated: (1) Aggregate Holdings of Long-Term Securities by U.S. and Foreign Residents (foreign securities), (2) Report of U.S. Ownership of Foreign Securities, Including Selected Money Market Instruments, and (3) Reports by Financial Institutions of Liabilities to, and Claims on, Foreign Residents by U.S. Residents (claims).
- Revised data from the following TIC surveys were incorporated: (1) Aggregate Holdings of Long-Term Securities by U.S. and Foreign Residents (U.S. securities), (2) Foreign-Residents' Holdings of U.S. Securities, including Selected Money Market Instruments, and (3) Reports by Financial Institutions of Liabilities to, and Claims on, Foreign Residents by U.S. Residents (liabilities).
- Revised data from the following TIC surveys were incorporated: (1) Reports by Financial Institutions of Liabilities to, and Claims on, Foreign Residents by U.S. Residents (liabilities) and (2) Reports of Liabilities to, and Claims on, Unaffiliated Foreign Residents by U.S. Resident Non-Financial Institutions (liabilities).