
Territorial Economic Accounts for American Samoa, Guam, and the U.S. Virgin Islands
Estimates of GDP for 2020 and Estimates of GDP by Industry and Compensation by Industry for 20191
In 2020, the economies of the U.S. territories, like the U.S. states, were affected by the COVID–19 pandemic's impact on spending by consumers, visitors, businesses, and governments. The economic trends exhibited by American Samoa, Guam, and the U.S. Virgin Islands during 2020 reflect the unique structures of their economies, the influx of federal pandemic-related financial assistance, and the severity of the impact of the COVID–19 pandemic during 2020. Like the majority of U.S. states, Guam and the U.S. Virgin Islands saw declines in inflation-adjusted (or “real”) gross domestic product (GDP) (chart 1). In contrast, American Samoa real GDP increased.

[Click chart to expand]
- In American Samoa, real GDP increased 5.0 percent in 2020. The leading contributors to the increase in real GDP were territorial government spending and exports of goods and services (table 1).2
- In Guam, real GDP decreased 11.9 percent in 2020. The leading contributor to the decrease in real GDP was exports of goods and services (table 1).
- In the U.S. Virgin Islands, real GDP decreased 2.2 percent in 2020. The leading contributor to the decrease in real GDP was exports of goods and services (table 1).
| U.S. territory | Percent change in real GDP from preceding year (percent) | (percentage points) | ||||||
|---|---|---|---|---|---|---|---|---|
| Personal consumption expenditures | Private fixed investment | Change in private inventories | Government consumption expenditures and gross investment | Net exports of goods and services | ||||
| Federal | Territorial | Exports | Imports | |||||
| American Samoa | 5.0 | 3.74 | 2.20 | 3.62 | −0.06 | 6.26 | 6.10 | −16.82 |
| Guam | −11.9 | −2.81 | 1.27 | …….. | 2.51 | 1.77 | −16.17 | 1.57 |
| U.S. Virgin Islands | −2.2 | −3.40 | −6.66 | 8.61 | 0.83 | −2.31 | −8.93 | 9.71 |
Notes. The table shows the percent change of total real GDP and the contributions (in percentage points) of each major component to that change. For example, for American Samoa, personal consumption expenditures accounted for 3.74 percentage points of the 5.0 percent increase in real GDP in 2020. Imports are a subtraction item; thus, a decrease in imports results in a positive contribution to GDP. Change in private inventories is not estimated for Guam due to source data limitations.
Personal consumption expenditures
As in most U.S. states, real personal consumption expenditures (PCE) in Guam and the U.S. Virgin Islands declined in 2020 (chart 2). In contrast, real PCE for American Samoa increased. According to the World Health Organization, there were zero confirmed cases of COVID–19 in American Samoa in 2020, making it unique among U.S. jurisdictions.

[Click chart to expand]
Private fixed investment
In 2020, real private fixed investment (PFI) increased 31.1 percent in American Samoa and 6.1 percent in Guam. In contrast, real PFI decreased 27.7 percent in the U.S. Virgin Islands. Despite the substantial decrease in the U.S. Virgin Islands, real PFI remained at an elevated level, supported by capital improvement projects to resume oil refinery operations on St. Croix.
Chart 3 shows the annual volatility in PFI in the U.S. Virgin Islands as well as in the Commonwealth of the Northern Mariana Islands (CNMI). This volatility reflects a boom-bust cycle in industries that have played a dominant role in these economies over the last decade: oil refining in the U.S. Virgin Islands and casino gambling in the CNMI.

[Click chart to expand]
Government consumption expenditures and gross investment
In 2020, the ratio of government consumption expenditures and gross investment—or “government spending”—to GDP was higher in American Samoa, Guam, and the U.S. Virgin Islands than in the United States (chart 4). For American Samoa and the U.S. Virgin Islands, territorial government spending accounted for the majority of government spending. In contrast, in Guam, federal government accounts for a larger share due to a substantial U.S. military presence, including Andersen Air Force Base, Naval Base Guam, and Marine Corps Base Camp Blaz.3

[Click chart to expand]
In 2020, real government spending increased 13.0 percent in American Samoa and 7.9 percent in Guam, while it decreased 4.0 percent in the U.S. Virgin Islands. In all three territories, federal grant revenues, such as Coronavirus Relief Fund payments, supported territorial government spending (table 2). However, in the case of the U.S. Virgin Islands, spending in the prior year had been substantially elevated by federally funded expenditures for disaster response and recovery activities following the 2017 hurricanes; those activities decreased in 2020.
In Guam, the federal government was a notable source of growth in 2020 government spending as progress continued on multiple U.S. Department of Defense projects (table 1).
| U.S. territory | CRF | EIPs, as of July 29, 2020 |
|---|---|---|
| American Samoa | 35.2 | 30.8 |
| Guam | 118.0 | 150.2 |
| U.S. Virgin Islands | 74.8 | 67.8 |
Sources. CRF allocations to U.S. territories from the U.S. Treasury; the total EIP amount paid to residents of each territory as of July 29, 2020, from the Government Accountability Office (GAO) Report GAO-20-701.
Net exports of goods and services
Net exports equals the difference between a territory's exports and its imports. Exports measures the portion of total production of goods and services in a territory that is provided to the rest of the world (including other countries, the 50 states and the District of Columbia, and other U.S. territories); imports measures the portion of total expenditures in a territory that is accounted for by goods and services provided by the rest of the world.
Exports
In 2020, real exports decreased 74.1 percent in Guam and 17.7 percent in the U.S. Virgin Islands. The decreases largely reflected declines in exports of services, which consist primarily of spending by visitors, due to the effects of the COVID–19 pandemic. In Guam, visitor arrivals decreased 80.3 percent, according to data from the Guam Visitors Bureau. In the U.S. Virgin Islands, visitor arrivals decreased 58.5 percent, according to statistics from the U.S. Virgin Islands Bureau of Economic Research.
In American Samoa, real exports increased 10.3 percent in 2020. The majority of American Samoa's exports are goods (chart 5), specifically canned tuna and related products. Data from the U.S. Census Bureau U.S. Trade with Puerto Rico and U.S. Possessions reports show that the quantities of prepared or preserved fish shipped from American Samoa to the 50 states and the District of Columbia were 18 percent higher in 2020 compared with 2019.

[Click chart to expand]
Imports
The U.S. territories are relatively reliant on imports of goods for domestic use; although some have large manufacturing sectors, production is specialized and primarily for export. In 2020, the imports-of-goods-to-GDP ratio ranged from 87.6 percent for American Samoa to 41.1 percent for Guam, compared to 10.9 percent for the United States overall (chart 6).

[Click chart to expand]
Estimates of GDP by industry for 2019 were released at the same time for each territory as the 2020 GDP estimates described above. The following is a summary of the results by territory:
- In 2019 in American Samoa, real GDP declined by 0.6 percent. The decline was the result of a decline in the private sector that was partly offset by an increase in the public sector. Manufacturing value added decreased 3.4 percent. The government sector increased 2.0 percent, primarily reflecting increases in compensation of territorial government employees and operating surplus of territorial government enterprises.
- In 2019 in Guam, real GDP increased 2.5 percent. Growth in the private sector was widespread. The largest increase was in accommodation, food services, and amusements, which increased 9.1 percent, reflecting growth in visitor spending. The government sector declined 0.7 percent, primarily reflecting a decline in the operating surplus of territorial government enterprises.
- In 2019 in the U.S. Virgin Islands, real GDP increased 2.8 percent. Growth in the private sector was widespread. The largest increase was in accommodation and food services, which increased 14.4 percent, reflecting growth in visitor spending. Goods-producing industries increased 5.5 percent, reflecting an increase in construction activity. The government sector increased 2.5 percent, primarily reflecting increases in compensation for both federal and territorial government employees.
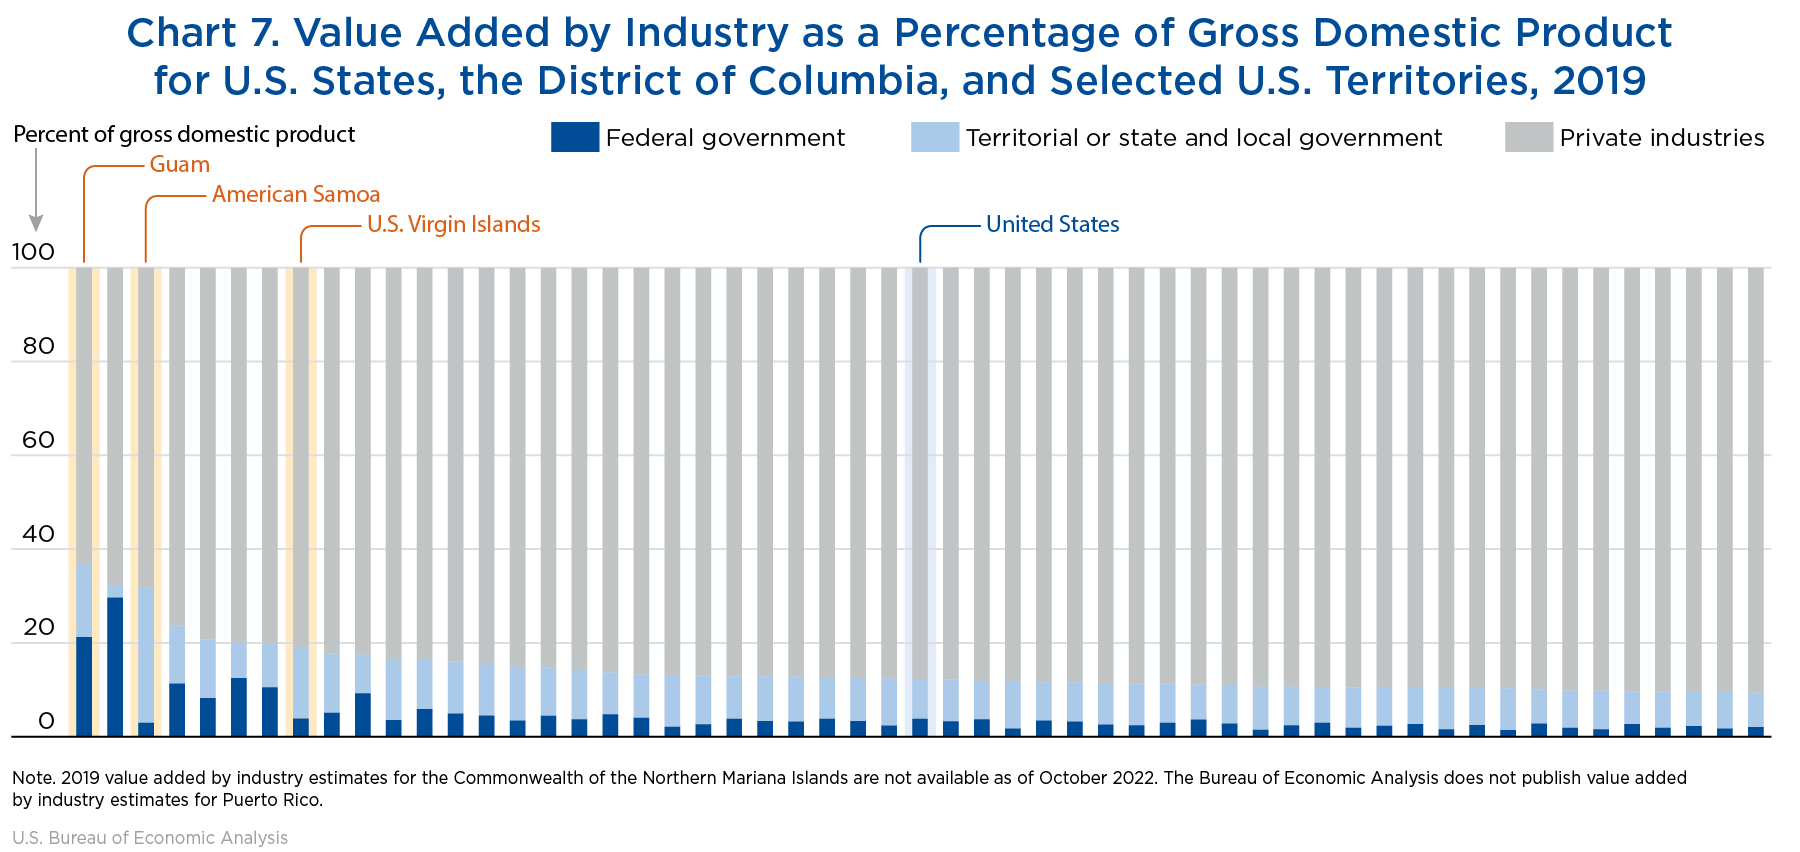
The differences in the industry detail shown within the private sector in the U.S. Bureau of Economic Analysis' (BEA's) territorial estimates result from variations in the availability and quality of industry-specific data for each territory. Although this limits comparisons of industries across territories and with other regions in the United States, it is possible to draw general conclusions about the relative importance of the government sector versus the private sector to the territorial economies. For example, the estimates show that compared to the United States, the government sector accounts for a relatively large share of the economic activity in American Samoa, Guam, and the U.S. Virgin Islands (chart 7). In 2019, the government sector share of GDP ranged from 19 percent for the U.S. Virgin Islands to 37 percent for Guam, compared to 12 percent for the United States overall.
[Click chart to expand]
Similarly, the importance of the government sector as an employer in American Samoa, Guam, and the U.S. Virgin Islands is reflected in the compensation by industry estimates. In 2019, the government sector accounted for 32 percent of total compensation in the U.S. Virgin Islands, 47 percent in Guam, and 58 percent in American Samoa (chart 8). In comparison, for the United States, the government sector accounted for 18 percent of total compensation.

[Click chart to expand]
In 2019, total compensation increased in American Samoa, Guam, and the U.S. Virgin Islands. In American Samoa, total compensation increased from $301 million to $309 million in 2019; the increase reflected growth in compensation for manufacturing industries and the territorial government sector. In Guam, total compensation increased from $3,379 million to $3,557 million in 2019; the largest contributor to the increase was the construction sector, which includes activities performed by private companies on behalf of the government sector. In the U.S. Virgin Islands, total compensation increased from $2,087 million to $2,592 million in 2019; the largest contributor to the increase was goods-producing industries, which includes the construction industry.
In 2020, the economies of the U.S. territories, like the U.S. states, were affected by the COVID–19 pandemic due to its impact on spending by consumers, visitors, businesses, and governments. In American Samoa, real GDP increased. In Guam and the U.S. Virgin Islands, real GDP decreased. Exports of goods and services were major contributors to the percent change in real GDP in 2020 for all three territories. For American Samoa, exports of goods, primarily of canned tuna and related products, contributed to the increase in real GDP. For Guam and the U.S. Virgin Islands, exports of services, primarily spending by visitors, contributed to the decreases in real GDP. For all three territories, government spending is a large component of GDP. In 2020, federal grant revenues, such as Coronavirus Relief Fund payments, supported territorial government spending in all three territories.
These estimates are produced for each territory primarily using data from the territorial governments.
GDP for American Samoa, the CNMI, Guam, and the U.S. Virgin Islands is estimated using the expenditures approach, that is, as the sum of goods and services sold to final users. This methodology is similar to that used to estimate national GDP; in contrast, GDP for each of the 50 states and the District of Columbia is produced using an income-based approach. Each territory is estimated separately as a stand-alone entity with the methodology tailored to the economic data available for that territory. See Summary of Methodologies: Gross Domestic Product for American Samoa, the Commonwealth of the Northern Mariana Islands, Guam, and the U.S. Virgin Islands on the BEA website for detailed methodological information.
Updates to GDP and related estimates for prior years
Much of the source data that BEA uses to prepare the territorial GDP estimates is drawn from administrative or survey data that, over time, will provide more comprehensive or relevant information. As improved source data become available, BEA will incorporate the information and will release updated estimates once a year. Approximately every 5 years, BEA conducts a “comprehensive” update, which incorporates the most complete source data available and introduces major methodological changes. These comprehensive updates may affect the territorial GDP estimates for all years. By following this process, BEA ensures the estimates are as timely, consistent, and accurate as possible, given the availability of the data sources.
Acknowledgments
BEA's territorial economic accounts for American Samoa, the Commonwealth of the Northern Mariana Islands, Guam, and the U.S. Virgin Islands are funded on an annual basis by the U.S. Department of the Interior Office of Insular Affairs.
BEA appreciates the data, information, and assistance provided by the following entities:
U.S. federal agencies
- Office of Insular Affairs, U.S. Department of the Interior
- Census Bureau, U.S. Department of Commerce
- Bureau of Labor Statistics, U.S. Department of Labor
- Energy Information Administration, U.S. Department of Energy
- Federal Emergency Management Agency, U.S. Department of Homeland Security
American Samoa
- American Samoa Office of the Governor
- American Samoa Department of Commerce
- American Samoa Department of Treasury
- American Samoa Tax Office, Department of Treasury
- American Samoa Customs, Department of Treasury
- American Samoa Budget Office
- American Samoa Telecommunications Authority
- American Samoa Power Authority
- LBJ Tropical Medical Center
- American Samoa Community College
- Office of Petroleum Management
Commonwealth of the Northern Mariana Islands (CNMI)
- CNMI Office of the Governor
- CNMI Department of Commerce
- CNMI Commonwealth Ports Authority
- Marianas Visitors Authority
- CNMI Department of Finance
- Northern Marianas College
- CNMI Public School System
- Commonwealth Utilities Corporation
- Commonwealth Healthcare Corporation
Guam
- Guam Office of the Governor
- Guam Bureau of Statistics and Plans
- Guam Department of Administration
- Guam Department of Revenue and Taxation
- Guam Bureau of Budget and Management Research
- Guam Economic Development Authority
- Guam Office of Public Accountability
- Guam Visitors Bureau
- Guam Department of Labor
- Guam Port Authority
U.S. Virgin Islands
- U.S. Virgin Islands Office of the Governor
- U.S. Virgin Islands Bureau of Economic Research
- U.S. Virgin Islands Bureau of Internal Revenue
- U.S. Virgin Islands Office of Management and Budget
- U.S. Virgin Islands Department of Finance
- U.S. Virgin Islands Bureau of Labor Statistics, Department of Labor
- U.S. Virgin Islands Department of Labor
- The publication of this article is funded by the Department of the Interior Office of Insular Affairs, which also funds the production of the territorial economic accounts for American Samoa, the Commonwealth of the Northern Mariana Islands (CNMI), Guam, and the U.S. Virgin Islands. For complete data tables for 2020 and other years, see the Bureau of Economic Analysis (BEA) website. At the time of publication, CNMI GDP for 2020 was not yet available due to extended delays in a key source of data on CNMI territorial government spending. (Based on prior year's data, CNMI territorial government spending is a critical component of CNMI GDP.) CNMI GDP statistics for prior years are included in select charts in this article for comparison purposes. BEA's Puerto Rico GDP is produced under a different funding source and data are included in select charts for comparison. BEA's Puerto Rico GDP estimates are available on the BEA website.
- 2020 GDP statistics for American Samoa were revised in the 2021 American Samoa GDP release published on September 1, 2022.
- Marine Corps Base Camp Blaz was activated in 2020.