
Activities of U.S. Multinational Enterprises in 2020
The U.S. Bureau of Economic Analysis (BEA) recently released statistics on the activities of U.S. multinational enterprises (MNEs) in 2020. These statistics provide a picture of the overall activities of U.S. parent companies and their foreign affiliates and contain a wide variety of indicators of their financial structure and operations. The statistics cover items that are needed to analyze the characteristics, performance, and economic impact of U.S. MNEs on the U.S. and foreign economies and are obtained from mandatory surveys of U.S. MNEs conducted by BEA.
The following charts present highlights of BEA U.S. MNE statistics for 2020. Much more detail, including additional data items, can be found on the BEA website.
[Click chart to expand]
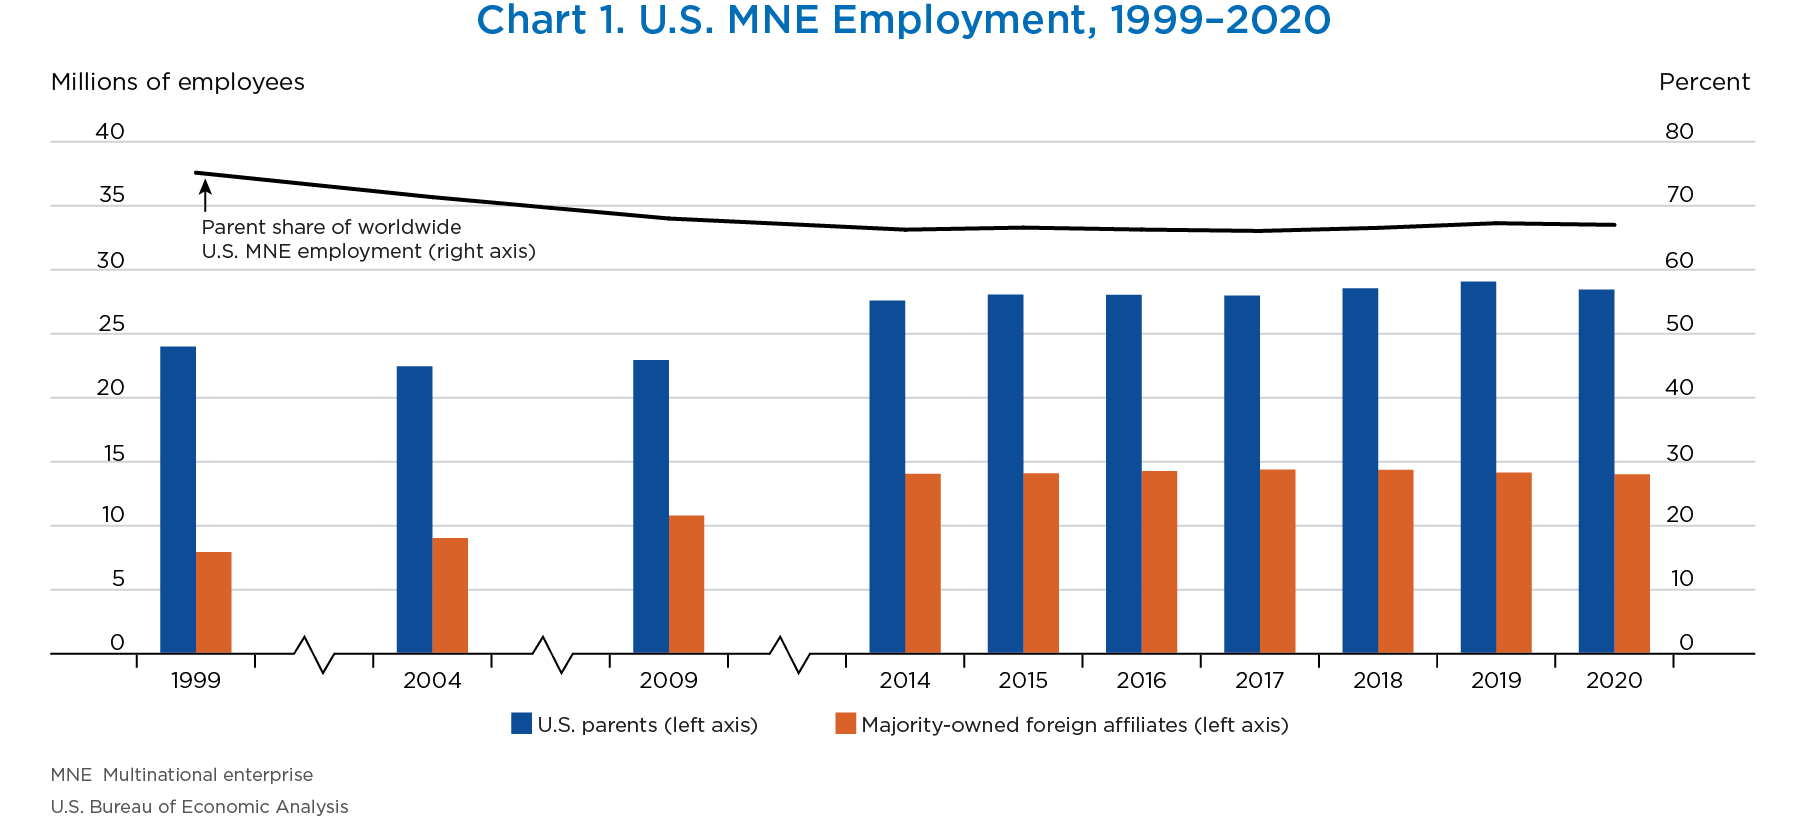
- Worldwide employment by U.S. MNEs decreased 1.8 percent to 42.4 million workers in 2020 from 43.2 million workers in 2019. Employment in the United States by U.S. parents decreased 2.2 percent to 28.4 million workers, while employment abroad by majority-owned foreign affiliates decreased 1.0 percent to 14.0 million workers.
- U.S. parent employment accounted for 67.0 percent of worldwide employment by U.S. MNEs, while MOFA employment accounted for 33.0 percent.
[Click chart to expand]
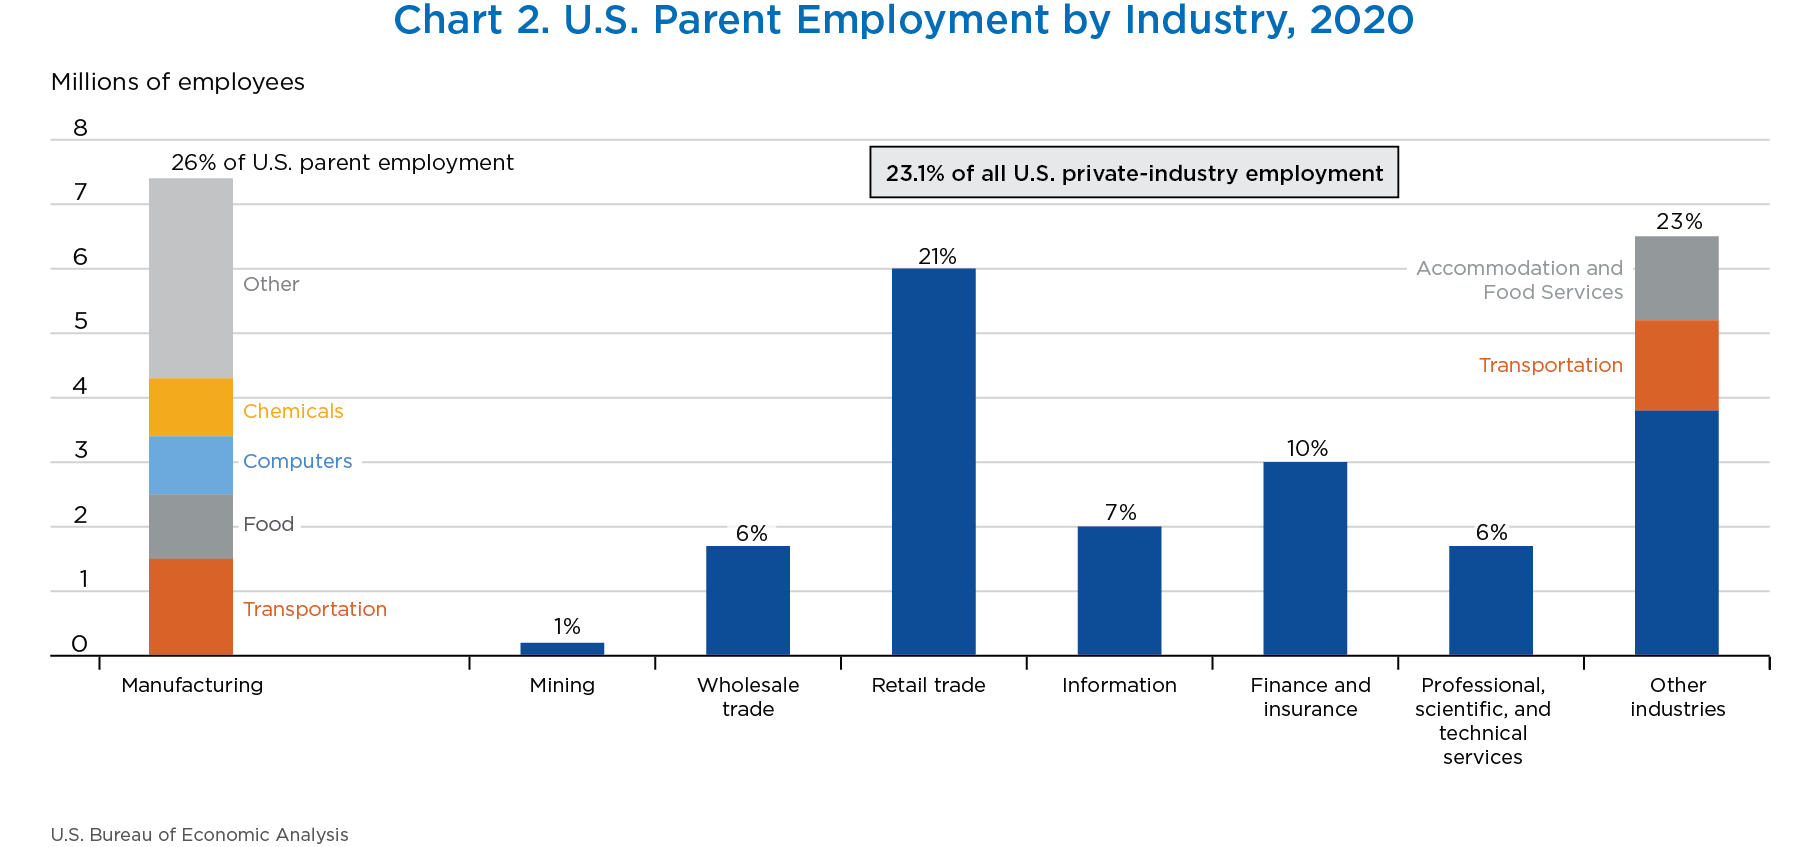
- U.S. parents accounted for 23.1 percent of all U.S. private-industry employment in 2020, up from 22.1 percent in 2019, as total private-industry employment fell more than U.S. parent employment.
- The manufacturing sector accounted for 26 percent of U.S. parent employment. Within manufacturing, transportation equipment employed the most workers, followed by food and computers and electronic products. Retail trade accounted for 21 percent of U.S. parent employment.
- Within other industries, transportation and warehousing, along with accommodation and food services, employed the most workers.
- Employment decreased in all major industry categories with the exception of retail trade and finance and insurance.
[Click chart to expand]
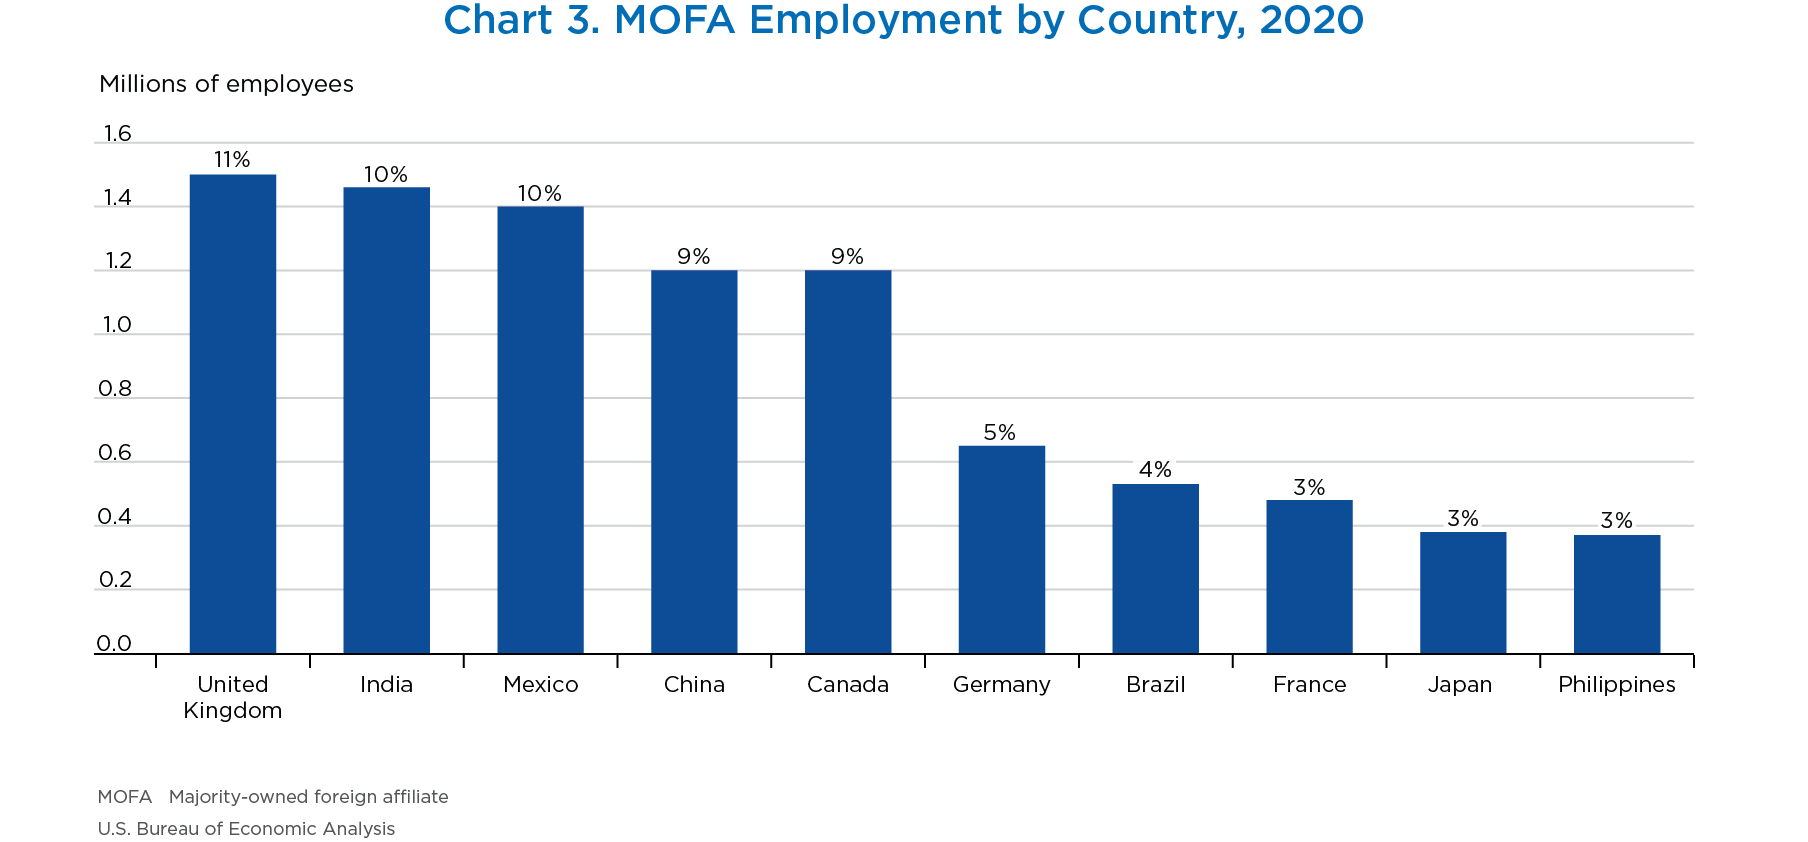
- The countries with the largest MOFA employment were the United Kingdom, India, Mexico, China, and Canada. Together, these five countries accounted for nearly half of all MOFA employment.
- In the United Kingdom, the largest industries were retail trade and manufacturing. In India, the largest industry was professional, scientific, and technical services, while manufacturing accounted for the largest share in Mexico.
[Click chart to expand]
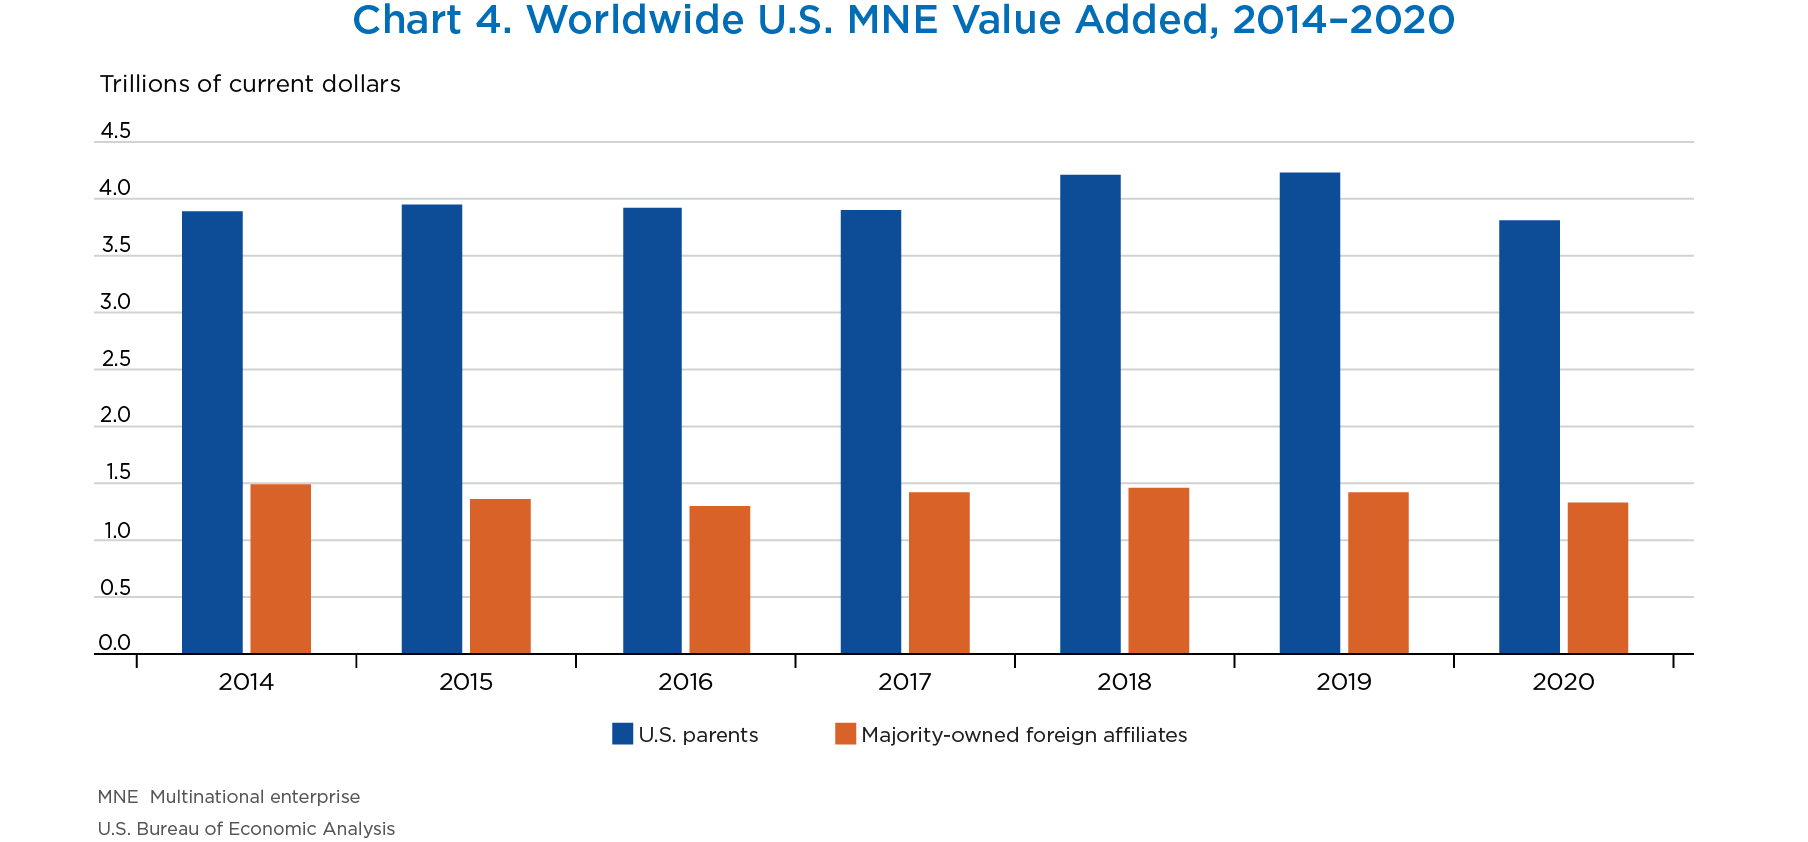
- Current-dollar value added of U.S. parents, a measure of their direct contribution to U.S. gross domestic product, decreased 9.9 percent to $3.8 trillion. The industry with the largest decrease was manufacturing.
- MOFA current-dollar value added decreased 6.4 percent to $1.3 trillion. The largest decrease was in the mining industry.
- U.S. parents accounted for 74 percent of worldwide value added by U.S. MNEs, while MOFAs accounted for the remaining 26 percent.

[Click chart to expand]
- U.S. parents accounted for 20.8 percent of all U.S. private-industry value added, down from 22.6 percent in 2019.
- The industry that accounted for the largest share of U.S. parent value added was manufacturing, accounting for 33 percent of the total.
- Other industries and information were second and third, respectively, with transportation and warehousing contributing the largest share within other industries.
[Click chart to expand]
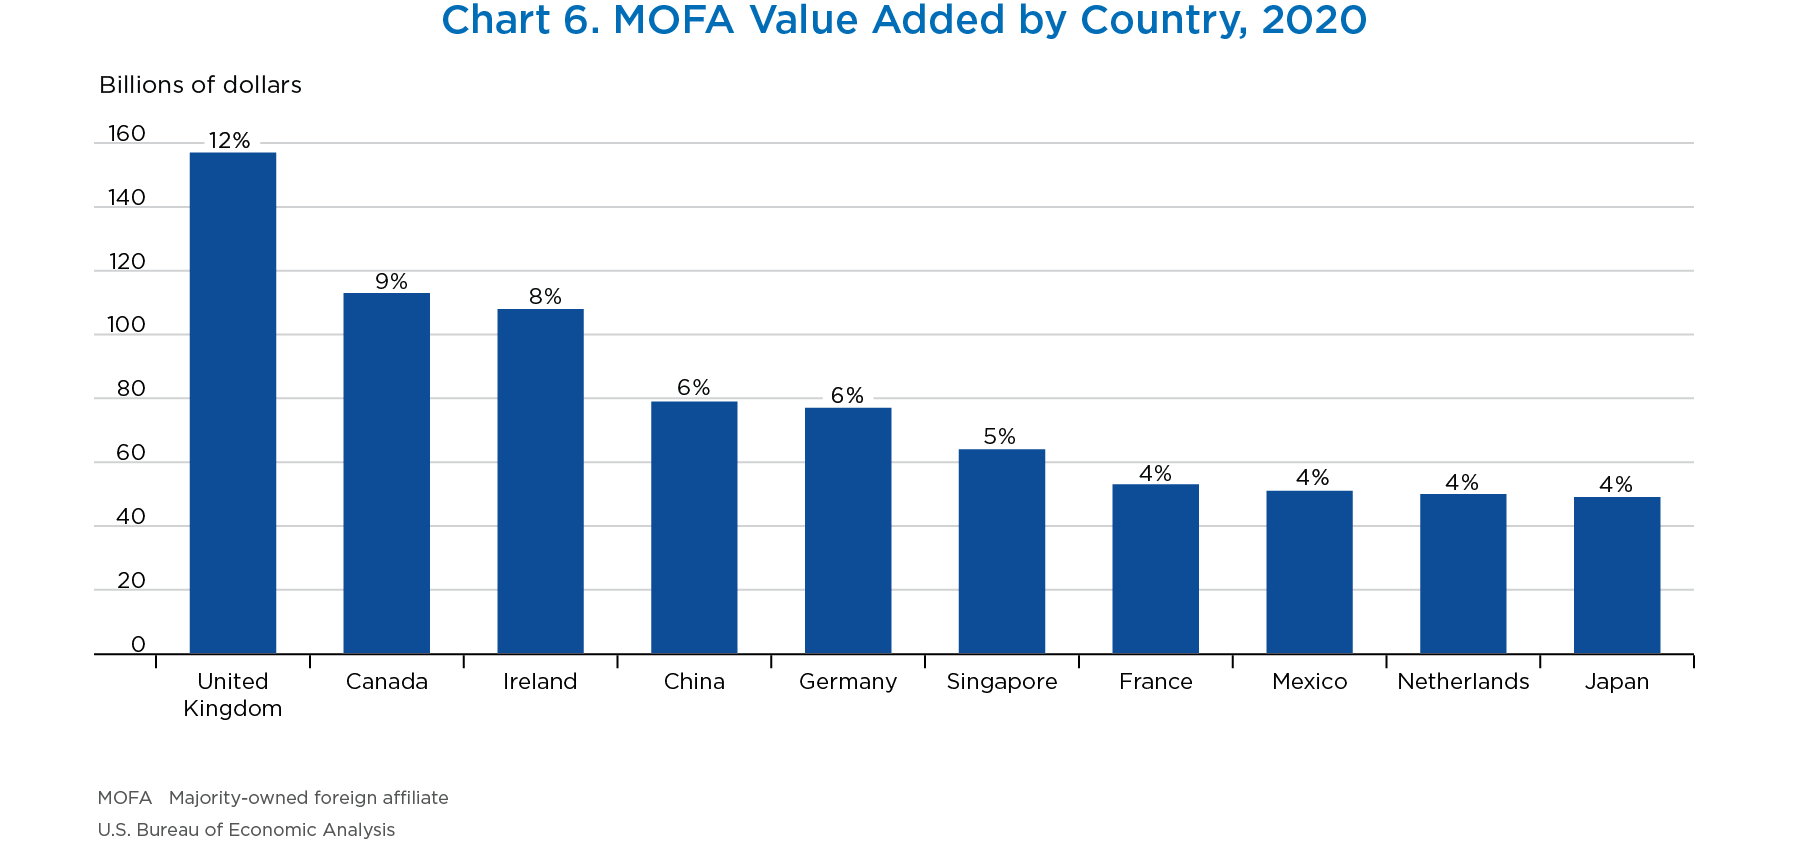
- The three countries with the largest MOFA value added were the United Kingdom, Canada, and Ireland. Together, these three countries accounted for 29 percent of global MOFA value added.
- Manufacturing was the largest industry contributor to value added within all three of these countries.

[Click chart to expand]
- U.S. parent expenditures for property, plant, and equipment (PP&E) decreased 10.8 percent to $652 billion. The largest decrease was in the mining industry.
- MOFA PP&E expenditures decreased to $181 billion.
- U.S. parents contributed 78 percent of worldwide PP&E expenditures by U.S. MNEs, while MOFAs contributed the remaining 22 percent.
[Click chart to expand]
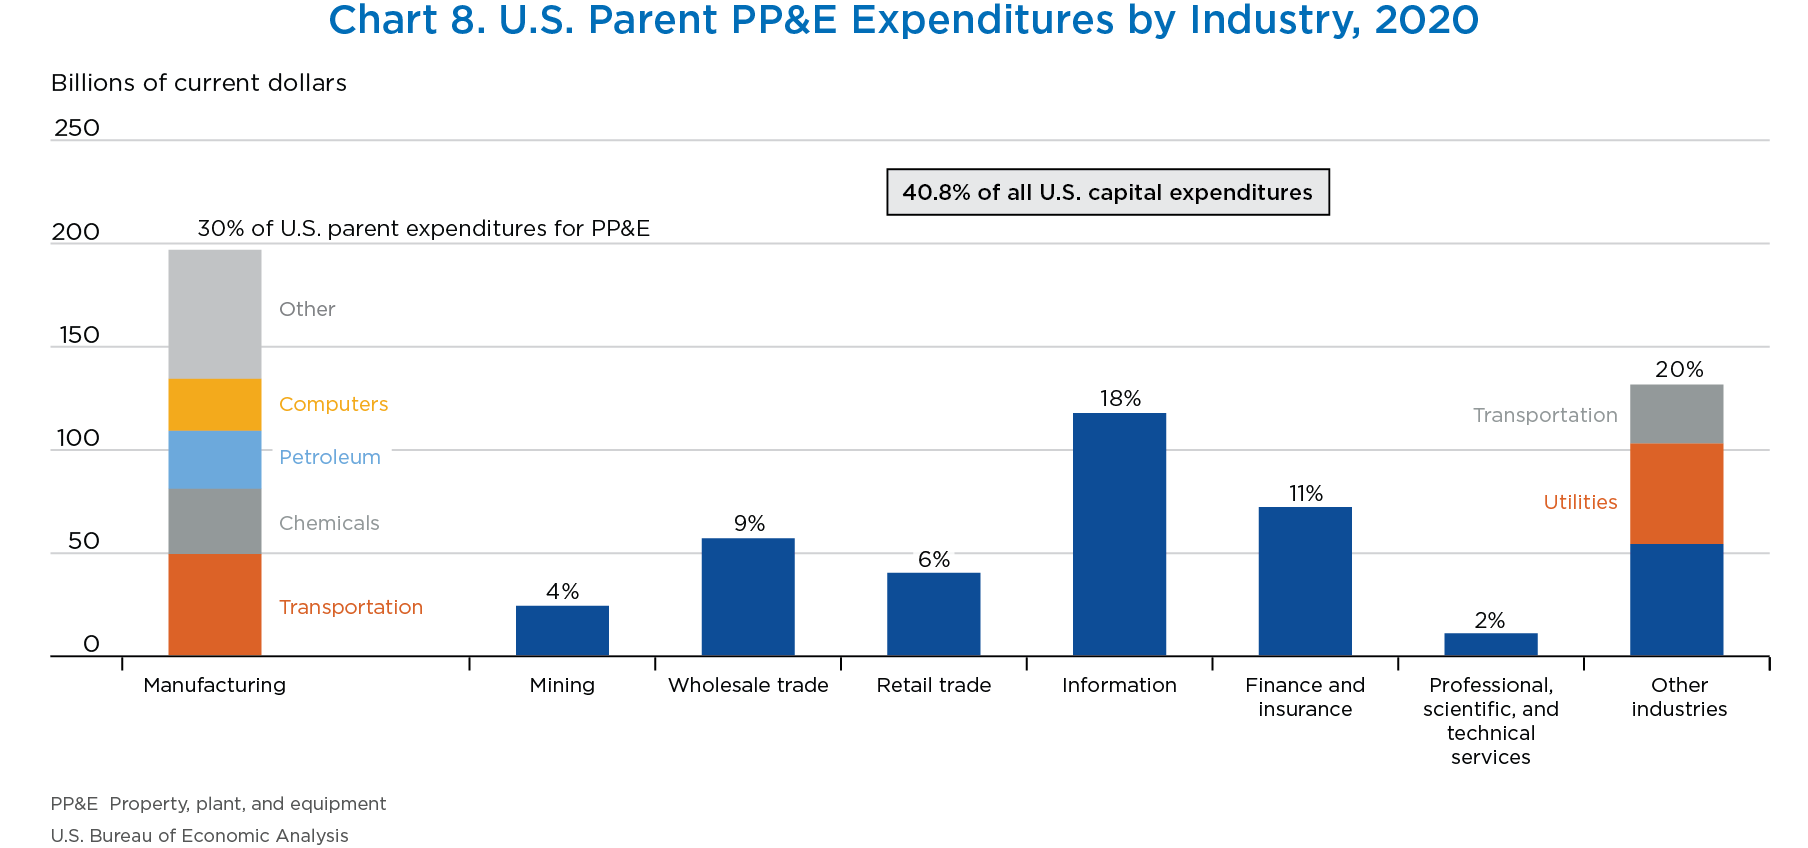
- U.S. parents accounted for 40.8 percent of all U.S. PP&E expenditures, a higher share than for employment and value added.
- The industries with the largest U.S. parent PP&E expenditures were manufacturing (30 percent), other industries (20 percent), and information (18 percent).
- Within other industries, utilities and transportation and warehousing contributed the largest shares.
- PP&E expenditures decreased in all major industry categories with the exception of finance and insurance.
[Click chart to expand]
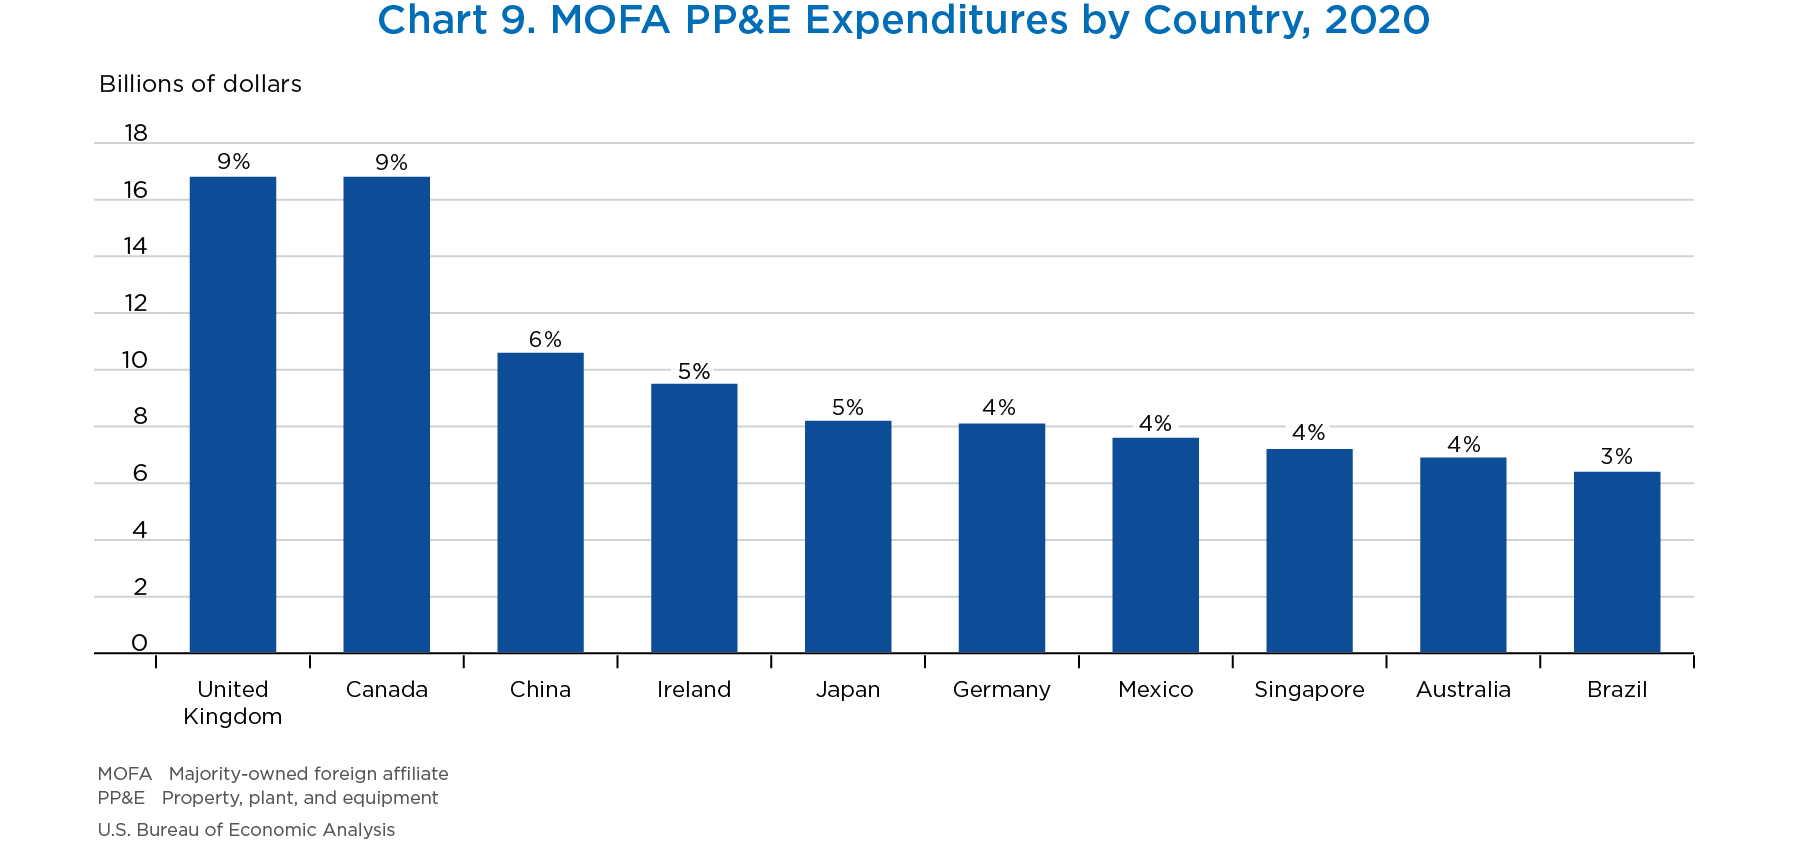
- The countries with the largest MOFA PP&E expenditures were the United Kingdom, Canada, and China. These three countries accounted for approximately one-quarter of total MOFA PP&E expenditures.
- Manufacturing accounted for the largest share of PP&E expenditures in China, while other industries accounted for the largest in the United Kingdom and Canada.
[Click chart to expand]
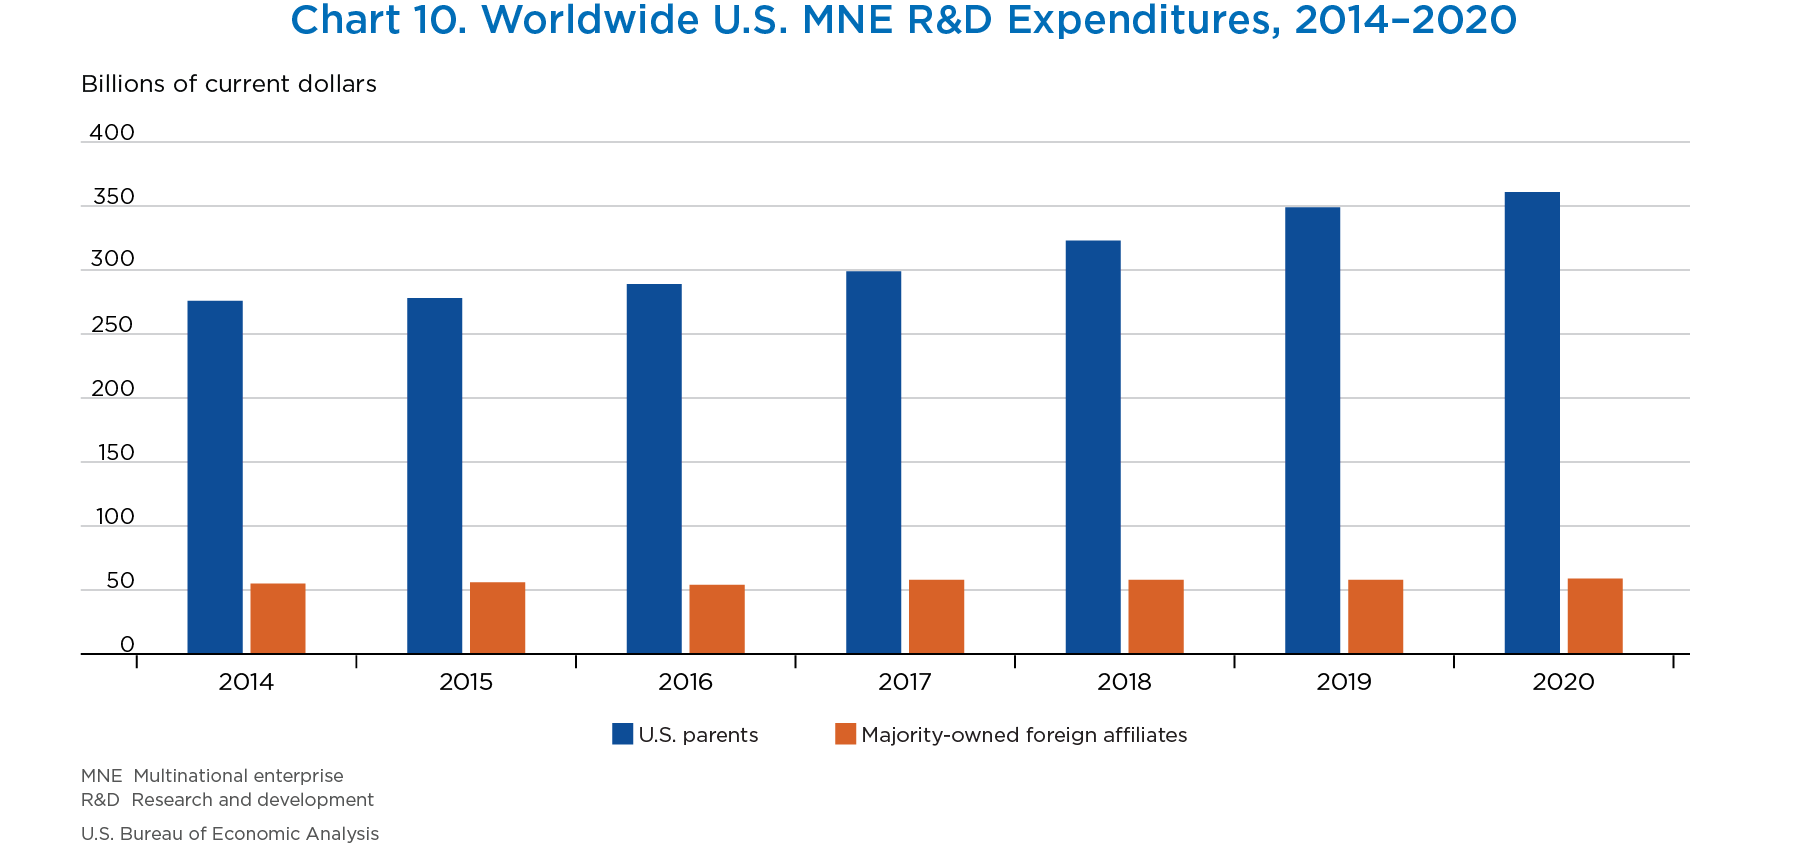
- Research and development (R&D) expenditures by U.S. parents increased 3.5 percent to $361.2 billion. The largest increases were in the chemicals manufacturing and the information industries.
- R&D expenditures by MOFAs have remained relatively flat since 2014.
- U.S. parents accounted for 86 percent of all worldwide R&D expenditures by U.S. MNEs, while MOFAs contributed the remaining 14 percent.
[Click chart to expand]
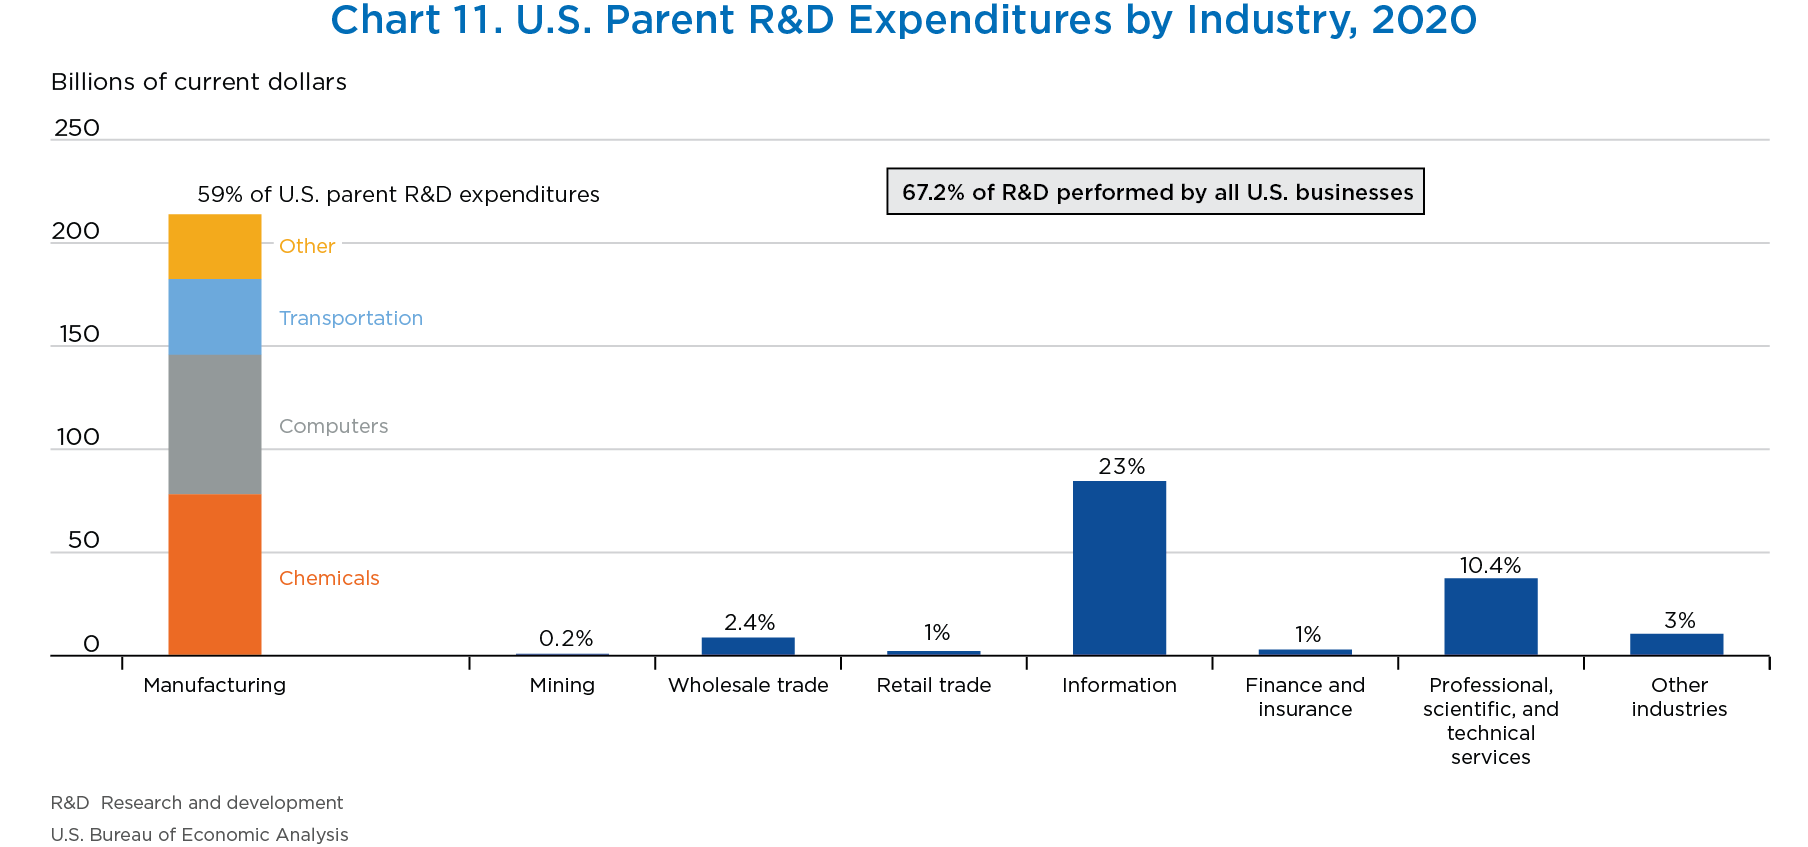
- U.S. parents accounted for 67.2 percent of all R&D expenditures by U.S. businesses, a substantially higher share than the U.S. parent share of U.S. business value added or employment.
- Manufacturing accounted for the largest share of U.S. parent R&D expenditures, making up nearly two-thirds of the total. Information was the second largest industry.
[Click chart to expand]
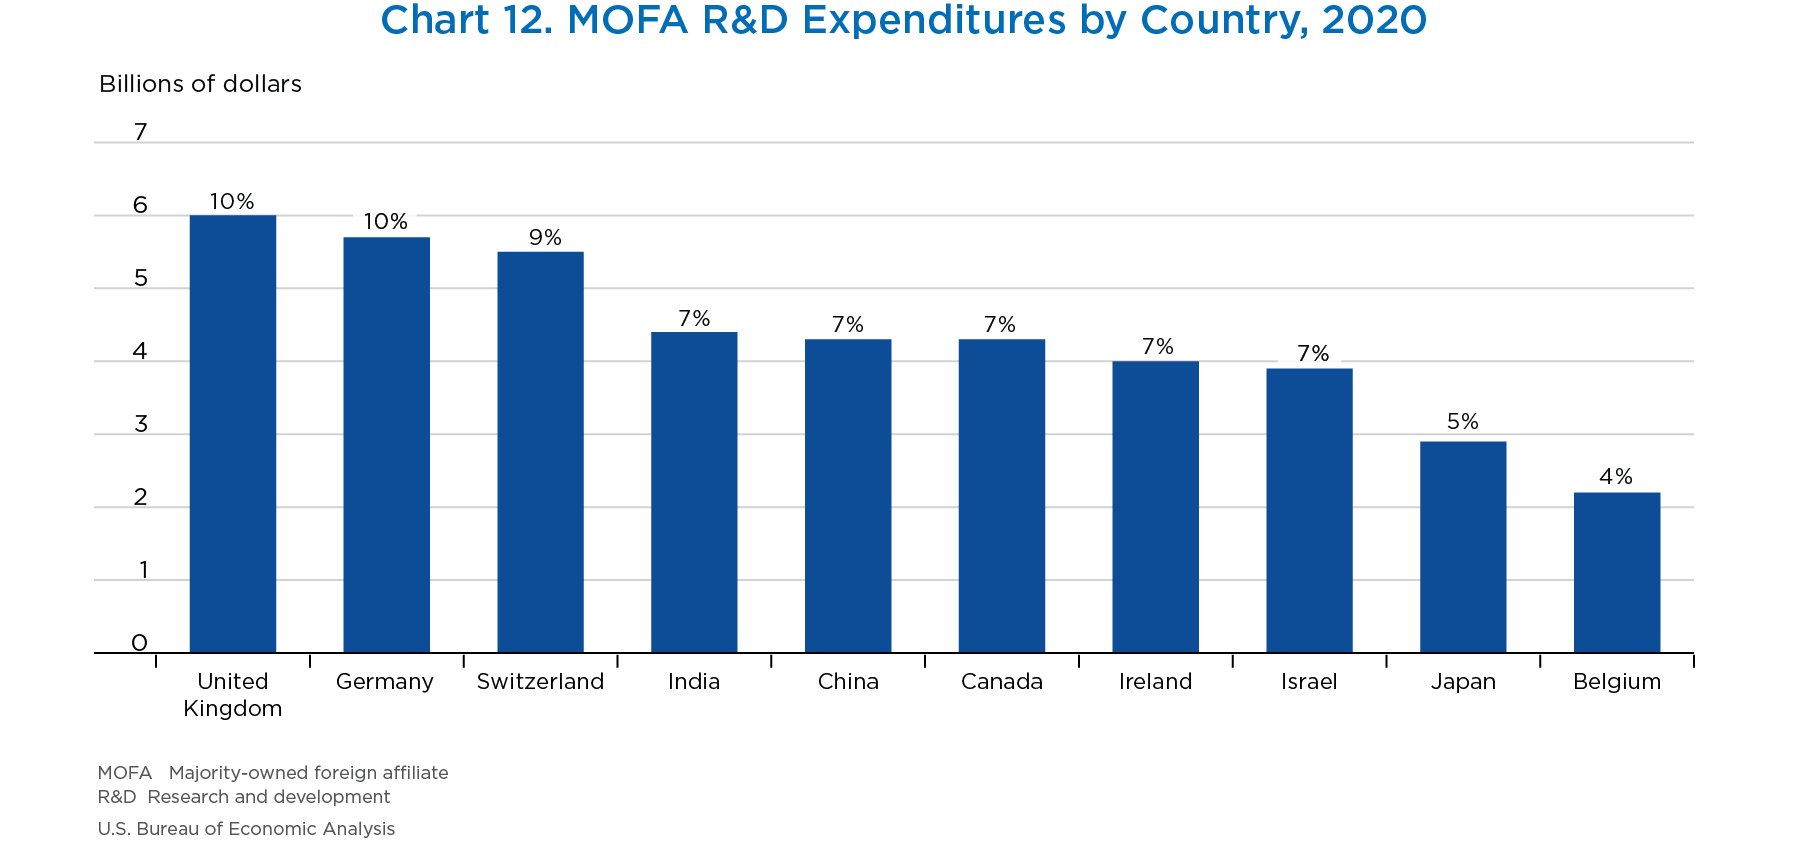
- The three countries with the largest MOFA R&D expenditures were the United Kingdom, Germany, and Switzerland. These three countries accounted for 29 percent of all MOFA R&D expenditures.
- By industry, the largest contributor to R&D expenditures in the United Kingdom and Germany was manufacturing.
Footnotes
- Employment covers the total number of full-time and part-time employees on the payroll at the end of the entity's fiscal year.
- Value added is the value of the final goods and services produced by a firm's labor and property. Value added represents the firm's direct contribution to the gross domestic product of the firm's country of residence.
- Expenditures for property, plant, and equipment cover expenditures for land and depreciable structures and equipment.
- Research and development (R&D) expenditures include expenditures for R&D performed by the U.S. parent or the affiliate, whether the R&D was for their own use or for use by others and irrespective of the source of funding.