
GDP and Personal Income by County
New Statistics for 2021 and Updated Statistics for 2014–2020
On November 16, 2022, the U.S. Bureau of Economic Analysis (BEA) released personal income by county statistics for 2021 and updated personal income by county statistics for 2014–2020. This was followed by the release of gross domestic product (GDP) by county statistics for 2021 and updated GDP by county statistics for 2017–2020 on December 8, 2022. These annual county estimates incorporate the results of the 2022 annual update of the National Income and Product Accounts (NIPAs) and the 2022 annual update of the state economic accounts.
GDP by county measures the value of goods and services produced within a county. Personal income by county measures the income received by, or on behalf of, all persons from all sources within a county. Sources of income include participation as laborers in production and income from owning a home or business, ownership of financial assets, and transfers from government and business, whether such source of income is foreign or domestic. Not included in personal income are realized or unrealized capital gains or loses.
The key difference between GDP and personal income is that corporate income and taxes on production and imports less subsidies are only included in GDP, while personal dividend and interest income and personal current transfer receipts are only included in personal income. In addition, GDP is measured by place of work, whereas personal income is measured by place of residence.
This article focuses primarily on the new county statistics for 2021 and provides analysis that shows how local economies fared in 2021 following the impacts of the COVID–19 pandemic in 2020. It also provides a brief overview of the updated county statistics.
GDP by county
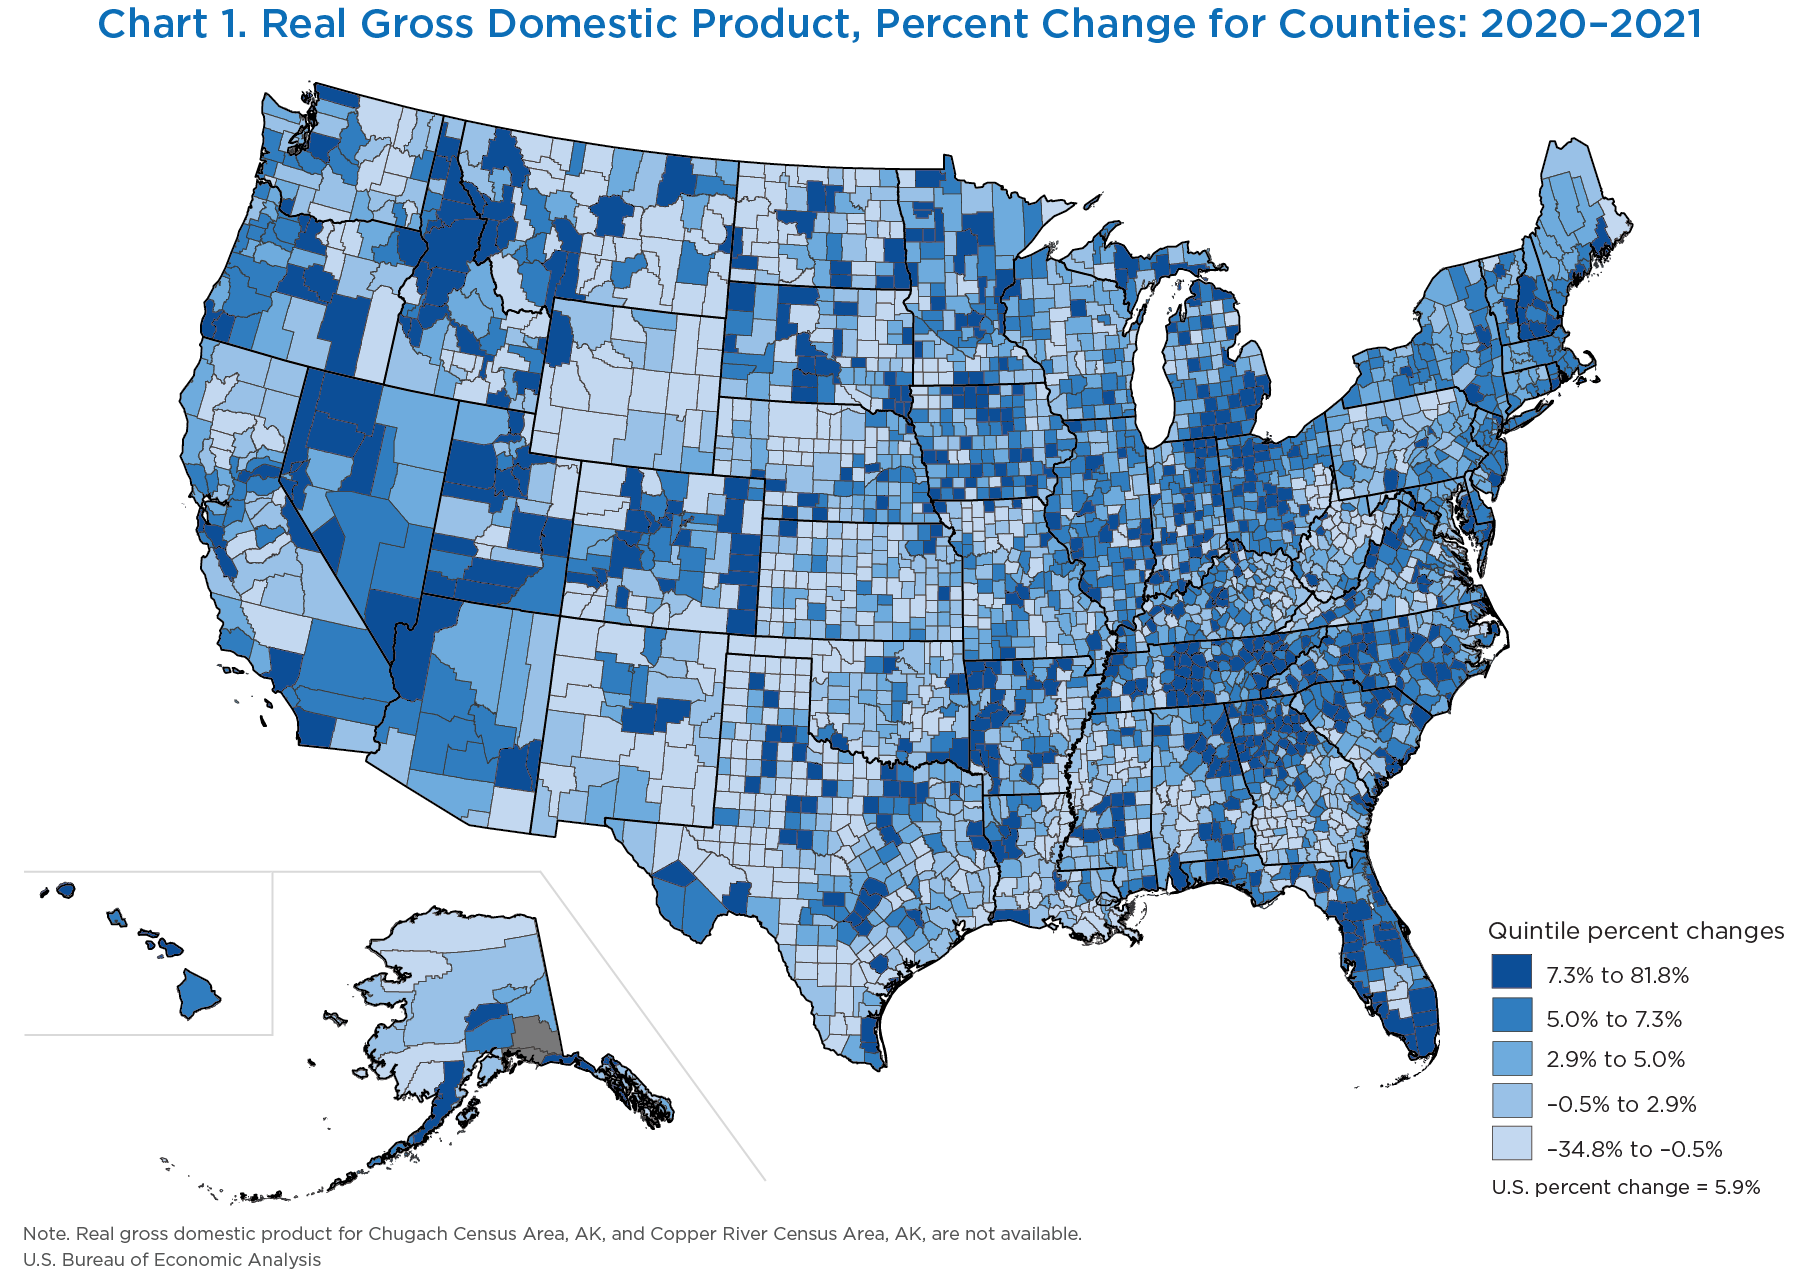
- Nationally, real GDP increased 5.9 percent in 2021 after decreasing 2.8 percent in 2020.
- Real GDP by county ranged from $11.7 million in Petroleum County, MT, to $711.9 billion in Los Angeles County, CA.
- Real GDP increased in 2,404 counties, decreased in 691 counties, and was unchanged in 17 counties in 2021.
- The percent change in real GDP ranged from −34.8 percent in Chouteau County, MT, to 81.8 percent in Coke County, TX (chart 1).
Personal income by county
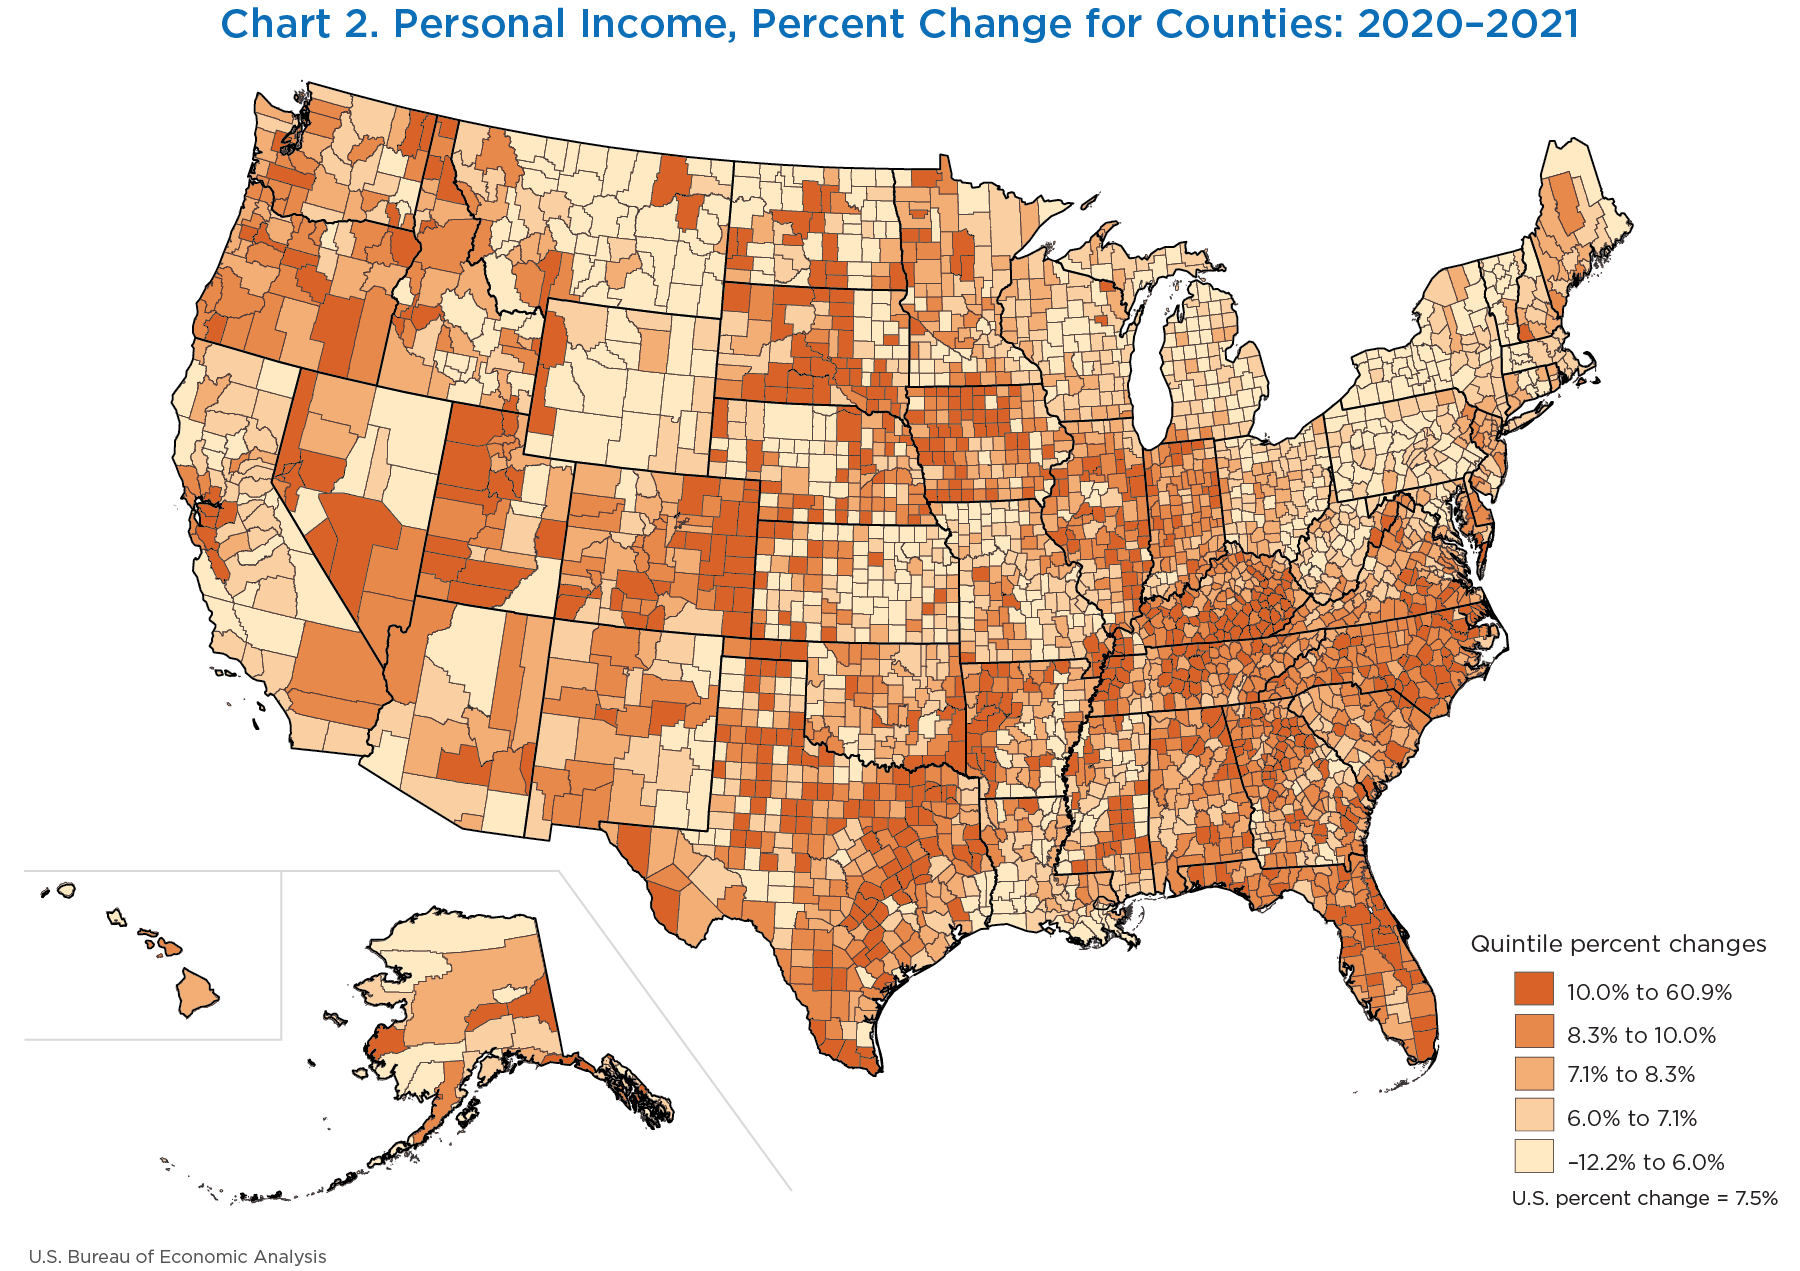
- Nationally, personal income increased 7.5 percent in 2021 after increasing 6.7 percent in 2020.
- Personal income by county ranged from $6.6 million in Loving County, TX, to $728.8 billion in Los Angeles County, CA.
- Personal income in 2021 increased in 3,075 counties, decreased in 36 counties, and remained unchanged in 3 counties.
- The percent change in personal income ranged from −12.2 percent in Chouteau County, MT, to 60.9 percent in Throckmorton County, TX (chart 2).
Real GDP
Nationally, real GDP increased 5.9 percent in 2021 after decreasing 2.8 percent in 2020. Real GDP in 2021 was $19.6 trillion and exceeded the 2019 level of $19.0 trillion. This increase represents a rebound following the initial impact of the COVID–19 pandemic in early 2020. However, the U.S. economy continued to be affected by COVID–19 variants throughout 2021.
Most states' GDP followed the same pattern as national GDP for these years, showing increases in 2021 that more than offset the declines of 2020 (table 1).
| Direction of growth | 2019–2020 | 2020–2021 | 2019–2021 |
|---|---|---|---|
| Increased | 7 | 51 | 41 |
| Decreased | 44 | 0 | 10 |
At the county level, however, the pattern of economic growth over the 2019–2021 period is less consistent. More than a third of the counties remained at lower levels of real GDP in 2021 compared with 2019 (table 2). Furthermore, since the percentage increases in economic output in 2021 are based on the lower levels in 2020, a review of the changes from 2020–2021 does not provide a full picture. For example, Skagway Municipality, AK, shows an increase in real GDP in 2021 equal to the national rate. This increase, however, followed a decline of 35.3 percent in 2020, the largest of any county in that year. To put these statistics into context, this analysis will emphasize the changes from 2019 to 2021.
| Direction of growth | 2019–2020 | 2020–2021 | 2019–2021 |
|---|---|---|---|
| Increased | 1,006 | 2,404 | 1,914 |
| Unchanged | 19 | 17 | 34 |
| Decreased | 2,087 | 691 | 1,164 |
Chart 3 displays the counties with positive change in real GDP for the period of 2019 to 2021. Regional patterns are noticeable, but they don’t necessarily follow state lines. All states other than Hawaii have at least one county with an increase for that period. All states but Maine, New Hampshire, and the District of Columbia (which is statistically treated as a single state with a single county) have at least one county with a decrease for that period.
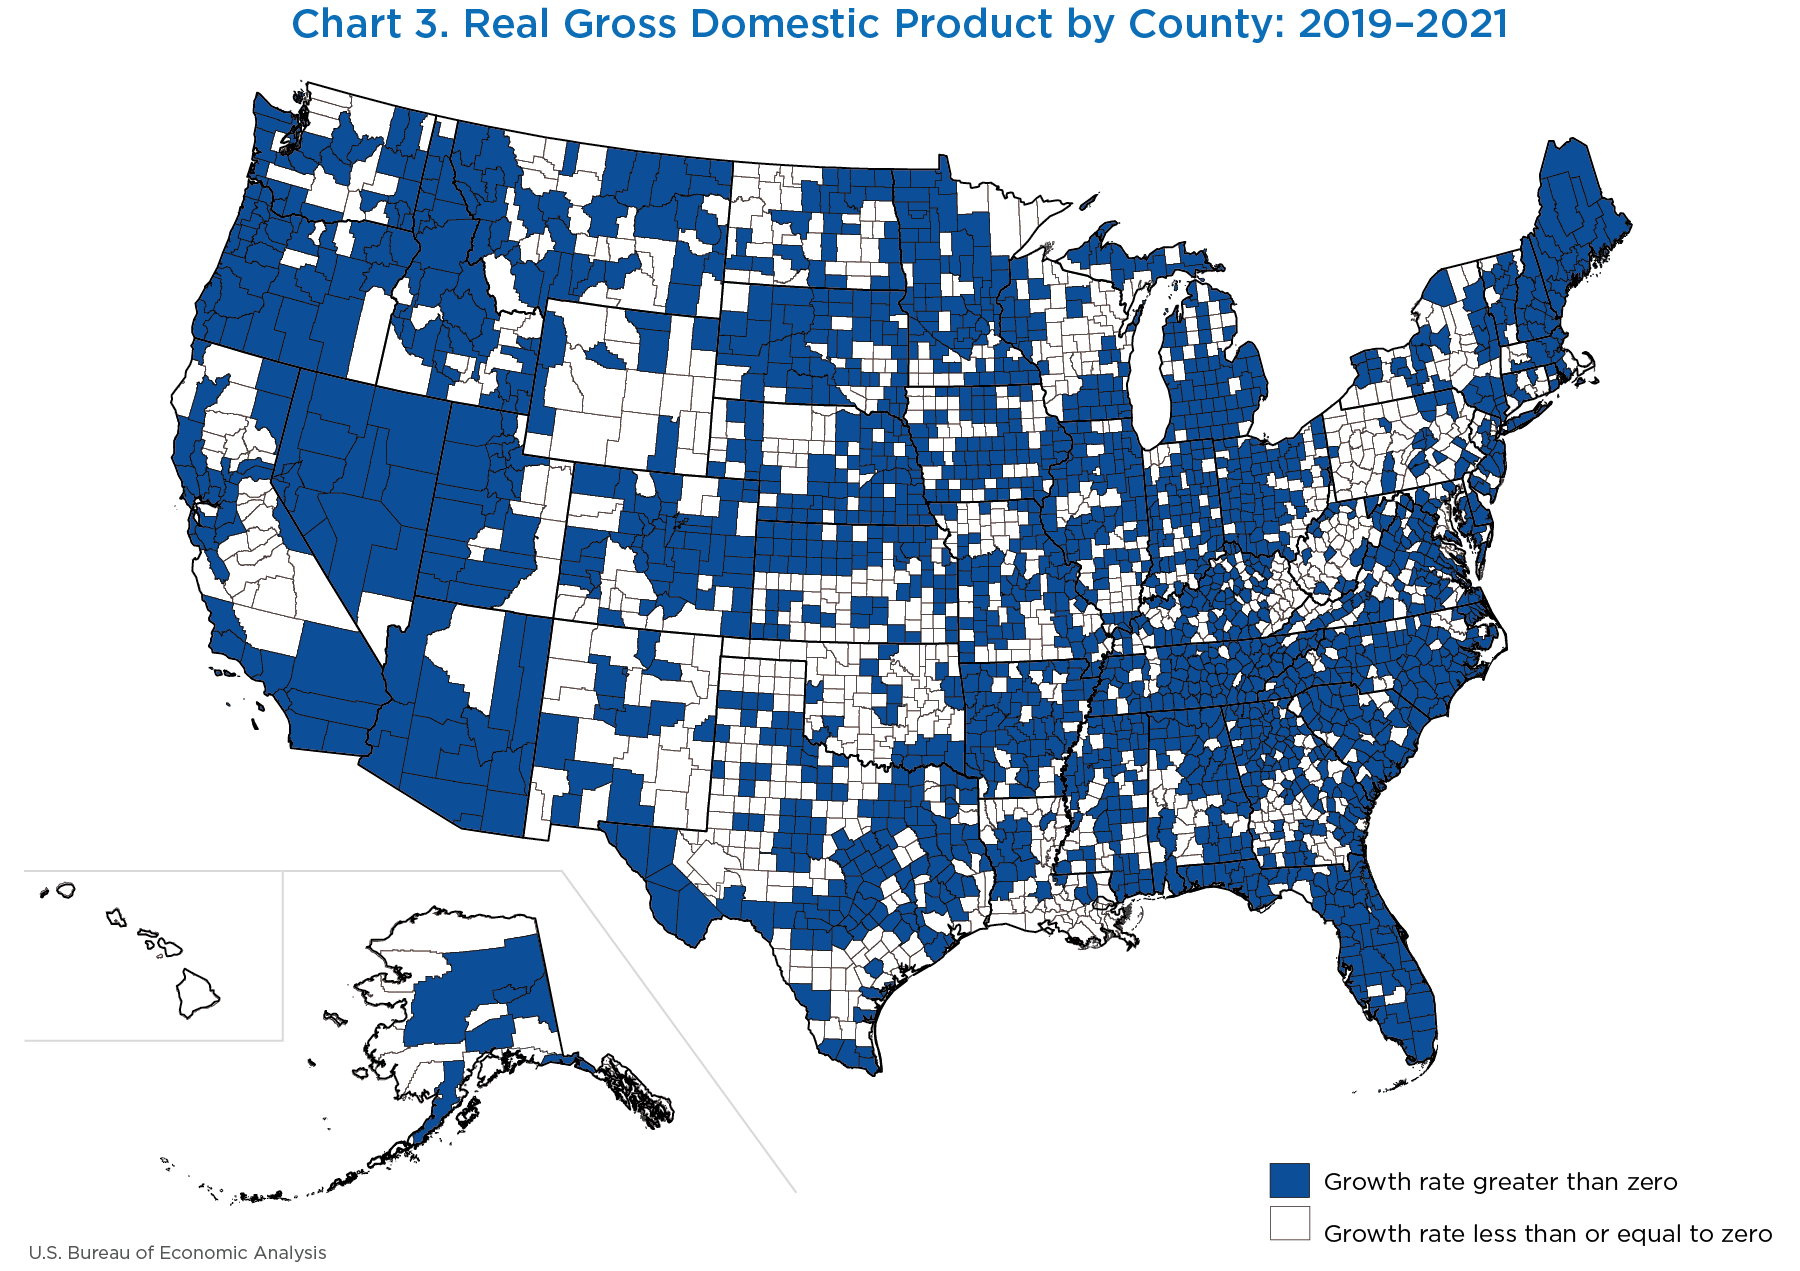
Table 3 shows the counties with the largest decreases in real GDP over the 2-year span. The five counties with the largest decreases saw double-digit percentage declines in both years. All 10 counties have small populations, with St. John the Baptist Parish, LA, at 42,094, and the rest under 15,000. Most of the declines were driven by agriculture (Cumberland, IL; Petroleum, MT; Harper, OK; and Chouteau, MT) or mining, quarrying, and oil and gas extraction (Dimmit, TX; McMullen, TX; and King, TX). The remaining counties were impacted by declines in manufacturing (St. John the Baptist, LA), professional and business services (Armstrong, TX), and several tourism-related industries (Skagway Municipality, AK).
| County | Percent change | ||
|---|---|---|---|
| 2019–2020 | 2020–2021 | 2019–2021 | |
| Cumberland, IL | −26.7 | −21.3 | −24.1 |
| Dimmit, TX | −19.6 | −22.9 | −21.3 |
| McMullen, TX | −16.0 | −21.5 | −18.8 |
| Petroleum, MT | −12.2 | −24.3 | −18.5 |
| King, TX | −19.8 | −16.7 | −18.3 |
| Harper, OK | −7.7 | −27.0 | −17.9 |
| St. John the Baptist, LA | −25.5 | −8.9 | −17.6 |
| Skagway Municipality, AK | −35.3 | 5.9 | −17.2 |
| Armstrong, TX | −23.1 | −10.5 | −17.0 |
| Chouteau, MT | 6.1 | −34.8 | −16.9 |
Note. The 2019–2021 percent changes are computed as compound annual growth rates.
Table 4 shows the counties with the largest increases in real GDP from 2019–2021. All 10 counties have a population under 15,000. The two largest increases were due to the establishment of wind farms: Foard County, TX, in 2020, and Coke County, TX, in 2021. Wind farms also accounted for the increases in Kiowa County, CO, and Throckmorton County, TX.
| County | Percent change | ||
|---|---|---|---|
| 2019–2020 | 2020–2021 | 2019–2021 | |
| Coke, TX | 0.9 | 81.8 | 35.4 |
| Foard, TX | 78.7 | 1.2 | 34.5 |
| Cheyenne, CO | 12.3 | 57.8 | 33.1 |
| Hyde, SD | 29.4 | 32.3 | 30.8 |
| Campbell, SD | 58.4 | 3.5 | 28.0 |
| Shoshone, ID | 17.2 | 27.7 | 22.4 |
| Clark, SD | 74.3 | −16.0 | 21.0 |
| Wetzel, WV | 54.4 | −5.3 | 20.9 |
| Kiowa, CO | −1.3 | 44.3 | 19.4 |
| Throckmorton, TX | −7.6 | 52.8 | 18.9 |
Note. The 2019–2021 percent changes are computed as compound annual growth rates.
At the national level, real GDP growth in 2021 was driven by a broad range of industries. Real GDP by industry grew the fastest in arts, entertainment, recreation, accommodation, and food services (28.3 percent); information (13.9 percent); and professional and business services (11.7 percent) (table 5). Among these, arts, entertainment, recreation, accommodation, and food services was most severely affected by the COVID–19 pandemic lockdowns and social-distancing measures. Real GDP for this industry declined 27.6 percent in 2020, and despite the strong growth in 2021, it remained below its 2019 level.
| Industrial sector | Change from previous year (billions of chained 2012 dollars) | Percent change from preceding period | Compound annual growth rate | |||
|---|---|---|---|---|---|---|
| 2019 | 2020 | 2021 | 2019–2020 | 2020–2021 | 2019–2021 | |
| Agriculture, forestry, fishing and hunting | 222.3 | 228.6 | 209.2 | 2.8 | −8.5 | −3.0 |
| Mining, quarrying, and oil and gas extraction | 493.8 | 488.3 | 408.9 | −1.1 | −16.3 | −9.0 |
| Utilities | 283.8 | 294.2 | 282.2 | 3.6 | −4.1 | −0.3 |
| Construction | 674.3 | 648.4 | 664.3 | −3.8 | 2.5 | −0.7 |
| Manufacturing | 2,230.9 | 2,129.5 | 2,271.8 | −4.5 | 6.7 | 0.9 |
| Wholesale trade | 1,102.3 | 1,102.1 | 1,163.3 | 0.0 | 5.5 | 2.7 |
| Retail trade | 1,116.8 | 1,084.8 | 1,113.2 | −2.9 | 2.6 | −0.2 |
| Transportation and warehousing | 562.5 | 495.0 | 532.0 | −12.0 | 7.5 | −2.8 |
| Information | 1,241.9 | 1,290.9 | 1,470.7 | 3.9 | 13.9 | 8.8 |
| Finance, insurance, real estate, rental, and leasing | 3,576.0 | 3,573.6 | 3,744.0 | −0.1 | 4.8 | 2.3 |
| Professional and business services | 2,535.2 | 2,504.7 | 2,796.8 | −1.2 | 11.7 | 5.0 |
| Educational services, health care, and social assistance | 1,666.7 | 1,618.8 | 1,692.7 | −2.9 | 4.6 | 0.8 |
| Arts, entertainment, recreation, accommodation, and food services | 733.4 | 530.9 | 680.9 | −27.6 | 28.3 | −3.6 |
| Other services (except government and government enterprises) | 367.7 | 331.3 | 349.2 | −9.9 | 5.4 | −2.5 |
| Government and government enterprises | 2,215.7 | 2,207.9 | 2,219.8 | −0.4 | 0.5 | 0.1 |
Note. Chained-dollar series (2012) are calculated as the product of the chain-type quantity index and the 2012 current-dollar value of the corresponding series divided by 100. Because the formula for the chain-type quantity indexes uses weights of more than one period, the corresponding chained-dollar estimates are usually not additive.
Contrasting the broad increases in real GDP for many industries in 2021 was the real GDP decline in three industries: mining, quarrying, and oil and gas extraction (−16.3 percent); agriculture, forestry, fishing and hunting (−8.5 percent); and utilities (−4.1 percent). While the national industry trends tend to manifest differently at the local level, primarily because of the industry concentration and composition of local area economies, these three industries are particularly important to the economies of many small rural counties. Table 6 illustrates this point by presenting the industry contributions to the percent change in real GDP for a selection of counties from tables 3 and 4.
| Selected counties with large increases in real GDP | Selected counties with large declines in real GDP | |||||||||
|---|---|---|---|---|---|---|---|---|---|---|
| Cheyenne, CO | Coke, TX | Hyde, SD | Shoshone, ID | Throckmorton, TX | Chouteau, MT | Cumberland, IL | Dimmit, TX | Harper, OK | McMullen, TX | |
| All industry total (percent change) | 57.8 | 81.8 | 32.3 | 27.7 | 52.8 | −34.8 | −21.3 | −22.9 | −27.0 | −21.5 |
| Agriculture, forestry, fishing and hunting | 18.3 | (D) | −7.6 | 0.0 | −0.2 | −37.0 | −23.2 | 0.0 | −21.0 | 0.0 |
| Mining, quarrying, and oil and gas extraction | −4.2 | −3.2 | 0.0 | 23.1 | −5.7 | −0.1 | 0.0 | −24.1 | −2.1 | −21.8 |
| Utilities | 41.0 | 84.1 | 37.5 | 0.0 | −0.1 | 0.0 | 0.0 | 0.0 | −3.7 | 0.0 |
| Construction | −0.3 | −0.4 | −0.2 | −0.2 | 57.2 | 0.0 | 0.0 | 0.3 | (D) | 0.0 |
| Manufacturing | 0.2 | (D) | 0.0 | 0.1 | 0.2 | 0.2 | 0.6 | 0.0 | (D) | 0.2 |
| Wholesale trade | 0.6 | 0.0 | 0.4 | 0.0 | 0.1 | 0.1 | 0.7 | 0.0 | 0.0 | (D) |
| Retail trade | −0.1 | 0.3 | −0.3 | 1.0 | 0.4 | 0.2 | 0.1 | 0.0 | −0.1 | 0.0 |
| Transportation and warehousing | 0.5 | 0.8 | 0.3 | 0.0 | −0.5 | 0.9 | 0.0 | −0.1 | 0.0 | (D) |
| Information | 0.1 | 2.8 | 0.5 | 0.2 | 0.0 | 0.0 | 0.0 | 0.0 | 0.0 | 0.0 |
| Finance, insurance, real estate, rental, and leasing | 1.0 | −0.6 | 0.5 | 2.1 | 0.0 | 0.2 | 0.0 | 0.0 | 0.1 | 0.0 |
| Professional and business services | 0.1 | −0.6 | (D) | 0.3 | 0.1 | 0.1 | 0.0 | 0.2 | 0.1 | (D) |
| Educational services, health care, and social assistance | 0.0 | (D) | −0.2 | 0.0 | 0.4 | 0.2 | 0.5 | 0.2 | −0.2 | (D) |
| Arts, entertainment, recreation, accommodation, and food services | (D) | 0.4 | (D) | 1.4 | (D) | 0.2 | 0.1 | 0.3 | 0.2 | 0.0 |
| Other services (except government and government enterprises) | 0.0 | (D) | 0.4 | −0.1 | (D) | 0.0 | 0.0 | 0.0 | −0.1 | (D) |
| Government and government enterprises | 0.4 | −1.2 | 0.9 | 0.0 | 0.1 | 0.1 | 0.0 | 0.4 | −0.2 | 0.0 |
- (D)
- Not shown to avoid disclosure of confidential information; estimates are included in higher-level totals.
The utilities industry led real GDP growth in three of the five counties with large increases in real GDP in 2020–2021 shown in table 6. The exceptions were Shoshone, ID, and Throckmorton, TX. The mining, quarrying, and oil and gas extraction industry was the largest contributor to growth in Shoshone, ID, contributing 23.1 percentage points to the real GDP growth in this county. Construction was the largest contributor to real GDP growth in Throckmorton, TX, contributing 57.2 percentage points to real GDP growth in this county.
Agriculture, forestry, fishing and hunting drove the decline in real GDP in three of the five counties with large declines in real GDP shown in table 6. Mining, quarrying, and oil and gas extraction drove the decline in the remaining two: Dimmit, TX, and McMullen, TX.
Personal income
Nationally, personal income increased in 2021 to $21.3 trillion, up from $19.8 trillion in 2020 (chart 4). The 2021 increase in personal income followed an increase in 2020 from $18.6 trillion, due primarily to the increase in personal current transfer receipts, which included the many COVID–19 pandemic response programs.

Although the increase in personal income in 2021 seems to continue the trend established in 2020, the underlying components of personal income show a radically different picture when comparing the two time periods. Two of the major income components show a reverse shift in the pattern established in the prior period: personal current transfer receipts slowed, while earnings accelerated and offset the deceleration in transfers (chart 5). An analysis of these underlying components provides a nuanced story of economic recovery, reflected both in the increase of earnings and the diminished reliance on pandemic recovery programs.

Personal income has three major components: (1) earnings, (2) dividends, interest, and rent, and (3) personal current transfer receipts. In 2020, the increase in personal income was primarily driven by personal current transfer receipts, which contributed $1.1 trillion to the total increase in personal income in 2020 (chart 5). In contrast, earnings had a much smaller increase of $0.2 trillion in 2020. In 2021, as personal income continued to rise, earnings became the primary driver, contributing $1.0 trillion to the total increase. The change in personal current transfer receipts was much smaller in 2021 than the prior period, increasing by $0.4 trillion.
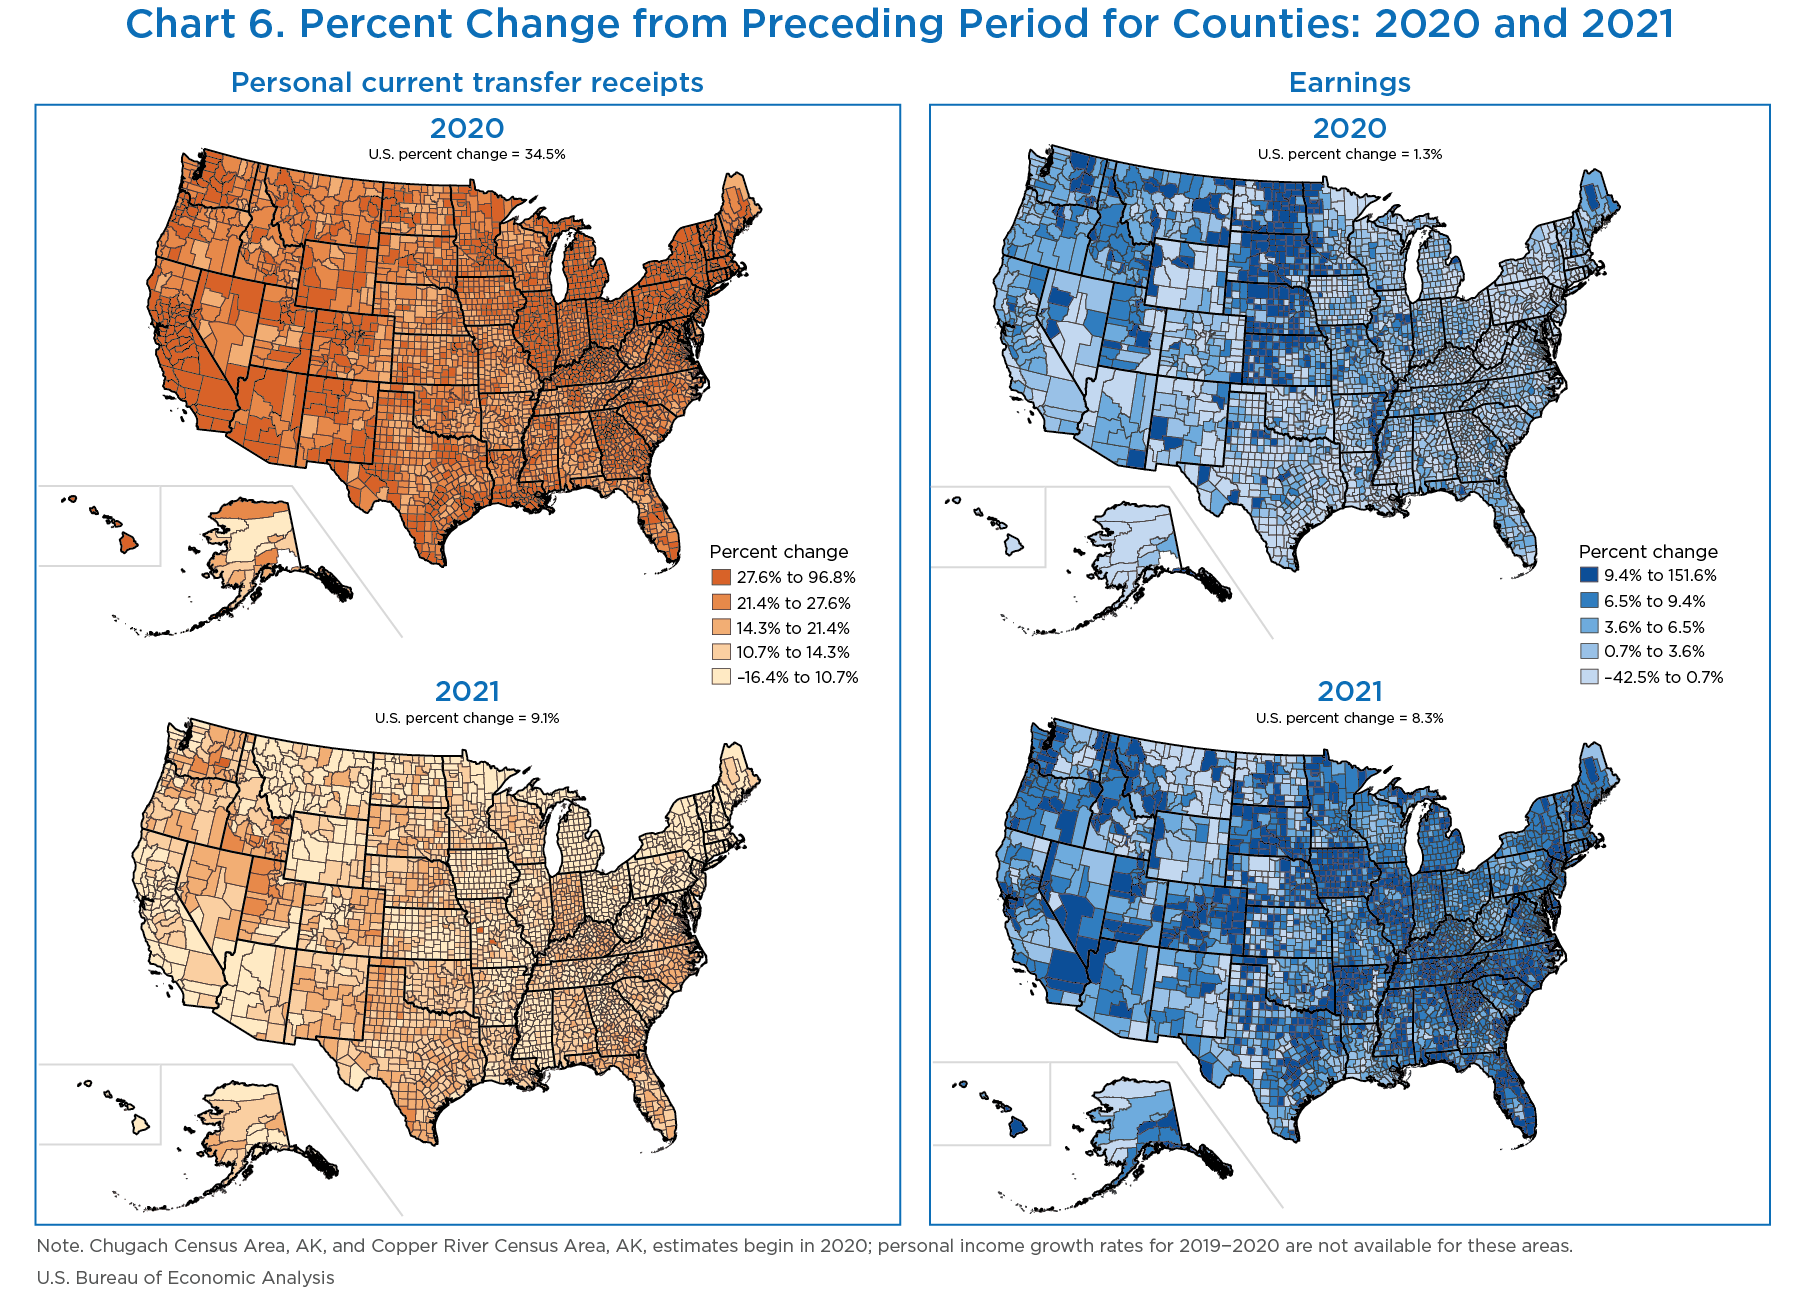
Chart 6 shows the comparison of the change in personal current transfer receipts and earnings at the county level between the two periods. To generate the shared scale of comparison for each component, the percent increases for both periods were combined and then divided into quintiles.
The top panels of the chart show percent increases in personal current transfer receipts and earnings for 2019–2020. The map of personal current transfer receipts reflects large percent increases across the board, while the map for earnings shows small percentage increases in general, except for counties concentrated in the Midwest, for which growth was driven mainly by farm proprietors' income. The bottom panels of the chart show percent increases for both components from 2020 to 2021. The left panels of the chart show the deceleration in personal current transfer receipts from 2020 to 2021. The right panels of the chart show the opposite; the acceleration in earnings in 2021. Most counties had comparatively larger increases in earnings in 2021.
The trends in chart 6 become even more evident when looking at the number of counties that fall under each percent category. Chart 7 presents a panel of histograms that depicts the total number of counties that fall under the same percentage categories as the maps in chart 6. The top panels show the county distribution across the percentage categories for 2019–2020, while the bottom panels show the same distribution for 2020–2021.

The 2019–2020 distribution of counties for percent change in personal current transfer receipts is skewed toward the fifth interval, the 27.6 percent to 96.8 percent category, where most of the counties fall (1,241). In 2020–2021, the trend reverses, and the 27.6 percent to 96.8 percent category now has the least number of counties (four). Instead, the county data is skewed in the opposite direction, and the largest number of counties (1,243) falls in the first interval, the −16.4 percent to 10.7 percent category. The earnings component follows the opposite trend; for 2019–2020, most counties (1,068) fall within the range of the first interval, whereas for 2020–2021 most counties (1,051) fall in the fourth interval, within the range of 6.5 percent to 9.4 percent increase.
The change in earnings had a significant impact on personal income for most counties in 2021. Chart 8 shows the five counties with the largest percent changes in personal income as well as the percent contributions by major income component. The largest contributor to the increase in personal income for all the counties listed is earnings.

The county with the highest increase in personal income in 2021 was Throckmorton County, TX, which was also the third-fastest growing county in real GDP. Personal income in Throckmorton County increased by 60.9 percent. Earnings was the primary driver, contributing 53.3 percentage points to the increase personal income for this county.
Earnings increased from $22.7 million in 2020 to $57.0 million in 2021, with wages and salaries accounting for most of the increase in earnings (chart 9).

Wages and salaries increased from $15.3 million in 2020 to $48.1 million in 2021 (chart 10). The increase in personal income in Throckmorton County was due to a wind turbine construction project.

Earnings also had a notable impact on the counties with the largest declines in personal income. It was the largest contributor to the decline in personal income for each county in chart 11, despite the modest increases in personal current transfer receipts.

Chouteau County, MT, was the county with the largest decline in personal income in 2021, which was also the county with the largest decline in real GDP.
In this county, personal income decreased from $264.7 million in 2020 to $232.4 million in 2021 (chart 12). The earnings component was the largest contributor to the decline in personal income for this county. Earnings declined from $143.2 million in 2020 to $101.6 million in 2021.

A further breakdown of earnings shows that proprietors' income (chart 13) —specifically, farm proprietors' income—was the main driver of the decline in personal income for this county, declining $47.1 million from $58.1 million in 2020 to $11.0 million in 2021 (chart 14). The reason for this decline is the decrease in crop inventory change, which follows the state trend. The decrease is significant here because Chouteau County ranks as the largest grain producer in Montana.


Included with the release of 2021 statistics of GDP and personal income by county were two methodological improvements to the estimation methodologies for personal current transfer receipts. Additionally, new and revised data were incorporated into the estimates where available, in both the new 2021 estimates and the updated estimates for earlier years.
Methodology improvements
The American Opportunity Tax Credit is a refundable tax credit for eligible students for qualified education expenses paid for the first 4 years of higher education. The Premium Tax Credit is a refundable tax credit for eligible individuals and families who purchase health insurance through the Affordable Care Act Health Insurance Marketplace. These tax credits are included in estimates of personal current transfer receipts. The previous estimates of these tax credits at the county level have been based on Internal Revenue Service (IRS) Stakeholder Partnerships, Education and Communication data and population data, respectively. This estimate cycle, BEA incorporated IRS Statistics of Income data, on actual amounts claimed for both tax credits, for these estimates. The new methodology was implemented back to 2014.
Data—GDP by county
In September 2022, BEA revised its annual GDP by state estimates from 2017 to 2020 to incorporate the results of the annual updates of the NIPAs and GDP by industry statistics, as well as new and revised state-level source data that are more complete and more detailed than previously available. In December, BEA incorporated the September updates to the GDP by state statistics to revise the GDP by county statistics and to publish the 2021 GDP by county estimates. The December release of GDP by county estimates was also an opportunity for BEA to incorporate new and revised county-level source data. Revised source data for GDP by county included 2017–2020 BEA personal income by county statistics, Quarterly Census of Employment and Wages (QCEW) data published by the U.S. Bureau of Labor Statistics; airline statistics from the U.S. Bureau of Transportation Statistics; and net electricity generation data from the U.S. Energy Information Administration. Several sources, including QCEW, additionally had new data for 2021. Table 7 lists the updated data sources used to estimate GDP by county and the years updated.
| Data | Source | Years updated |
|---|---|---|
| Quarterly Census of Employment and Wages | U.S. Bureau of Labor Statistics | 2017–2020; 20211 |
| Local area personal income | U.S. Bureau of Economic Analysis | 2017–2020; 20211 |
| National Establishment Time Series | Dun & Bradstreet | 20211 |
| Net electricity generation data | U.S. Energy Information Administration | 2017–2020; 20211 |
| Coal production | U.S. Energy Information Administration | 20201 |
| Value of Construction Put in Place | Dodge Data & Analytics | 2017–2020; 20211 |
| Oil and gas production | DrillingEdge | 2017–2020; 20211 |
| U.S. airline financial data (Schedule P-1.2) | Bureau of Transportation Statistics | 20211 |
| U.S air carrier traffic statistics (T-100 Domestic and International Segments) | Bureau of Transportation Statistics | 20211 |
| Carload Waybill Sample | Surface Transportation Board | 20201 |
| Summary of Deposits | Federal Deposit Insurance Corporation | 20211 |
| International banking facilities deposits | Federal Reserve Bank of Chicago | 20211 |
Table Footnotes
- Newly available data.
Data—personal income by county
In September 2022, BEA revised its preliminary annual personal income by state estimates from 2014 to 2020 to incorporate the annual revision of the NIPAs as well as new and revised state-level source data that are more complete and more detailed than previously available. In November, BEA incorporated the September updates to personal income by state statistics to revise the personal income by county statistics and to publish the 2021 personal income by county estimates. The November release of personal income by county estimates was also an opportunity for BEA to incorporate new and revised county-level source data. Revised source data for personal income by county included 2017–2020 data from the QCEW and veterans' benefits data from the U.S. Department of Veterans Affairs. Several sources, including QCEW, additionally had new data for 2021. Table 8 lists the updated data sources used to estimate personal income by county and the years updated.
| Data | Source | Years updated |
|---|---|---|
| Quarterly Census of Employment and Wages | U.S. Bureau of Labor Statistics | 2017–2020, 20211 |
| Statistics of Income | Internal Revenue Service | 2014–2019, 20201 |
| Veterans pension, disability, life insurance, and readjustment benefits data; number of pension and disability beneficiaries | U.S. Department of Veterans Affairs | 2017–2020, 20211 |
| Medicare Advantage fee-for-service expenditure data; enrollment data for Medicare hospital insurance, supplement health insurance, and Medicare Parts B and D | Centers for Medicare & Medicaid Services | 20211 |
| Paycheck Protection Program loans data | U.S. Small Business Administration | 20201 |
| Military strength by service and location | Defense Manpower Data Center, U.S. Department of Defense | 2017–2020, 20211 |
Table Footnotes
- Newly available data.
BEA has revised the personal income by county statistics from 2014 to 2020 and the GDP by county statistics from 2017 to 2020. These revisions were made to incorporate updates made to the source data and the state statistics used to estimate the county statistics. The updates to the personal income statistics, measured as a percentage of the previously published statistics, were modest for most counties. Compared with personal income revisions, counties experienced a higher mean absolute revision (MAR) in real GDP (table 9). This can be explained by the incorporation of the larger number of revised source data used to estimate real GDP.
| Mean absolute revision (percent) | Number of counties | |
|---|---|---|
| Revisions to real gross domestic product by county (2017–2020) | Revisions to personal income by county (2014–2020) | |
| 0.0–4.9 | 2,966 | 3,052 |
| 5.0–9.9 | 109 | 52 |
| 10.0 or greater | 38 | 10 |
The MAR to personal income across all periods open to revision from 2014 to 2020 was 0.5 percent. MAR was less than 5.0 percent in 3,052 counties, between 5.0 and 9.9 percent in 52 counties, and equal to or greater than 10.0 percent in 10 counties.
The MAR to real GDP across all periods open to revision from 2017 to 2020 was 1.2 percent. MAR was less than 5.0 percent in 2,966 counties, between 5.0 and 9.9 percent in 109 counties, and equal to or greater than 10.0 percent in 38 counties.
This report covered annual estimates for 2021 from the GDP by county and personal income by county releases to tell a story of ongoing regional economic recovery from the COVID–19 pandemic. The data show that while nationally the economy has generally recovered, the path to economic recovery has varied widely at the local level. Real GDP increased in most counties in 2021; however, it remained below 2019 levels in 1,164 counties. Personal income continued to grow in most counties in 2021, with earnings increasing as pandemic-related personal current transfer receipts receded.
The report also provided an overview of the updates to previously released statistics. The GDP by county and personal income by county statistics were revised from 2017–2020 and 2014–2020 respectively, to incorporate the 2022 annual update of the NIPAs and the 2022 annual update of state economic accounts, along with updated available source data. The impact of the revisions was generally small.