

Charting the Economy
First Quarter 2026
The U.S. Bureau of Economic Analysis (BEA) released its most recent estimate of gross domestic product (GDP) and other key statistics from the National Economic Accounts (NEAs), which include the National Income and Product Accounts (NIPAs) and the Industry Economic Accounts, on June 25, 2026. This quarter's “Charting the Economy” takes a closer look at the economy's performance in January, February, and March, with details on how much people are spending and earning, industry production and profits, and how prices are changing.
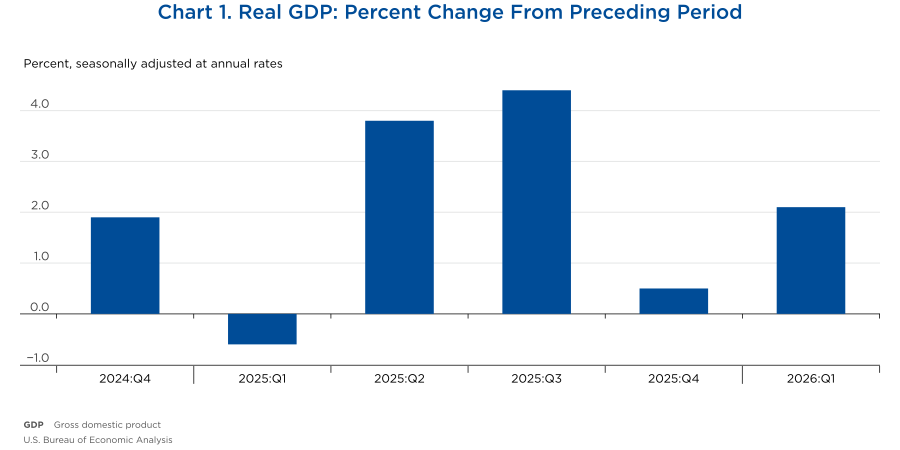
- In the first quarter of 2026, real GDP increased at an annual rate of 2.1 percent after increasing 0.5 percent in the fourth quarter of 2025.1
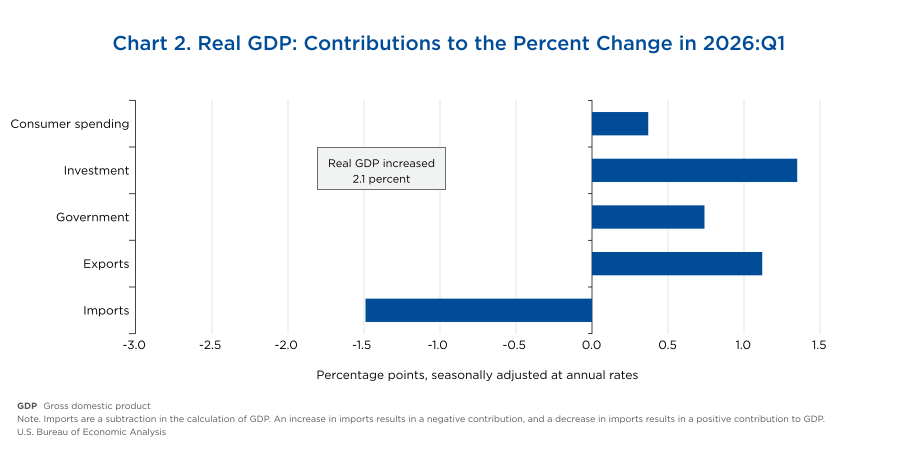
- The increase in real GDP in the first quarter reflected increases in investment, exports, government spending, and consumer spending. Imports, which are subtracted in the calculation of GDP because they are embedded in other components of GDP, also increased.2
- The increase in investment was led by equipment (notably information processing equipment), intellectual property products (mainly software), and private inventories (led by retail trade).
- The increase in exports reflected an increase in goods (led by computers, peripherals, and parts) that were partly offset by a decrease in services (led by other business services).
- The increase in government spending reflected increases in consumption expenditures for nondefense and defense and in state and local consumption expenditures.
- The increase in consumer spending was driven by increases in both services and goods. The increase in services was led by health care nonprofit expenses and professional advocacy nonprofit expenses. The increase in goods was led by “other nondurable goods” (notably recreational items) and “other durable goods” (mainly telephone and related communication equipment).
- The increase in imports reflected an increase in goods (led by computers, peripherals, and parts) that were partly offset by a decrease in services (led by transport).
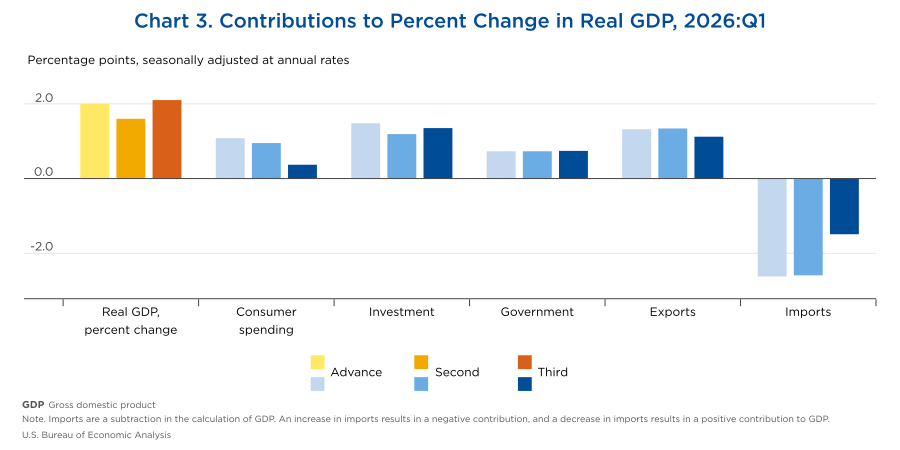
- In the advance estimate for the first quarter, real GDP increased at an annual rate of 2.0 percent.
- In the second estimate, real GDP increased 1.6 percent, a downward revision of 0.4 percentage point from the advance estimate, primarily reflecting downward revisions to investment and consumer spending.
- In the third estimate, real GDP increased 2.1 percent, an upward revision of 0.5 percentage point from the second estimate, primarily reflecting a downward revision to imports that was partly offset by a downward revision to consumer spending.
- Each GDP estimate for a quarter incorporates increasingly comprehensive and improved source data. For more details, refer to “GDP Revision Information” on the BEA website.
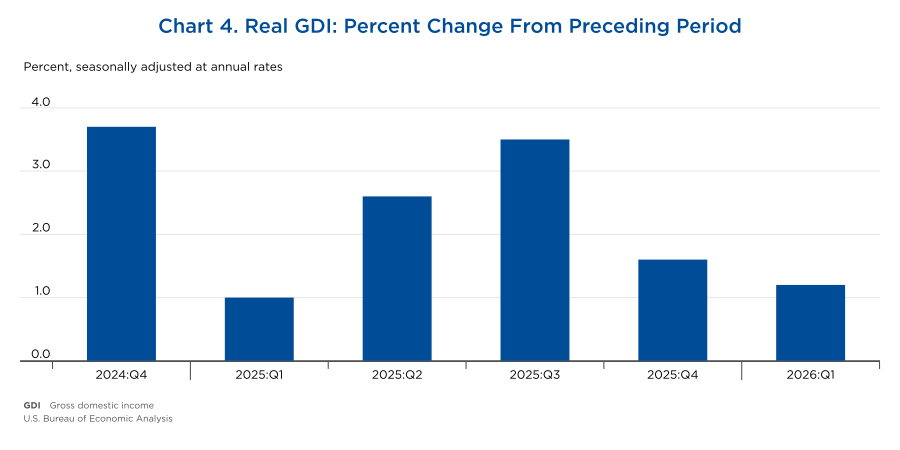
- Real gross domestic income (GDI) increased 1.2 percent at an annual rate in the first quarter, following an increase of 1.6 percent in the fourth quarter.
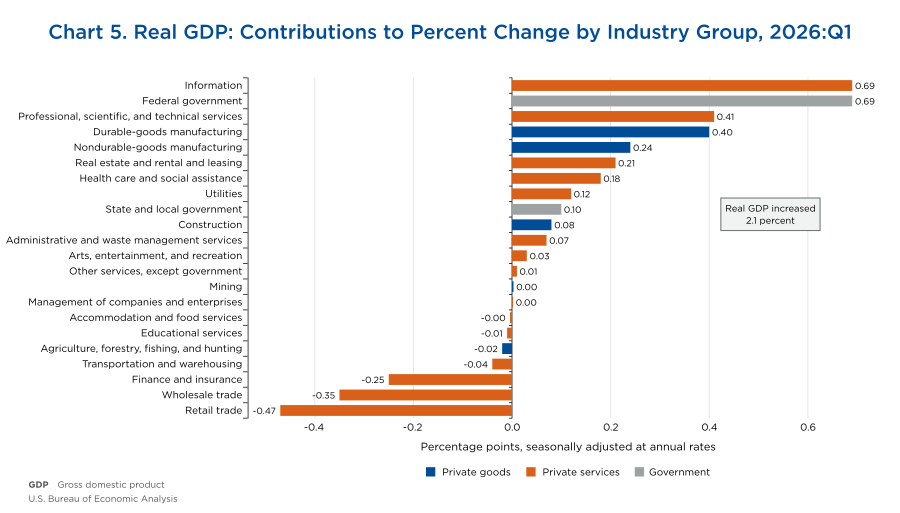
- From an industry perspective, the increase in real GDP in the first quarter reflected increases in real value added of 7.5 percent for government, 4.5 percent for private goods-producing industries, and 0.8 percent for private services-producing industries. The leading industry contributors to the increase in real GDP were information; federal government; professional, scientific, and technical services; and durable-goods manufacturing. The leading offsets were decreases in retail trade, wholesale trade, and finance and insurance.
- Overall, 15 of 22 industry groups contributed to the increase in real GDP.
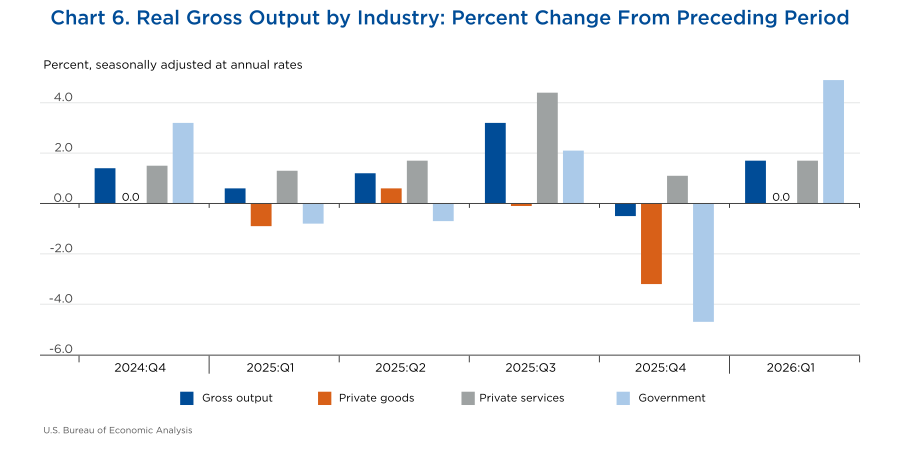
- Real gross output by industry increased 1.7 percent in the first quarter, reflecting increases of 4.9 percent for government, 1.7 percent for private services-producing industries, and less than 0.1 percent for private goods-producing industries.
- Overall, 12 of 22 industry groups contributed to the increase in real gross output.3
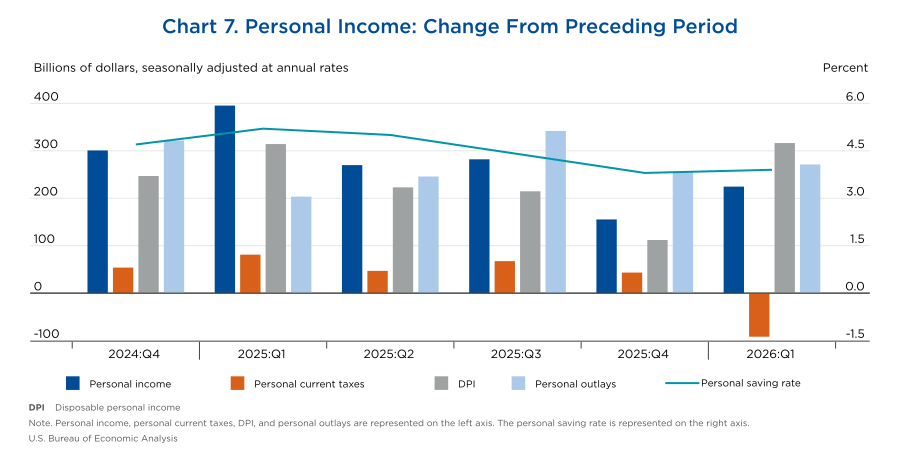
- Measured in current dollars, personal income increased $224.5 billion in the first quarter.
- Increases in compensation (led by private wages and salaries), personal current transfer receipts (mainly Social Security), and personal income receipts on assets (led by personal dividend income) were the leading conributors.
- Personal current taxes decreased $91.9 billion, disposable personal income (DPI) increased $316.4 billion, and personal outlays increased $271.2 billion.
- The personal saving rate was 3.9 percent.
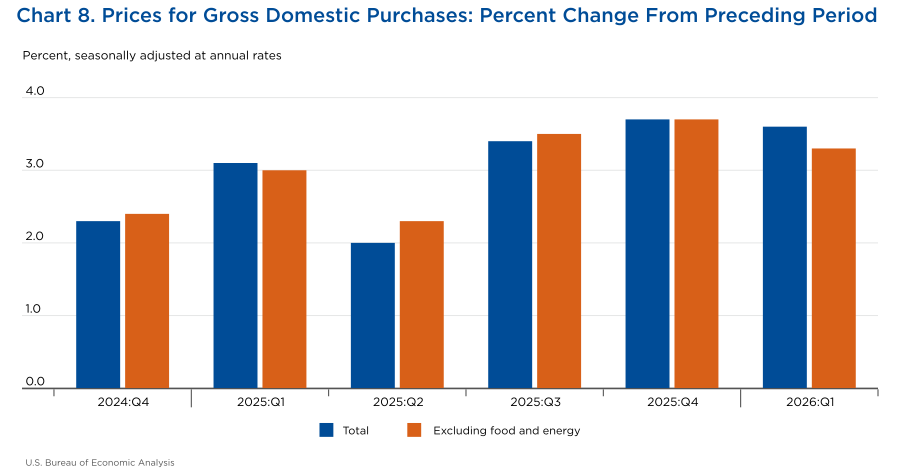
- The price index for gross domestic purchases increased 3.6 percent in the first quarter.
- Within gross domestic purchases, food prices increased 2.5 percent, and prices for energy goods and services increased 15.3 percent.
- Excluding food and energy, the price index for gross domestic purchases increased 3.3 percent.
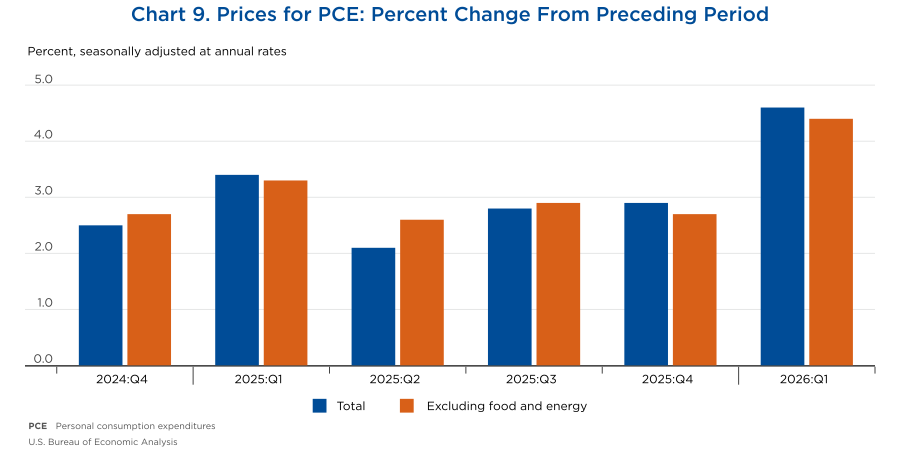
- The price index for personal consumption expenditures (PCE) increased 4.6 percent in the first quarter.
- Prices for goods increased 5.4 percent, led by increases in recreational goods and vehicles and in gasoline and other energy goods.
- Prices for services increased 4.3 percent, led by increases in financial services and insurance, health care, and housing and utilities.
- Excluding food and energy, the core PCE price index increased 4.4 percent.
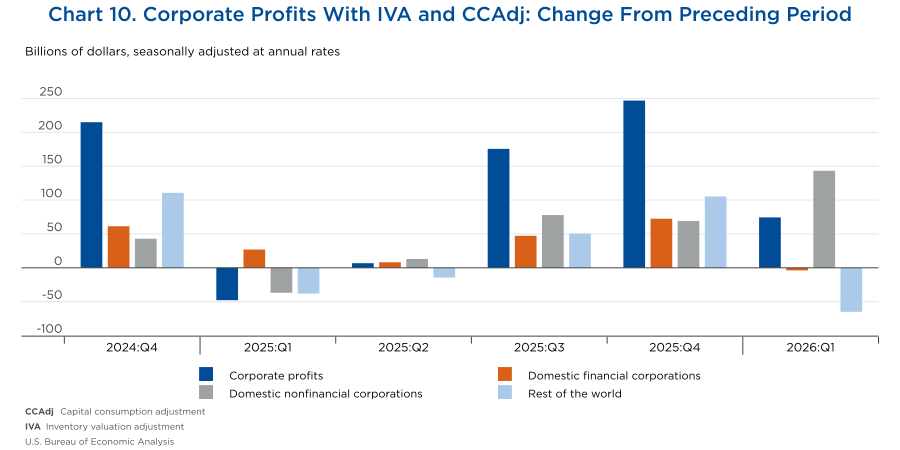
- Measured in current dollars, profits from current production (corporate profits with the inventory valuation adjustment (IVA) and the capital consumption adjustment (CCAdj)) increased $74.4 billion in the first quarter.
- Profits of domestic financial corporations decreased $3.8 billion, profits of domestic nonfinancial corporations increased $143.2 billion, and rest-of-the-world profits decreased $65.0 billion.
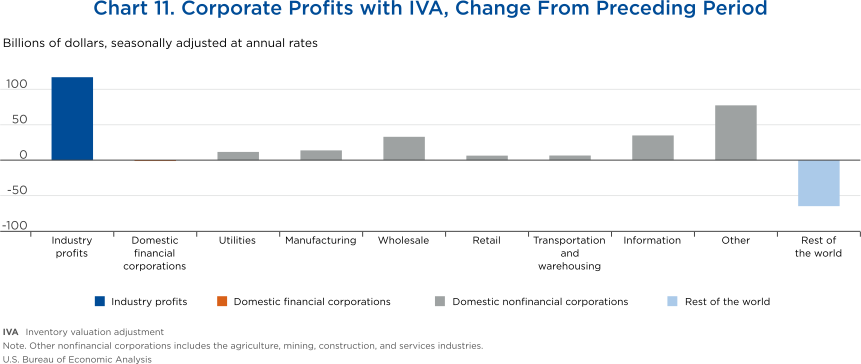
- Measured in current dollars, industry profits (corporate profits by industry with IVA) increased $117.1 billion in the first quarter.
- Domestic financial profits decreased $1.3 billion, domestic nonfinancial profits increased $183.4 billion, and rest-of-the-world profits decreased $65.0 billion.
- Real estimates are in chained (2017) dollars, and price indexes are chain-type measures. Quarterly estimates are expressed at seasonally adjusted annual rates, which reflect a rate of activity for a quarter as if it were maintained for a year.
- In this essay, “consumer spending” refers to “personal consumption expenditures,” “investment” refers to “private fixed investment” and “change in private inventories,” and “government spending” refers to “government consumption expenditures and gross investment.”
- Refer to “What is gross output by industry and how does it differ from gross domestic product (or value added) by industry?” for more information.
Suggested citation
Dorian L. Turner, “Charting the Economy: First Quarter 2026,” Survey of Current Business (July 15, 2026), https://doi.org/10.66137/VMSQ1471.
