

Government Receipts and Expenditures
First Quarter 2026
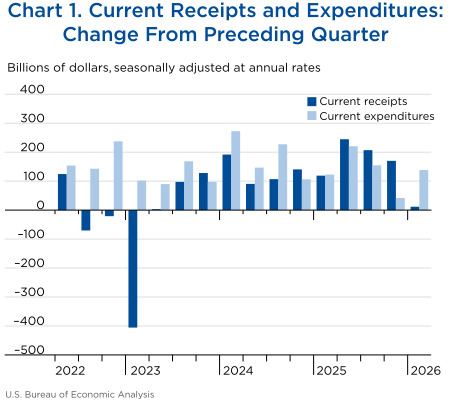
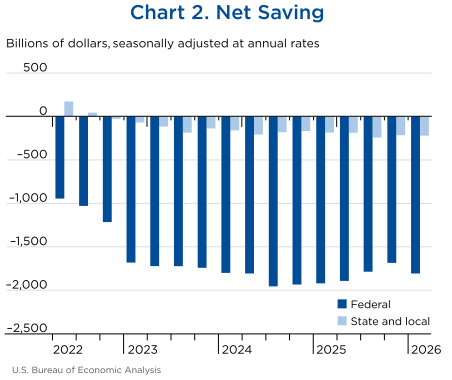
Net government saving, the difference between current receipts and current expenditures in the federal government and state and local governments, was −$2,027.4 billion in the first quarter of 2026, decreasing $126.8 billion from −$1,900.6 billion in the fourth quarter of 2025 (charts 1 and 2 and table 1).
“Net lending or net borrowing (−)” is an alternative measure of the government fiscal position. Net borrowing is the financing requirement of the government sector, and it is derived as net government saving plus the consumption of fixed capital and net capital transfers received less gross investment and net purchases of nonproduced assets.
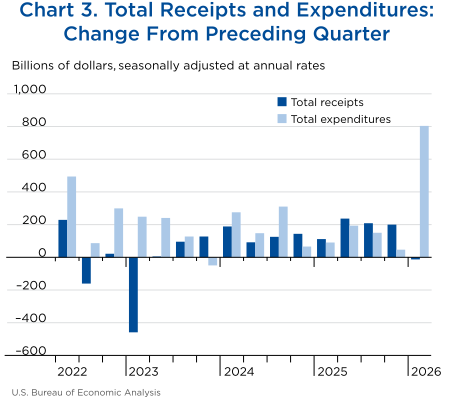
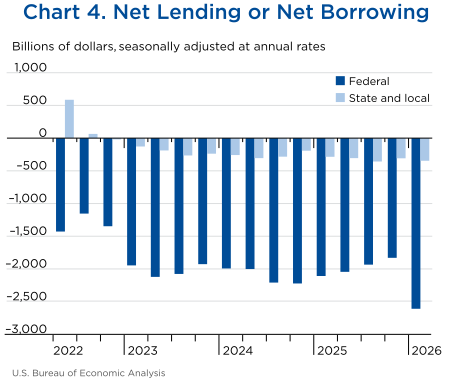
Net borrowing was $2,955.2 billion in the first quarter, increasing $816.7 billion from $2,138.5 billion in the fourth quarter (charts 3 and 4 and table 1).
| Line | Level | Change from preceding quarter | ||||
|---|---|---|---|---|---|---|
| 2026 | 2025 | 2026 | ||||
| Q1 | Q2 | Q3 | Q4 | Q1 | ||
| 1 | Current receipts | 8,942.4 | 244.7 | 207.1 | 170.1 | 11.7 |
| 2 | Current expenditures | 10,969.8 | 220.4 | 154.7 | 41.9 | 138.5 |
| 3 | Net government saving | −2,027.4 | 24.2 | 52.4 | 128.2 | −126.8 |
| 4 | Federal | −1,807.2 | 28.3 | 106.0 | 101.4 | −122.0 |
| 5 | State and local | −220.3 | −4.0 | −53.6 | 26.7 | −4.8 |
| 6 | Net lending or net borrowing (−) | −2,955.2 | 43.3 | 58.4 | 153.3 | −816.7 |
| 7 | Federal | −2,609.0 | 63.6 | 110.1 | 104.2 | −778.9 |
| 8 | State and local | −346.2 | −20.4 | −51.7 | 49.0 | −37.7 |
U.S. Bureau of Economic Analysis
Net federal government saving was −$1,807.2 billion in the first quarter, decreasing $122.0 billion from −$1,685.2 billion in the fourth quarter (table 2). In the first quarter, current receipts turned down, and current expenditures accelerated.
Federal government net borrowing was $2,609.0 billion in the first quarter, increasing $778.9 billion from $1,830.1 billion in the fourth quarter.
- Personal current taxes (line 3) turned down in the first quarter, decreasing $91.0 billion after increasing $24.5 billion in the fourth quarter, reflecting a downturn in both nonwithheld and withheld taxes. The downturn in nonwithheld taxes reflects an upturn in refunds, which are a subtraction in the calculation of nonwithheld taxes, and a downturn in declarations and final settlements. Annual changes for final settlements and refunds, which are primarily based on tax liabilities for previous years, are recorded in the first quarter of the year.
- Taxes on production and imports (line 4) turned down in the first quarter, decreasing $17.4 billion after increasing $33.1 billion in the fourth quarter. Net customs duties turned down, decreasing $18.2 billion after increasing $32.9 billion in the fourth quarter (see Capital Transfer Payments for a discussion of customs duties refunds associated with the International Emergency Economic Powers Act (IEEPA)).
- Taxes on corporate income (line 5) accelerated in the first quarter, increasing $47.9 billion after increasing $33.2 billion in the fourth quarter.
- Contributions for government social insurance (line 7) accelerated in the first quarter, increasing $35.4 billion after increasing $12.0 billion in the fourth quarter, reflecting the pattern of wages. Contributions for FICA (Federal Insurance Contributions Act) by employers, employees, and the self-employed accelerated, as did contributions for Supplementary Medical Insurance premiums paid by persons.
- Consumption expenditures (line 12) turned up in the first quarter, increasing $14.6 billion after decreasing $18.8 billion in the fourth quarter, reflecting upturns in national defense (line 13) and nondefense (line 14) consumption expenditures. The upturn in national defense consumption expenditures reflects an upturn in spending for defense services. The upturn in nondefense consumption expenditures reflects a smaller decrease in compensation of general government employees and an upturn in spending for nondefense services.
- Government social benefits to persons (line 17) accelerated in the first quarter, increasing $43.8 billion after decreasing $33.9 billion in the fourth quarter. The acceleration in the first quarter is based on an acceleration in Social Security benefits, reflecting a 2.8 percent cost-of-living adjustment in January. Partially offsetting that increase, payments of health insurance premium tax credits related to the Affordable Care Act (ACA) decreased more, reflecting a decrease in the number of people enrolled in ACA plans and per-enrollee credit changes.
- Grants-in-aid to state and local governments (line 20) turned up in the first quarter, increasing $5.6 billion after decreasing $9.5 billion in the fourth quarter, reflecting an upturn in income security grants.
- Interest payments (line 22) turned down in the first quarter, decreasing $8.6 billion after increasing $28.3 billion in the fourth quarter, reflecting a downturn in interest paid on Treasury notes and bonds.
- Subsidies (line 23) turned up in the first quarter, increasing $38.0 billion after decreasing $27.5 billion in the fourth quarter, reflecting an upturn in agricultural subsidies. The upturn reflects assistance provided to farmers through the Farmer Bridge Assistance Program, which provides temporary bridge payments to eligible producers until longer-term farm support is implemented.
- Capital transfer payments (line 33) accelerated in the first quarter, increasing $665.7 billion after increasing $7.7 billion in the fourth quarter. The acceleration reflects tariff refunds associated with the IEEPA. For more information see “How are the International Emergency Economic Powers Act tariff refunds reflected in BEA's National Economic Accounts?”.
| Line | Level | Change from preceding quarter | ||||
|---|---|---|---|---|---|---|
| 2026 | 2025 | 2026 | ||||
| Q1 | Q2 | Q3 | Q4 | Q1 | ||
| 1 | Current receipts | 5,872.5 | 211.0 | 189.9 | 104.9 | −26.0 |
| 2 | Current tax receipts | 3,645.4 | 209.0 | 157.5 | 93.4 | −60.6 |
| 3 | Personal current taxes | 2,563.1 | 33.6 | 57.7 | 24.5 | −91.0 |
| 4 | Taxes on production and imports | 449.9 | 172.0 | 63.6 | 33.1 | −17.4 |
| 5 | Taxes on corporate income | 589.6 | 0.5 | 38.8 | 33.2 | 47.9 |
| 6 | Taxes from the rest of the world | 42.8 | 2.8 | −2.6 | 2.7 | −0.1 |
| 7 | Contributions for government social insurance | 2,055.9 | 8.9 | 25.6 | 12.0 | 35.4 |
| 8 | Income receipts on assets | 92.2 | 0.4 | 2.1 | 2.1 | 1.2 |
| 9 | Current transfer receipts | 81.5 | −6.6 | 3.6 | −1.7 | −1.1 |
| 10 | Current surplus of government enterprises | −2.5 | −0.7 | 1.1 | −1.1 | −0.8 |
| 11 | Current expenditures | 7,679.7 | 182.7 | 83.9 | 3.5 | 96.0 |
| 12 | Consumption expenditures | 1,512.5 | 5.7 | 29.1 | −18.8 | 14.6 |
| 13 | National defense | 922.9 | 17.3 | 23.0 | −4.4 | 13.5 |
| 14 | Nondefense | 589.6 | −11.6 | 6.0 | −14.3 | 1.1 |
| 15 | Current transfer payments | 4,814.4 | 148.1 | 12.3 | 21.5 | 52.0 |
| 16 | Government social benefits | 3,769.1 | 131.6 | −4.7 | 33.9 | 44.6 |
| 17 | To persons | 3,729.7 | 130.5 | −5.0 | 33.9 | 43.8 |
| 18 | To the rest of the world | 39.4 | 1.1 | 0.3 | 0.0 | 0.8 |
| 19 | Other current transfer payments | 1,045.3 | 16.4 | 17.0 | −12.4 | 7.4 |
| 20 | Grants-in-aid to state and local governments | 998.3 | 18.1 | 28.4 | −9.5 | 5.6 |
| 21 | To the rest of the world | 47.0 | −1.7 | −11.4 | −2.9 | 1.8 |
| 22 | Interest payments | 1,218.9 | 16.7 | 38.3 | 28.3 | −8.6 |
| 23 | Subsidies | 133.9 | 12.2 | 4.2 | −27.5 | 38.0 |
| 24 | Net federal government saving | −1,807.2 | 28.3 | 106.0 | 101.4 | −122.0 |
| 25 | Social insurance funds | −910.1 | −103.8 | 25.8 | −20.9 | −45.6 |
| 26 | Other | −897.1 | 132.1 | 80.2 | 122.3 | −76.4 |
| Addenda: | ||||||
| 27 | Total receipts | 5,916.7 | 208.5 | 191.3 | 108.5 | −24.3 |
| 28 | Current receipts | 5,872.5 | 211.0 | 189.9 | 104.9 | −26.0 |
| 29 | Capital transfer receipts | 44.2 | −2.6 | 1.5 | 3.6 | 1.7 |
| 30 | Total expenditures | 8,525.7 | 144.9 | 81.2 | 4.3 | 754.6 |
| 31 | Current expenditures | 7,679.7 | 182.7 | 83.9 | 3.5 | 96.0 |
| 32 | Gross government investment | 474.3 | 0.9 | 4.3 | 0.9 | 0.3 |
| 33 | Capital transfer payments | 807.9 | −34.5 | 1.2 | 7.7 | 665.7 |
| 34 | Net purchases of nonproduced assets | −0.4 | 0.2 | −0.3 | 0.2 | −0.3 |
| 35 | Less: Consumption of fixed capital | 435.7 | 4.5 | 7.9 | 7.9 | 7.1 |
| 36 | Net lending or net borrowing (−) | −2,609.0 | 63.6 | 110.1 | 104.2 | −778.9 |
U.S. Bureau of Economic Analysis
Net state and local government saving was −$220.3 billion in the first quarter, decreasing $4.8 billion from −$215.5 billion in the fourth quarter. In the first quarter, current receipts decelerated, and current expenditures accelerated (table 3).
Net borrowing was $346.2 billion in the first quarter, increasing $37.7 billion from $308.5 billion in the fourth quarter.
- Personal current taxes (line 3) turned down in the first quarter, decreasing $0.9 billion after increasing $18.9 billion in the fourth quarter, reflecting a downturn in personal income taxes.
- Taxes on corporate income (line 5) decelerated in the first quarter, increasing $8.1 billion after decreasing $19.6 billion in the fourth quarter.
- Federal grants-in-aid (line 9) turned up in the first quarter, increasing $5.6 billion after decreasing $9.5 billion in the fourth quarter, reflecting an upturn in income security grants.
- Consumption expenditures (line 13) accelerated in the first quarter, increasing $44.2 billion after increasing $26.3 billion in the fourth quarter, reflecting an acceleration in spending on nondurable goods, specifically an upturn in petroleum.
- Government social benefits (line 14) accelerated in the first quarter, increasing $8.1 billion after increasing $6.5 billion in the fourth quarter, reflecting an acceleration in Medicaid spending.
- Capital transfer receipts (line 22) turned down in the first quarter, decreasing $24.0 billion after increasing $27.7 billion in the fourth quarter. Fourth-quarter receipts were boosted by a settlement.
| Line | Level | Change from preceding quarter | ||||
|---|---|---|---|---|---|---|
| 2026 | 2025 | 2026 | ||||
| Q1 | Q2 | Q3 | Q4 | Q1 | ||
| 1 | Current receipts | 4,068.2 | 51.8 | 45.6 | 55.8 | 43.2 |
| 2 | Current tax receipts | 2,758.3 | 28.6 | 16.3 | 63.8 | 33.7 |
| 3 | Personal current taxes | 656.7 | 13.3 | 9.7 | 18.9 | −0.9 |
| 4 | Taxes on production and imports | 1,907.2 | 16.7 | 22.9 | 25.4 | 26.4 |
| 5 | Taxes on corporate income | 194.4 | −1.4 | −16.3 | 19.6 | 8.1 |
| 6 | Contributions for government social insurance | 31.1 | 0.4 | 0.5 | 0.7 | 0.9 |
| 7 | Income receipts on assets | 137.7 | 1.0 | 2.7 | 3.4 | 3.4 |
| 8 | Current transfer receipts | 1,198.4 | 25.2 | 27.4 | −9.4 | 7.7 |
| 9 | Federal grants-in-aid | 998.3 | 18.1 | 28.4 | −9.5 | 5.6 |
| 10 | Other | 200.1 | 7.1 | −1.0 | 0.1 | 2.1 |
| 11 | Current surplus of government enterprises | −57.3 | −3.5 | −1.4 | −2.7 | −2.4 |
| 12 | Current expenditures | 4,288.5 | 55.8 | 99.3 | 29.0 | 48.1 |
| 13 | Consumption expenditures | 2,762.3 | 21.3 | 47.5 | 26.3 | 44.2 |
| 14 | Government social benefits | 1,264.2 | 36.5 | 54.6 | 6.5 | 8.1 |
| 15 | Interest payments | 261.3 | −2.0 | −2.9 | −3.7 | −4.2 |
| 16 | Subsidies | 0.7 | 0.0 | 0.0 | 0.0 | 0.0 |
| 17 | Net state and local government saving | −220.3 | −4.0 | −53.6 | 26.7 | −4.8 |
| 18 | Social insurance funds | 3.8 | −0.2 | 0.0 | 0.4 | 0.5 |
| 19 | Other | −224.1 | −3.7 | −53.7 | 26.4 | −5.4 |
| Addenda: | ||||||
| 20 | Total receipts | 4,187.6 | 43.8 | 48.0 | 83.5 | 19.2 |
| 21 | Current receipts | 4,068.2 | 51.8 | 45.6 | 55.8 | 43.2 |
| 22 | Capital transfer receipts | 119.4 | −7.9 | 2.3 | 27.7 | −24.0 |
| 23 | Total expenditures | 4,533.7 | 64.1 | 99.7 | 34.4 | 56.9 |
| 24 | Current expenditures | 4,288.5 | 55.8 | 99.3 | 29.0 | 48.1 |
| 25 | Gross government investment | 667.7 | 13.4 | 6.7 | 10.7 | 14.1 |
| 26 | Capital transfer payments | ... | ... | ... | ... | ... |
| 27 | Net purchases of nonproduced assets | 23.8 | 0.4 | 0.4 | 0.5 | 0.6 |
| 28 | Less: Consumption of fixed capital | 446.2 | 5.5 | 6.7 | 7.2 | 4.4 |
| 29 | Net lending or net borrowing (−) | −346.2 | −20.4 | −51.7 | 49.0 | −37.7 |
- ...
- Data not available
U.S. Bureau of Economic Analysis
Suggested citation
Adam J. DelGenio, “Government Receipts and Expenditures: First Quarter 2026,” Survey of Current Business (July 13, 2026), https://doi.org/10.66137/HMOP6956.
