

Direct Investment by Country and Industry for 2025
The U.S. Bureau of Economic Analysis (BEA) recently released statistics on direct investment by country and industry for 2025. These statistics cover both U.S. direct investment abroad (USDIA, or outward investment) and foreign direct investment in the United States (FDIUS, or inward investment). The statistics cover positions (or cumulative stock of investment), financial transactions, and income and are obtained from mandatory surveys of direct investment conducted by BEA.
The following charts present highlights of BEA's direct investment by country and industry statistics for 2025. More detail, including additional data items, can be found on the BEA website.
[Click chart to expand]
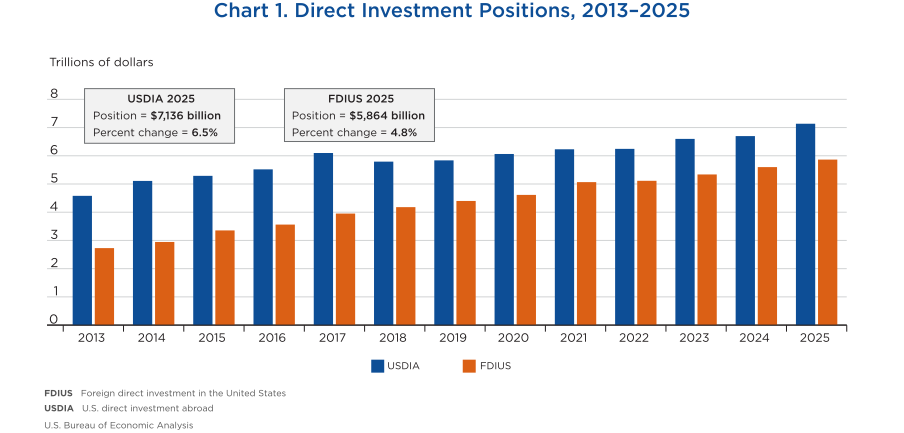
- The U.S. direct investment abroad position (shown in the blue columns) increased $438.1 billion, or 6.5 percent, to $7.1 trillion at the end of 2025 from $6.7 trillion at the end of 2024.
- The inward direct investment position (shown in the orange columns) increased $266.0 billion, or 4.8 percent, to $5.9 trillion at the end of 2025 from $5.6 trillion at the end of 2024.
[Click chart to expand]
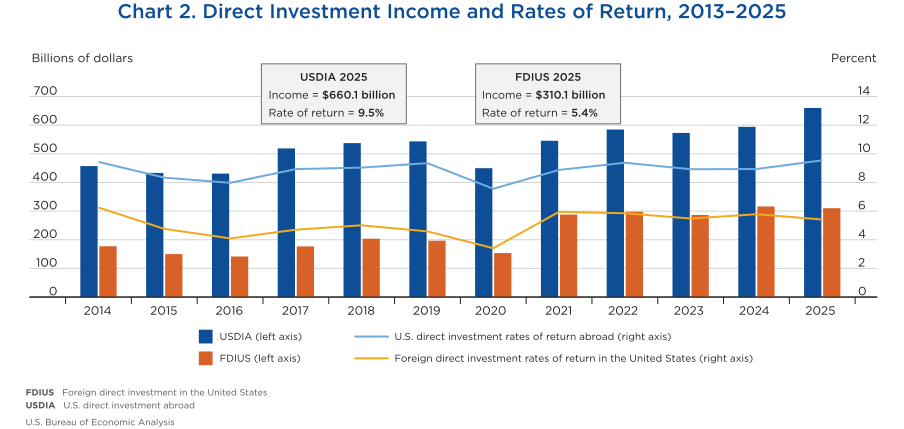
- In 2025, U.S. multinationals earned $660.1 billion on their investments abroad (shown in the blue columns), up from $594.1 billion in 2024.
- Foreign multinationals earned $310.1 billion on their U.S. investments in 2025 (shown in the orange columns), down from $316.2 billion in 2024.
- The rate of return for outward investment was 9.5 percent in 2025 (shown on the scale on the right), while the inward rate of return was 5.4 percent.
[Click chart to expand]
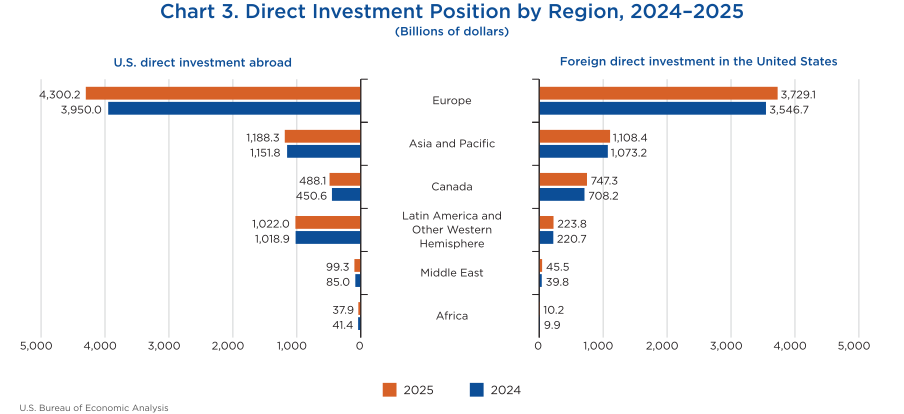
- The value of U.S. direct investment abroad (shown on the left) increased in most regions in 2025 but was led by investment in Europe, where it increased $350.2 billion.
- The value of foreign direct investment in the United States (shown on the right) saw increases for every region in 2025. The direct investment position from European countries increased $182.4 billion in 2025.
- Europe was the largest source and destination of U.S. direct investment, accounting for 60 percent of U.S. direct investment position abroad and 64 percent of foreign direct investment position in the United States.
[Click chart to expand]
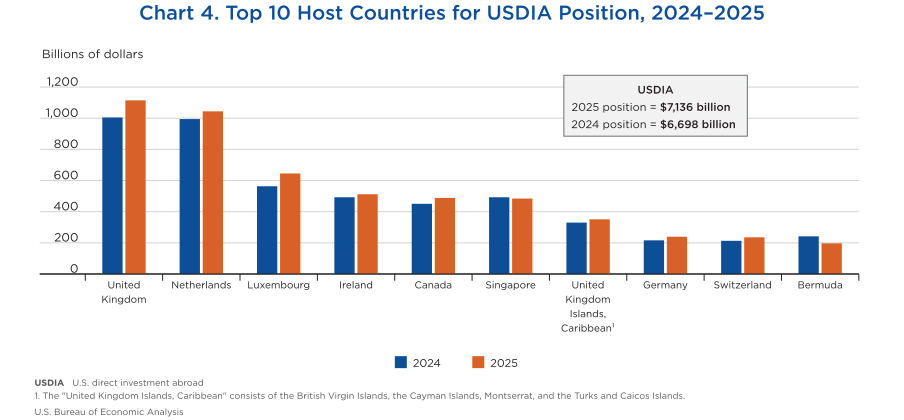
- The top 10 host countries accounted for nearly three-quarters of the total U.S. direct investment abroad position in 2025.
- The U.S. direct investment position abroad was the largest in the United Kingdom ($1.11 trillion), followed by the Netherlands ($1.04 trillion) and Luxembourg ($645.3 billion).
- The top three countries remained the same as the prior year, but Singapore and Bermuda both saw declines in their investment positions, leading to Canada, Germany, and Switzerland all moving up in the rankings for 2025.
[Click chart to expand]
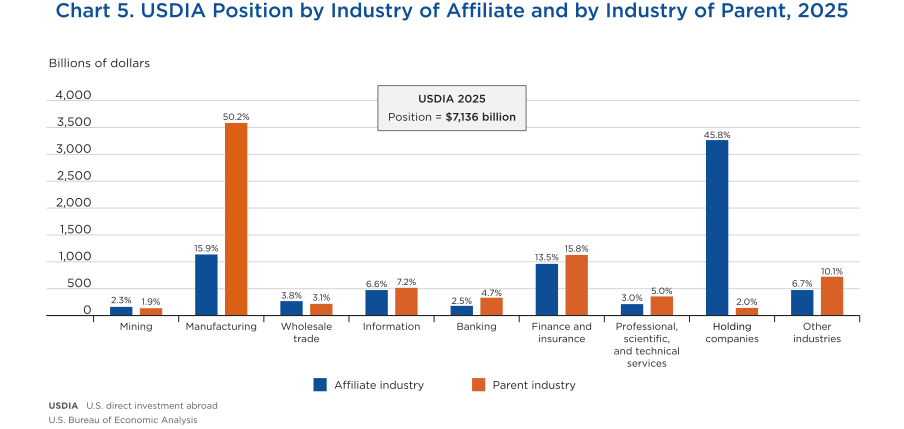
- U.S. parent companies invest in a variety of industries. Based on the industry of the foreign affiliate (shown in the blue columns), nearly half of the overall U.S. direct investment position abroad is in holding companies. These companies own other foreign affiliates that operate in a variety of industries.
- By industry of the U.S. parent (shown in the orange columns), investment by manufacturing multinationals accounted for 50.2 percent of the position, followed by multinationals in finance and insurance (15.8 percent).
[Click chart to expand]
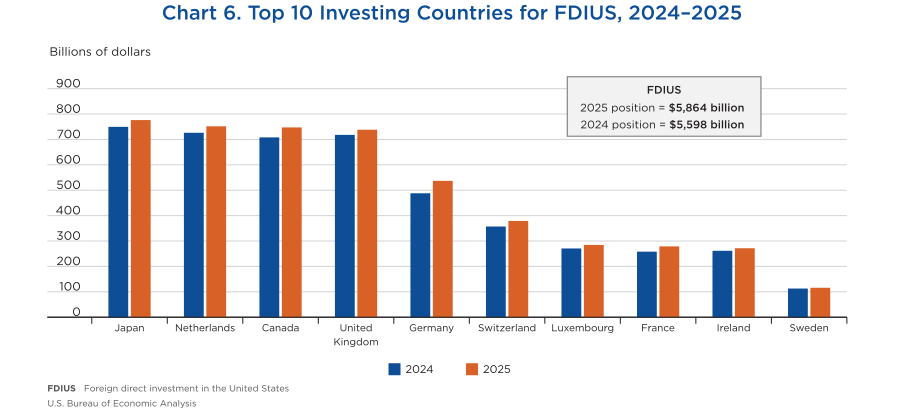
- The top 10 investing countries accounted for 83.2 percent of the foreign direct investment position in the United States, with the top five investing countries accounting for more than half of the total position.
- Japan was the top investing country in 2025, with a position of $776.3 billion.
- Germany saw the largest increase in position between 2024 and 2025, increasing $49.0 billion, or 10.0 percent.
[Click chart to expand]
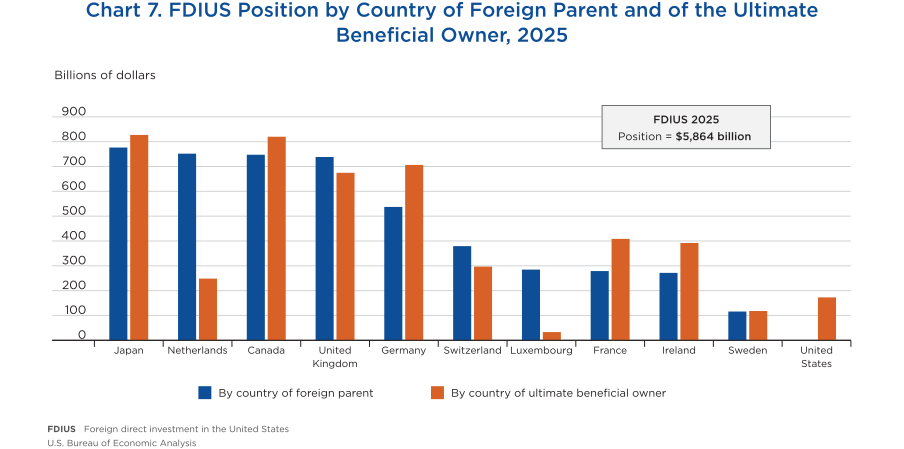
- Multinational enterprises can have complex ownership structures. To provide a more complete picture of these structures, BEA produces two sets of statistics on the ownership of foreign direct investment in the United States. The first, by country of foreign parent, focuses on the country of the immediate investor. The second, by country of the ultimate beneficial owner (UBO), shows where the ultimate owner of the U.S. affiliate is located.
- Multinationals from Japan tend to own their U.S. affiliates directly, and the position by country of foreign parent, $776.3 billion, and by country of UBO, $827.1 billion, are relatively close in value.
- When the orange column is significantly higher than the blue column, such as with Germany, multinationals from these countries are passing their investments through other entities in the ownership chain before entering the United States. The German position by country of foreign parent, $537.0 billion, is much lower than by country of UBO, $706.2 billion.
- When the blue column is significantly higher than the orange column, such as Luxembourg and the Netherlands, companies in these countries often act as pass-through entities for multinationals based in other countries. The Dutch position by country of foreign parent, $751.8 billion, is much greater than the position by country of UBO, $248.4 billion.
- The United States appears as a country of UBO when foreign direct investment ownership chains are ultimately owned by an entity in the United States. In 2025, the United States position by country of UBO was $172.6 billion.
[Click chart to expand]
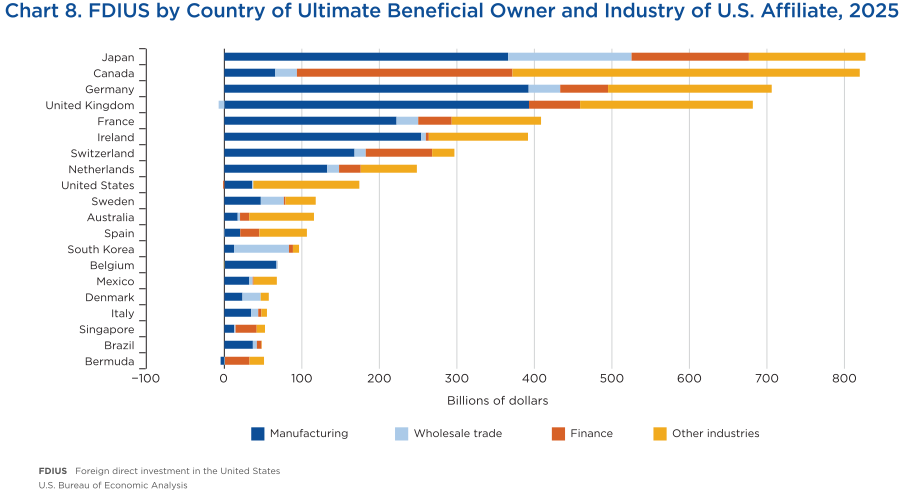
- By country of UBO, the top 10 countries accounted for 79.5 percent of the foreign direct investment position in the United States. Japan had the largest position, with $827.1 billion in 2025, followed by Canada ($819.8 billion) and Germany ($706.2 billion).
- Multinationals from Ireland, Germany, Switzerland, and the United Kingdom often invest in the U.S. manufacturing sector, with manufacturing affiliates accounting for more than 50 percent of their investments, while Canadian multinationals have a larger proportion of their investment in finance-related industries, comprising a third of their overall position.
[Click chart to expand]
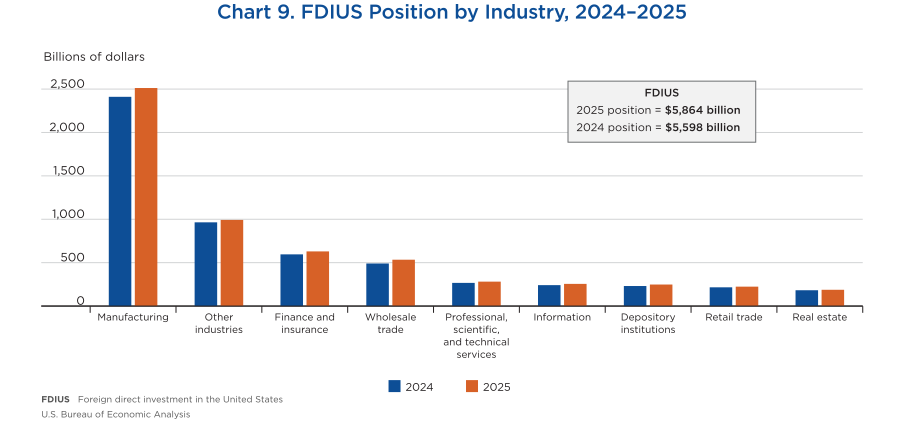
- In 2025, manufacturing accounted for the largest proportion of the foreign direct investment in the United States, with 42.8 percent, or $2.5 trillion.
- Finance and insurance was second, with 10.7 percent, or $629.7 billion, and wholesale trade was third, with 9.1 percent, or $534.0 billion.
- Manufacturing saw the largest increase in investment position, increasing $101.5 billion in 2025.
[Click chart to expand]
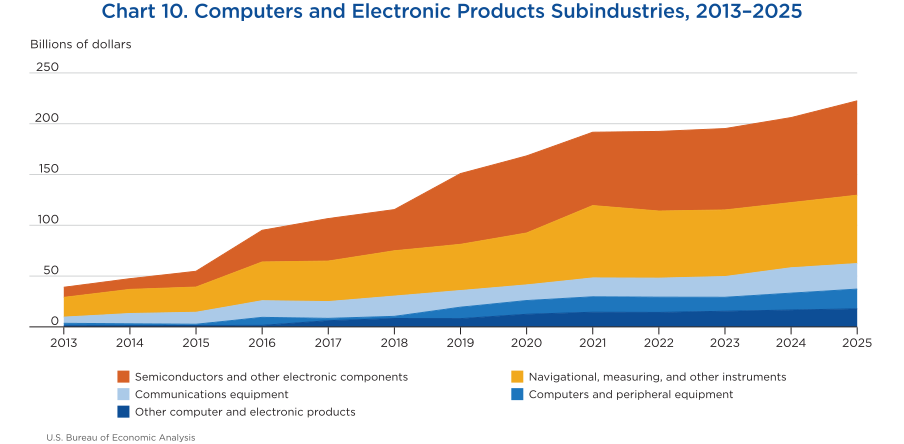
- Investment in computers and electronic products manufacturing has grown from $39.0 billion in 2013 to $222.5 billion in 2025.
- Computers and electronic products manufacturing has four major subindustries: (1) semiconductors and other electronic components; (2) navigational, measuring, and other instruments; (3) communications equipment; and (4) computers and peripheral equipment.
- Semiconductors and other electronic components was the largest contributor to the sector, increasing from 25.5 percent in 2013 to 41.7 percent in 2025.
Suggested citation
Ryan Smith and Josefina Colantoni, “Direct Investment by Country and Industry for 2025,” Survey of Current Business (September 10, 2026), https://doi.org/10.66137/UCKA7957.
