

The 2026 Annual Update of the National Economic Accounts
The U.S. Bureau of Economic Analysis (BEA) released its annual update of the National Economic Accounts (NEAs), which include the National Income and Product Accounts (NIPAs) and the Industry Economic Accounts, on September 30, 2026.1 With improvements in concurrent production and publication of BEA statistics, the release of the annual update of the Regional Economic Accounts (REAs) occurred on the same day for the first time. Improvements incorporated as part of the NEA annual update impacted all three sets of accounts. The update period for NEA statistics was the first quarter of 2021 through the first quarter of 2026.
The update of the NEAs resulted in revisions to gross domestic product (GDP), GDP by industry, gross domestic income (GDI), and related components. The reference year for index numbers and chained-dollar estimates remains 2017.
The impacts of the annual update on the NIPA and industry estimates are summarized in the tables and charts provided in this article. Refer to “Information on 2026 Annual Updates to the National, Industry, State, and County Statistics” for additional background materials.
The updated NIPA and industry estimates reflect the incorporation of newly available and revised source data, the adoption of improved estimation methods, and, for quarterly and monthly measures, the incorporation of updated seasonal adjustment factors.
Major source data incorporated
The major source data incorporated into the NEAs as part of this year's update are summarized in table 1, and additional information on the NIPA components affected by the incorporation of newly available and revised source data is provided in the table “NIPA Revisions: Components Detail and Major Source Data and Conceptual Changes Incorporated, 2021–2025.”
Source data that affected the estimates include the following:
BEA incorporated new data from the U.S. Census Bureau (Census) Annual Integrated Economic Survey (AIES). In past updates, BEA incorporated source data from several Census annual surveys, including the Annual Retail Trade Survey, the Annual Wholesale Trade Survey, the Service Annual Survey (SAS), and the Annual Survey of Manufactures. These surveys are now part of the AIES, which replaced and integrated these surveys into one. Census began releasing some data from the 2023 AIES data collection cycle in summer 2025, but the detail required for the NEAs was not available in time to incorporate into last year's annual update.
For this year's update, BEA evaluated the 2023 AIES and incorporated data as appropriate on a best-change basis. The updated data impacted a range of estimates, including consumer spending, private fixed investment in equipment, intellectual property products, and residential improvements, as well as private gross output.2 For series where breaks in the continuity of data or other challenges prevented BEA from using the AIES data, BEA used alternate data sources based primarily on higher frequency survey data. The “NIPA Revisions” table describes the alternate data sources used for the key components of GDP. AIES data for 2024 were not available in time for BEA to evaluate and incorporate into this year's update.
- Revised Census Quarterly Services Survey (QSS) data for 2024 and 2025 impacted estimates of consumer spending for services and estimates of private fixed investment in intellectual property products and equipment as well as gross output for private services-producing industries.
- Newly incorporated Internal Revenue Service (IRS) Statistics of Income (SOI) tabulations of tax returns for 2023 for corporations, sole proprietorships, and partnerships affected estimates of corporate profits, proprietors' income, and net interest, as well as GDP by industry estimates. Preliminary IRS data for 2024 was not available.
- Revised U.S. Bureau of Labor Statistics (BLS) Quarterly Census of Employment and Wages (QCEW) data for 2021–2025 impacted estimates of private and government compensation.
- Revised U.S. Department of Agriculture farm statistics for 2021–2025 impacted estimates of farm output, inventory investment, and proprietors' income.
- Revised BEA International Transactions Accounts (ITAs) data for 2021–2025 impacted estimates of exports and imports of goods and services and income flows with the rest of the world.3
- Revised Census Annual Surveys of State and Local Government Finances (GF) for fiscal years 2022–2023 and newly available GF data for fiscal year 2024 impacted estimates of state and local government spending.
- New federal government budget data from the U.S. Office of Management and Budget for fiscal year 2026 and revised data for fiscal year 2025 impacted estimates of federal government spending.
| Agency | Data | Years covered and vintage |
|---|---|---|
| U.S. Census Bureau | Annual Integrated Economic Survey | 2023 (new) |
| Monthly indicators of manufactures, merchant wholesale trade, and retail trade | 2023–2025 (revised) | |
| Quarterly Services Survey | 2024 and 2025 (revised) | |
| Annual Surveys of State and Local Government Finances | Fiscal years 2022–2023 (revised) Fiscal year 2024 (new) |
|
| Value of Construction Put in Place Survey | 2024 and 2025 (revised) | |
| American Community Survey | 2024 (new) | |
| Office of Management and Budget | Federal budget | Fiscal year 2025 (revised) |
| Fiscal year 2026 (new) | ||
| Internal Revenue Service | Statistics of Income tabulations of tax returns for corporations, sole proprietorships, and partnerships | 2023 (new) |
| U.S. Bureau of Labor Statistics | Quarterly Census of Employment and Wages | 2021–2025 (revised) |
| Occupational Employment and Wage Statistics | 2025 (new) | |
| U.S. Department of Agriculture | Farm statistics | 2021–2025 (revised) |
| U.S. Bureau of Economic Analysis | International Transactions Accounts | 2021–2025 (revised) |
Note. Years are calendar years unless fiscal years are specified.
U.S. Bureau of Economic Analysis
Methodology improvements with this year's annual update focus mainly on the deflation measures for several consumer spending components, notably:
-
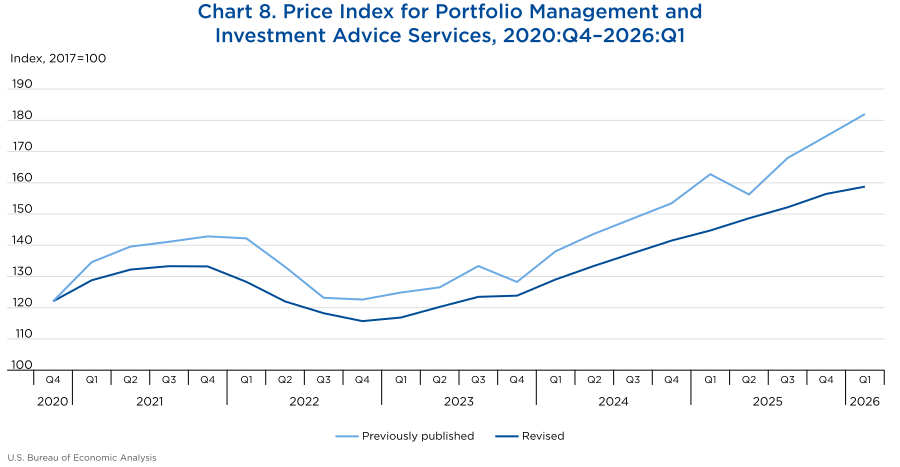
BEA improved the deflation methodology for consumer spending on portfolio management and investment advice services to better reflect the timing and quantity of services consumed. The quantity of portfolio management services will be derived using a BLS Current Employment Statistics (CES)-based quantity extrapolator from the portfolio management and investment advice industry.
The previous methodology used revenue data for portfolio management and investment advice services from Census to derive current-dollar estimates for consumer spending. A BLS producer price index (PPI) for portfolio management and investment advice was used for deflation. Census revenue and BLS PPI data for portfolio management and investment advice services should capture the effects of asset value changes and fee rate changes similarly. However, the observed movement for these two series has not been consistent and has driven uncorroborated volatility in the resultant quantity estimates.
The improved method estimates the quantity of services directly by extrapolation using BLS CES employment and hours. Current-dollar estimates will continue to be derived using Census data, and the price index will be derived implicitly.4 This approach reduces the uncorroborated volatility of monthly and quarterly chained-dollar estimates and better measures the long-term change in services consumed.
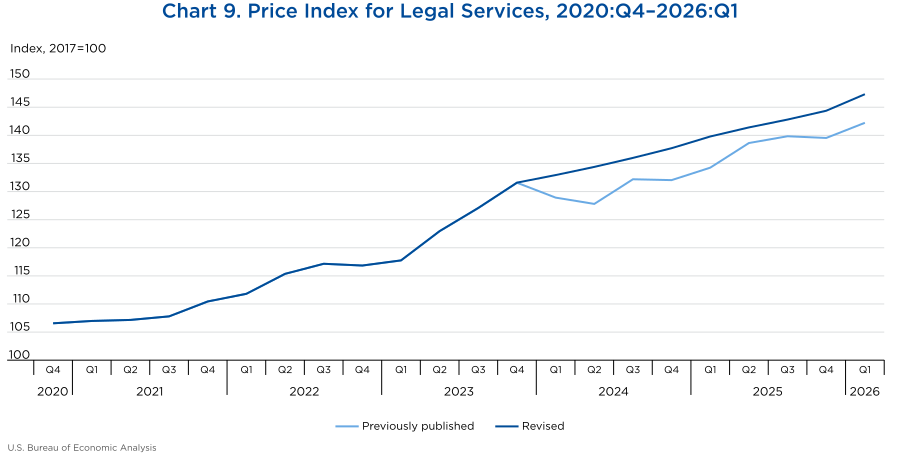
BEA replaced the consumer price index (CPI) for legal services with an improved composite price index based on PPIs for legal services.5 This CPI was mostly unpublished since 2023 and was last published for the month of September 2024. BEA had been using unpublished CPI values provided by BLS, although these values did not meet BLS publication quality guidelines and have recently exhibited erratic changes that cannot be corroborated and are not consistent with other source data.
To address these issues, BEA replaced the CPI for legal services with a new composite price index derived from the following PPIs:
- Civil negligence legal services
- “Other legal services”
- Wills, estate planning, and probate
- Real estate legal services
- Labor and employment legal services
The weights used to combine these PPIs were based on unpublished detailed personal consumption expenditures (PCE) items within BEA’s benchmark Input-Output Accounts.
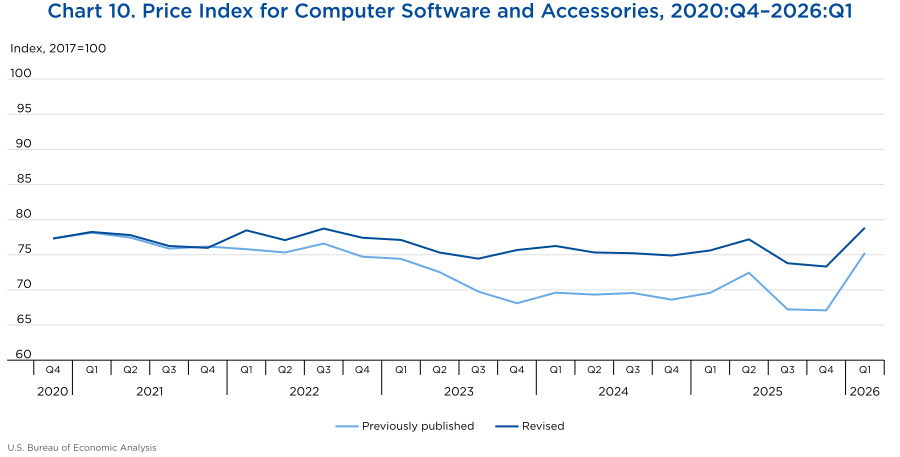
BEA replaced the deflator for consumer spending on computer software and accessories to better reflect the composition of products included in this category. Recent changes in the CPI for computer software and accessories highlighted the composition of the CPI relative to the composition of the NIPA category. The NIPA consumer spending category for computer software and accessories includes items that are outside the scope of the CPI, such as game software publishing and application service provisioning, and excludes accessories, such as flash drives and blank media, which are within the scope of the CPI.
To better reflect the composition of this NIPA category, BEA now uses a composite price index that combines the CPI for computer software and accessories with the PPI for game software publishing and the PPI for hosting, ASP, and other IT infrastructure provisioning services. The weights used to combine these three prices were based on unpublished detailed PCE items within BEA’s benchmark Input-Output Accounts.
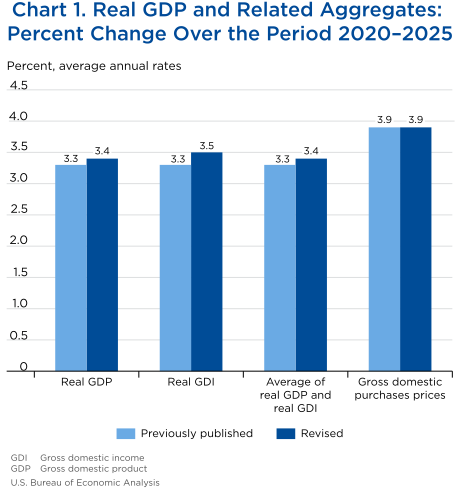
In general, the picture of the economy shown by the updated estimates is similar to the picture previously published (table 2). Over the recent period from 2020 to 2025, the average annual rate of change in real GDP was 3.4 percent, revised up 0.1 percentage point from the previous estimate (chart 1).
Details on the revisions to the percent change in real GDP are presented in table 3A, and details on the contributions to those revisions are presented in table 3B. Details on revisions and contributions to revisions for each expenditure component of real GDP are presented in appendix A (tables A1–A12). As noted above, the major source data incorporated for each component of GDP and GDI are presented in the “NIPA Revisions” table.
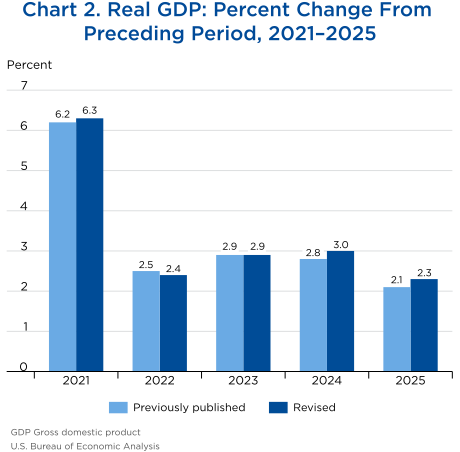
The percent change in real GDP was revised up for 2021, 2024, and 2025, was revised down for 2022, and was the same as previously estimated for 2023 (chart 2).
- For 2021, the change in real GDP was revised up by 0.1 percentage point, from 6.2 percent to 6.3 percent, primarily reflecting a downward revision to imports (which are a subtraction in the calculation of GDP) and upward revisions to state and local government spending and consumer spending.6 The revision to imports reflect a downward revision to services (led by transport) primarily based on revised data from BEA's ITAs. The revision to state and local government spending was led by intermediate goods and services purchased based on revised Census GF data. The revision to consumer spending reflect an upward revision to services (led by portfolio management and investment advice) based on revised Federal Deposit Insurance Corporation data and previously incorporated SAS data deflated with the new implicit price based on BLS CES employment and hours.
- For 2022, the change in real GDP was revised down by 0.1 percentage point, from 2.5 percent to 2.4 percent, primarily reflecting downward revisions to consumer spending (led by travel) based on revised data from BEA's ITAs, and to state and local government spending (led by intermediate goods and services purchased) based on revised Census GF data.
- For 2023, the change in real GDP was unrevised at 2.9 percent, primarily reflecting upward revisions to state and local government spending and nonresidential fixed investment that were offset by downward revisions to consumer spending on services and to private inventory investment. The upward revision to state and local government spending (led by intermediate goods and services purchased) was based on revised Census GF data. The upward revision to nonresidential fixed investment (led by equipment, notably medical equipment and instruments) was based on Census AIES data. The downward revision to consumer spending on services (led by financial services furnished without payment) was based primarily on new IRS SOI data and revised data from the Federal Reserve Board's Financial Accounts of the United States. The downward revision to private inventory investment (led by manufacturing) was based on revised Census MSM data.
- For 2024, the change in real GDP was revised up by 0.2 percentage point, from 2.8 percent to 3.0 percent, primarily reflecting upward revisions to nonresidential fixed investment (led by structures, notably investment in commercial and health care) based on Census Value of Construction Put in Place Survey (VIP) data and state and local government spending (led by intermediate goods and services purchased) based on newly available GF data.
- For 2025, the change in real GDP was revised up by 0.2 percentage point, from 2.1 percent to 2.3 percent, primarily reflecting upward revisions to nonresidential fixed investment in structures (led by commercial and health care as well as mining exploration, shafts, and wells) and state and local government spending (led by intermediate goods and services purchased). These revisions were partly offset by an upward revision to imports (led by “other business services,” notably insurance). The revision to structures was based on revised Census VIP data and data from the American Petroleum Institute. The revision to state and local government spending was based on newly available GF data. The revision to imports was based on revised data from BEA's ITAs.
| Year | GDP | GDI1 | Average of GDP and GDI2 | Difference GDP−GDI | ||||||||
|---|---|---|---|---|---|---|---|---|---|---|---|---|
| Percent change from preceding period | Percent change from preceding period | Percent change from preceding period | Percentage points | |||||||||
| Previously published | Revised | Revision | Previously published | Revised | Revision | Previously published | Revised | Revision | Previously published | Revised | Revision | |
| 2021 | 6.2 | 6.3 | 0.1 | 6.6 | 6.7 | 0.1 | 6.4 | 6.5 | 0.1 | −0.4 | −0.4 | 0.0 |
| 2022 | 2.5 | 2.4 | −0.1 | 2.7 | 2.6 | −0.1 | 2.6 | 2.5 | −0.1 | −0.2 | −0.2 | 0.0 |
| 2023 | 2.9 | 2.9 | 0.0 | 1.7 | 2.5 | 0.8 | 2.3 | 2.7 | 0.4 | 1.2 | 0.4 | −0.8 |
| 2024 | 2.8 | 3.0 | 0.2 | 3.0 | 3.1 | 0.1 | 2.9 | 3.0 | 0.1 | −0.2 | −0.1 | 0.1 |
| 2025 | 2.1 | 2.3 | 0.2 | 2.4 | 2.8 | 0.4 | 2.2 | 2.6 | 0.4 | −0.3 | −0.5 | −0.2 |
- Gross domestic income deflated by the implicit price deflator for gross domestic product.
- A supplemental measure of U.S. economic activity that equally weights GDP and GDI.
U.S. Bureau of Economic Analysis
| Line | Series | Share of current-dollar GDP | Change from preceding period | Revision in percent change | ||||||||
|---|---|---|---|---|---|---|---|---|---|---|---|---|
| Percent | Percent | Percentage points | ||||||||||
| 2025 | 2021 | 2022 | 2023 | 2024 | 2025 | 2021 | 2022 | 2023 | 2024 | 2025 | ||
| 1 | GDP | 100.0 | 6.3 | 2.4 | 2.9 | 3.0 | 2.3 | 0.1 | −0.1 | 0.0 | 0.2 | 0.2 |
| 2 | Personal consumption expenditures | 67.6 | 8.8 | 2.9 | 2.3 | 2.9 | 2.6 | 0.0 | −0.1 | −0.3 | 0.0 | 0.0 |
| 3 | Goods | 21.0 | 11.3 | −0.7 | 1.7 | 2.7 | 2.9 | 0.0 | −0.1 | 0.0 | −0.1 | −0.3 |
| 4 | Durable goods | 7.3 | 16.3 | −2.3 | 3.7 | 3.6 | 3.4 | −0.1 | −0.3 | −0.1 | −0.3 | −0.2 |
| 5 | Nondurable goods | 13.7 | 8.6 | 0.2 | 0.6 | 2.3 | 2.6 | 0.0 | 0.0 | 0.0 | 0.0 | −0.4 |
| 6 | Services | 46.6 | 7.6 | 4.8 | 2.6 | 3.0 | 2.5 | 0.0 | −0.1 | −0.4 | 0.0 | 0.2 |
| 7 | Gross private domestic investment | 18.0 | 9.1 | 6.0 | 0.8 | 3.6 | 3.1 | 0.1 | −0.1 | 0.0 | 0.6 | 1.2 |
| 8 | Fixed investment | 18.0 | 7.4 | 2.4 | 3.7 | 3.7 | 3.6 | 0.1 | −0.1 | 0.3 | 0.7 | 0.9 |
| 9 | Nonresidential | 14.1 | 6.3 | 6.4 | 7.7 | 3.9 | 5.4 | 0.1 | −0.1 | 0.4 | 1.0 | 1.3 |
| 10 | Structures | 3.1 | −2.7 | 3.4 | 16.1 | 3.8 | −2.2 | 0.0 | −0.1 | −0.6 | 2.7 | 3.1 |
| 11 | Equipment | 5.4 | 7.2 | 2.8 | 4.9 | 3.3 | 8.8 | 0.1 | 0.0 | 2.0 | −0.2 | 0.5 |
| 12 | Intellectual property products | 5.6 | 10.4 | 11.6 | 5.6 | 4.6 | 6.8 | 0.0 | −0.1 | −0.6 | 1.1 | 1.2 |
| 13 | Residential | 3.8 | 10.7 | −8.2 | −8.1 | 3.2 | −2.7 | 0.1 | −0.1 | −0.3 | 0.0 | −0.5 |
| 14 | Change in private inventories | 0.0 | --- | --- | --- | --- | --- | --- | --- | --- | --- | --- |
| 15 | Net exports of goods and services | −3.0 | --- | --- | --- | --- | --- | --- | --- | --- | --- | --- |
| 16 | Exports | 10.8 | 6.5 | 7.6 | 2.8 | 3.6 | 2.1 | 0.0 | 0.0 | 0.0 | 0.0 | 0.5 |
| 17 | Goods | 6.8 | 7.7 | 6.0 | 1.9 | 2.1 | 1.0 | 0.0 | −0.1 | −0.3 | 0.1 | −0.8 |
| 18 | Services | 4.0 | 4.0 | 10.9 | 4.6 | 6.4 | 3.9 | 0.0 | 0.0 | 0.5 | −0.3 | 2.7 |
| 19 | Imports | 13.8 | 14.3 | 8.2 | −0.8 | 5.9 | 3.6 | −0.3 | −0.3 | 0.1 | 0.1 | 0.9 |
| 20 | Goods | 10.8 | 14.5 | 6.7 | −1.9 | 5.1 | 2.7 | 0.0 | 0.0 | 0.0 | −0.1 | 0.2 |
| 21 | Services | 3.0 | 13.0 | 15.9 | 4.1 | 9.3 | 7.1 | −2.0 | −1.2 | 0.3 | 1.1 | 3.6 |
| 22 | Government consumption expenditures and gross investment | 17.4 | 0.1 | −1.5 | 4.5 | 4.5 | 1.6 | 0.2 | −0.3 | 1.0 | 0.7 | 0.5 |
| 23 | Federal | 6.3 | 1.9 | −3.3 | 3.5 | 3.6 | −1.3 | 0.0 | 0.0 | 0.2 | −0.2 | −0.1 |
| 24 | National defense | 3.6 | −0.8 | −3.7 | 3.7 | 3.5 | 0.9 | 0.1 | 0.1 | 0.0 | −0.5 | −0.3 |
| 25 | Nondefense | 2.7 | 5.7 | −2.8 | 3.1 | 3.8 | −4.1 | 0.0 | −0.1 | 0.3 | 0.2 | 0.1 |
| 26 | State and local | 11.1 | −1.0 | −0.4 | 5.1 | 5.0 | 3.3 | 0.3 | −0.4 | 1.5 | 1.2 | 0.8 |
| Line | Series | Contributions to percent change | Revision in contributions to percent change | ||||||||
|---|---|---|---|---|---|---|---|---|---|---|---|
| 2021 | 2022 | 2023 | 2024 | 2025 | 2021 | 2022 | 2023 | 2024 | 2025 | ||
| Percent change from preceding period: | |||||||||||
| 1 | GDP | 6.3 | 2.4 | 2.9 | 3.0 | 2.3 | 0.1 | −0.1 | 0.0 | 0.2 | 0.2 |
| Percentage points: | |||||||||||
| 2 | Personal consumption expenditures | 5.87 | 1.97 | 1.56 | 1.95 | 1.77 | 0.03 | −0.07 | −0.18 | −0.05 | −0.01 |
| 3 | Goods | 2.49 | −0.16 | 0.38 | 0.59 | 0.61 | 0.00 | −0.02 | −0.01 | −0.02 | −0.07 |
| 4 | Durable goods | 1.25 | −0.19 | 0.29 | 0.27 | 0.25 | 0.00 | −0.02 | −0.01 | −0.02 | −0.02 |
| 5 | Nondurable goods | 1.24 | 0.03 | 0.09 | 0.32 | 0.36 | 0.00 | 0.00 | 0.00 | 0.00 | −0.06 |
| 6 | Services | 3.38 | 2.13 | 1.18 | 1.36 | 1.16 | 0.03 | −0.05 | −0.17 | −0.02 | 0.06 |
| 7 | Gross private domestic investment | 1.59 | 1.08 | 0.15 | 0.65 | 0.56 | 0.01 | −0.01 | 0.00 | 0.11 | 0.21 |
| 8 | Fixed investment | 1.31 | 0.43 | 0.66 | 0.67 | 0.64 | 0.02 | −0.01 | 0.05 | 0.14 | 0.17 |
| 9 | Nonresidential | 0.83 | 0.83 | 1.02 | 0.54 | 0.75 | 0.01 | −0.01 | 0.05 | 0.14 | 0.19 |
| 10 | Structures | −0.08 | 0.09 | 0.47 | 0.13 | −0.07 | 0.00 | −0.01 | −0.02 | 0.09 | 0.10 |
| 11 | Equipment | 0.37 | 0.14 | 0.25 | 0.17 | 0.45 | 0.01 | 0.00 | 0.10 | −0.01 | 0.03 |
| 12 | Intellectual property products | 0.54 | 0.60 | 0.30 | 0.25 | 0.37 | 0.00 | 0.00 | −0.03 | 0.06 | 0.06 |
| 13 | Residential | 0.47 | −0.40 | −0.37 | 0.13 | −0.11 | 0.00 | 0.00 | −0.02 | 0.00 | −0.02 |
| 14 | Change in private inventories | 0.28 | 0.65 | −0.50 | −0.02 | −0.09 | −0.01 | 0.00 | −0.04 | −0.03 | 0.03 |
| 15 | Net exports of goods and services | −1.21 | −0.35 | 0.44 | −0.42 | −0.27 | 0.04 | 0.04 | −0.01 | −0.03 | −0.06 |
| 16 | Exports | 0.67 | 0.83 | 0.32 | 0.39 | 0.23 | −0.01 | 0.00 | 0.00 | −0.01 | 0.06 |
| 17 | Goods | 0.53 | 0.45 | 0.15 | 0.15 | 0.07 | 0.00 | −0.01 | −0.02 | 0.00 | −0.06 |
| 18 | Services | 0.14 | 0.38 | 0.17 | 0.24 | 0.16 | 0.00 | 0.01 | 0.02 | −0.01 | 0.11 |
| 19 | Imports | −1.88 | −1.18 | 0.12 | −0.81 | −0.49 | 0.04 | 0.04 | −0.01 | −0.02 | −0.10 |
| 20 | Goods | −1.59 | −0.80 | 0.23 | −0.56 | −0.29 | −0.01 | 0.01 | 0.00 | 0.01 | 0.00 |
| 21 | Services | −0.29 | −0.38 | −0.11 | −0.25 | −0.20 | 0.05 | 0.03 | −0.01 | −0.02 | −0.10 |
| 22 | Government consumption expenditures and gross investment | 0.02 | −0.26 | 0.76 | 0.77 | 0.28 | 0.04 | −0.04 | 0.17 | 0.12 | 0.09 |
| 23 | Federal | 0.13 | −0.22 | 0.22 | 0.23 | −0.08 | 0.00 | 0.00 | 0.01 | −0.01 | 0.00 |
| 24 | National defense | −0.03 | −0.14 | 0.13 | 0.13 | 0.03 | 0.01 | 0.00 | 0.00 | −0.01 | −0.01 |
| 25 | Nondefense | 0.17 | −0.08 | 0.08 | 0.10 | −0.11 | 0.00 | 0.00 | 0.00 | 0.00 | 0.01 |
| 26 | State and local | −0.12 | −0.04 | 0.55 | 0.54 | 0.37 | 0.03 | −0.04 | 0.17 | 0.13 | 0.10 |
Note. Contributions are from National Income and Product Accounts table 1.1.2.
U.S. Bureau of Economic Analysis
Prices
Revisions to BEA's various price measures, such as gross domestic purchases, GDP, and the PCE price index, were small and reflect revised and newly available source data, updated methodologies, and, for the most recent year (2025), the regular incorporation of annual weights (tables 4A and 4B). Prices for gross domestic purchases—a measure of the prices paid by consumers, businesses, and governments—increased at an average annual growth rate of 3.9 percent over the recent period from 2020 to 2025, the same as previously published (chart 1). The revisions to the percent change in prices and price contributions are presented in tables 4A and 4B, respectively. Revisions to the prices impacted by the methodology changes noted above are presented in charts 8 through 10 on a quarterly basis.
| Line | Series | Change from preceding period | Revision in percent change | |||||||||
|---|---|---|---|---|---|---|---|---|---|---|---|---|
| Percent | Percentage points | |||||||||||
| 2021 | 2022 | 2023 | 2024 | 2025 | 2021 | 2022 | 2023 | 2024 | 2025 | |||
| 1 | Gross domestic purchases | 4.2 | 6.9 | 3.5 | 2.5 | 2.4 | 0.0 | 0.1 | 0.1 | 0.1 | −0.2 | |
| 2 | PCE | 4.0 | 6.6 | 3.8 | 2.6 | 2.6 | −0.1 | 0.1 | 0.0 | 0.0 | 0.0 | |
| 3 | Goods | 5.0 | 8.7 | 1.3 | −0.4 | 0.7 | 0.1 | 0.1 | 0.1 | 0.0 | 0.0 | |
| 4 | Durable goods | 5.6 | 6.7 | −0.5 | −1.9 | 0.4 | 0.1 | 0.2 | 0.2 | 0.2 | 0.0 | |
| 5 | Nondurable goods | 4.6 | 9.9 | 2.3 | 0.5 | 0.8 | 0.0 | 0.0 | 0.0 | 0.0 | 0.0 | |
| 6 | Services | 3.6 | 5.5 | 5.1 | 4.1 | 3.5 | −0.1 | 0.0 | 0.0 | 0.0 | 0.0 | |
| 7 | Gross private domestic investment | 3.4 | 7.6 | 2.9 | 1.9 | 1.6 | 0.0 | 0.0 | 0.1 | 0.3 | −0.3 | |
| 8 | Fixed investment | 3.6 | 7.9 | 3.1 | 1.9 | 1.6 | 0.0 | 0.1 | 0.1 | 0.2 | −0.3 | |
| 9 | Nonresidential | 1.1 | 6.0 | 3.3 | 1.6 | 1.2 | −0.1 | 0.0 | 0.1 | 0.2 | −0.3 | |
| 10 | Structures | 3.3 | 16.3 | 5.7 | 0.7 | 1.1 | 0.0 | 0.0 | 0.5 | 0.9 | 0.2 | |
| 11 | Equipment | 0.4 | 6.1 | 4.5 | 2.1 | 2.3 | 0.0 | −0.1 | 0.0 | 0.0 | 0.1 | |
| 12 | Intellectual property products | 0.7 | 1.0 | 0.8 | 1.7 | 0.3 | 0.0 | 0.1 | 0.0 | 0.0 | −0.8 | |
| 13 | Residential | 11.2 | 13.3 | 2.6 | 3.1 | 3.1 | 0.0 | 0.0 | 0.0 | 0.2 | 0.0 | |
| 14 | Change in private inventories | --- | --- | --- | --- | --- | --- | --- | --- | --- | --- | |
| 15 | Government consumption expenditures and gross investment | 5.5 | 7.3 | 2.7 | 2.6 | 2.6 | 0.1 | 0.0 | −0.1 | 0.2 | −0.9 | |
| 16 | Federal | 3.2 | 5.7 | 4.1 | 3.1 | 4.3 | −0.1 | −0.1 | −0.1 | −0.1 | −0.9 | |
| 17 | National defense | 3.5 | 6.2 | 4.1 | 3.5 | 3.9 | −0.2 | −0.1 | 0.0 | −0.2 | −0.5 | |
| 18 | Nondefense | 2.9 | 5.1 | 4.2 | 2.7 | 4.8 | 0.0 | 0.0 | 0.0 | 0.1 | −1.6 | |
| 19 | State and local | 6.9 | 8.2 | 1.9 | 2.3 | 1.7 | 0.3 | 0.0 | 0.0 | 0.4 | −0.8 | |
| Addenda: | ||||||||||||
| 20 | Gross domestic purchases | |||||||||||
| 21 | Food | 3.0 | 10.2 | 4.8 | 1.4 | 1.9 | 0.0 | 0.0 | 0.0 | 0.0 | −0.1 | |
| 22 | Energy goods and services | 20.5 | 25.2 | −5.7 | −2.1 | −0.5 | 0.0 | 0.0 | −0.1 | 0.0 | −0.1 | |
| 23 | Excluding food and energy | 3.9 | 6.2 | 3.7 | 2.7 | 2.5 | 0.0 | 0.0 | 0.0 | 0.1 | −0.3 | |
| 24 | Personal consumption expenditures | |||||||||||
| 25 | PCE excluding food and energy1,2 | 3.5 | 5.4 | 4.2 | 2.9 | 2.8 | −0.1 | 0.1 | 0.0 | 0.0 | 0.0 | |
| 26 | PCE excluding food, energy, and housing1,2 | 3.7 | 5.3 | 3.5 | 2.4 | 2.5 | −0.1 | 0.1 | 0.0 | 0.0 | −0.1 | |
| 27 | Energy goods and services2 | 20.7 | 25.7 | −5.5 | −2.1 | −0.4 | 0.0 | 0.0 | 0.0 | 0.0 | −0.1 | |
| 28 | PCE services excluding energy and housing2 | 3.8 | 5.0 | 4.5 | 3.7 | 3.3 | −0.2 | 0.0 | 0.1 | 0.0 | 0.0 | |
| 29 | Housing | 2.5 | 5.9 | 7.6 | 5.3 | 3.9 | 0.0 | 0.0 | 0.0 | −0.1 | 0.0 | |
| 30 | GDP | 4.5 | 7.2 | 3.7 | 2.6 | 2.6 | 0.0 | 0.1 | 0.0 | 0.1 | −0.2 | |
| 31 | Exports of goods and services | 11.5 | 9.9 | −1.4 | 1.0 | 1.7 | 0.0 | 0.1 | 0.1 | 0.1 | 0.1 | |
| 32 | Imports of goods and services | 7.2 | 7.2 | −2.1 | 0.8 | 0.3 | 0.0 | 0.0 | −0.1 | 0.0 | −0.2 | |
- GDP
- Gross domestic product
- PCE
- Personal consumption expenditures
- Food consists of food and beverages purchased for off-premises consumption; food services, which include purchased meals and beverages, are not classified as food..
- Consists of gasoline and other energy goods and of electricity and gas services.
| Line | Series | Contributions to percent change | Revision in contributions to percent change | |||||||||
|---|---|---|---|---|---|---|---|---|---|---|---|---|
| 2021 | 2022 | 2023 | 2024 | 2025 | 2021 | 2022 | 2023 | 2024 | 2025 | |||
| Percent change from preceding period: | ||||||||||||
| 1 | Gross domestic purchases | 4.2 | 6.9 | 3.5 | 2.5 | 2.4 | 0.0 | 0.1 | 0.1 | 0.1 | −0.2 | |
| Percentage points: | ||||||||||||
| 2 | PCE | 2.63 | 4.30 | 2.52 | 1.72 | 1.70 | −0.05 | 0.01 | 0.03 | 0.00 | −0.04 | |
| 3 | Goods | 1.08 | 1.92 | 0.29 | −0.08 | 0.14 | 0.00 | 0.02 | 0.02 | 0.01 | −0.01 | |
| 4 | Durable goods | 0.43 | 0.53 | −0.04 | −0.14 | 0.03 | 0.00 | 0.02 | 0.02 | 0.02 | 0.00 | |
| 5 | Nondurable goods | 0.65 | 1.39 | 0.33 | 0.06 | 0.11 | 0.00 | 0.00 | 0.00 | 0.00 | 0.00 | |
| 6 | Services | 1.55 | 2.38 | 2.23 | 1.79 | 1.56 | −0.05 | −0.01 | 0.01 | −0.03 | −0.03 | |
| 7 | Gross private domestic investment | 0.58 | 1.33 | 0.51 | 0.33 | 0.28 | −0.01 | 0.00 | 0.01 | 0.04 | −0.04 | |
| 8 | Fixed investment | 0.63 | 1.35 | 0.54 | 0.34 | 0.28 | 0.00 | 0.01 | 0.01 | 0.04 | −0.04 | |
| 9 | Nonresidential | 0.15 | 0.77 | 0.43 | 0.22 | 0.17 | 0.00 | 0.00 | 0.01 | 0.04 | −0.03 | |
| 10 | Structures | 0.09 | 0.42 | 0.17 | 0.02 | 0.03 | 0.00 | 0.00 | 0.01 | 0.03 | 0.00 | |
| 11 | Equipment | 0.02 | 0.30 | 0.22 | 0.11 | 0.12 | 0.00 | 0.00 | 0.00 | 0.01 | 0.01 | |
| 12 | Intellectual property products | 0.03 | 0.05 | 0.04 | 0.09 | 0.02 | −0.01 | 0.00 | 0.00 | 0.00 | −0.04 | |
| 13 | Residential | 0.48 | 0.58 | 0.11 | 0.12 | 0.12 | 0.00 | 0.00 | 0.00 | 0.01 | 0.00 | |
| 14 | Change in private inventories | −0.04 | −0.01 | −0.03 | 0.00 | 0.00 | 0.00 | 0.00 | 0.00 | 0.01 | 0.00 | |
| 15 | Government consumption expenditures and gross investment | 0.97 | 1.22 | 0.45 | 0.44 | 0.45 | 0.03 | 0.00 | −0.01 | 0.04 | −0.13 | |
| 16 | Federal | 0.22 | 0.36 | 0.25 | 0.19 | 0.26 | 0.00 | −0.01 | 0.00 | −0.01 | −0.06 | |
| 17 | National defense | 0.14 | 0.22 | 0.14 | 0.12 | 0.14 | 0.00 | 0.00 | 0.00 | −0.01 | −0.02 | |
| 18 | Nondefense | 0.08 | 0.14 | 0.11 | 0.07 | 0.12 | 0.00 | 0.00 | 0.00 | 0.00 | −0.04 | |
| 19 | State and local | 0.75 | 0.86 | 0.20 | 0.25 | 0.19 | 0.03 | 0.01 | 0.00 | 0.05 | −0.07 | |
| Addenda: | ||||||||||||
| 20 | Gross domestic purchases: | |||||||||||
| 21 | Food | 0.16 | 0.52 | 0.24 | 0.07 | 0.09 | 0.00 | 0.00 | 0.00 | 0.00 | −0.01 | |
| 22 | Energy goods and services | 0.46 | 0.65 | −0.17 | −0.06 | −0.01 | 0.00 | 0.00 | 0.00 | 0.00 | 0.00 | |
| 23 | Excluding food and energy | 3.56 | 5.70 | 3.41 | 2.48 | 2.35 | −0.03 | 0.02 | 0.03 | 0.07 | −0.20 | |
| 24 | Personal consumption expenditures: | |||||||||||
| 25 | PCE excluding food and energy1,2 | 3.06 | 4.73 | 3.71 | 2.60 | 2.46 | −0.08 | 0.02 | 0.05 | 0.00 | −0.04 | |
| 26 | PCE excluding food, energy, and housing1,2 | 2.66 | 3.83 | 2.56 | 1.77 | 1.84 | −0.07 | 0.01 | 0.05 | 0.00 | −0.04 | |
| 27 | Energy goods and services2 | 0.72 | 1.02 | −0.25 | −0.08 | −0.01 | 0.00 | 0.00 | 0.00 | 0.00 | 0.00 | |
| 28 | PCE services excluding energy and housing2 | 1.87 | 2.48 | 2.21 | 1.86 | 1.66 | −0.08 | −0.01 | 0.01 | −0.02 | −0.04 | |
| 29 | Housing | 0.40 | 0.89 | 1.15 | 0.83 | 0.62 | 0.00 | 0.00 | 0.01 | −0.01 | 0.01 | |
- PCE
- Personal consumption expenditures
- Food consists of food and beverages purchased for off-premises consumption; food services, which include purchased meals and beverages, are not classified as food.
- Consists of gasoline and other energy goods and of electricity and gas services.
Income
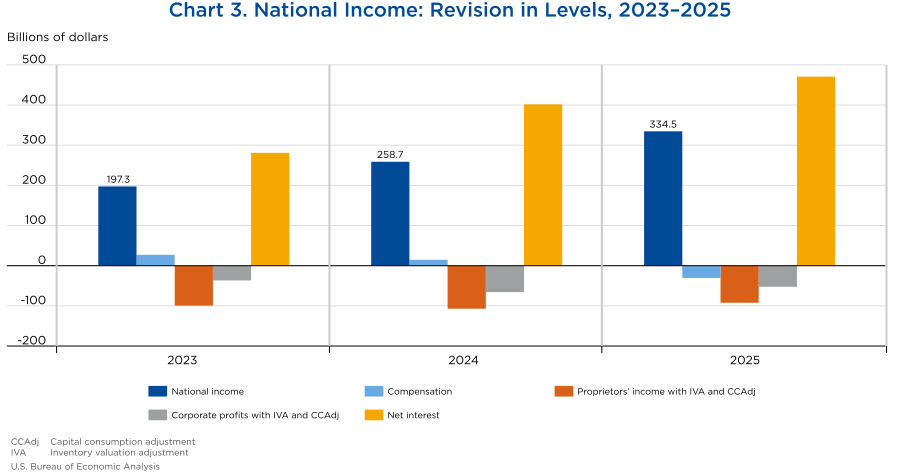
Revisions to the components of national income and GDI primarily reflect new IRS SOI data, new and revised QCEW data, revised ITA data, and data from the U.S. Department of the Treasury. Revisions are most notable for 2023–2025 (chart 3 and tables 5 and 6).
- For 2023, the upward revisions to national income and GDI primarily reflect an upward revision to net interest based on new SOI data for corporations, sole proprietorships, and partnerships. This upward revision was partly offset by a downward revision to proprietors' income based on new IRS SOI tabulations of partnership, sole proprietorship, and corporate tax return data.
- For 2024 and 2025, the upward revisions to national income and GDI primarily reflect upward revisions to net interest based on extrapolations of 2023 SOI data that were informed by Compustat interest expense data. These upward revisions were partly offset by a downward revision to proprietors' income based on extrapolated IRS SOI data and industry-specific indicators. Downward revisions to corporate profits in each year also offset the upward revisions to net interest based on revised Census Quarterly Financial Report data, regulatory agency data, and public financial reports profits data.
| Line | Series | Level | Revision in level | Revision in change | ||||||||||||
|---|---|---|---|---|---|---|---|---|---|---|---|---|---|---|---|---|
| 2021 | 2022 | 2023 | 2024 | 2025 | 2021 | 2022 | 2023 | 2024 | 2025 | 2021 | 2022 | 2023 | 2024 | 2025 | ||
| 1 | National income | 19,984.3 | 21,912.3 | 23,197.9 | 24,455.4 | 25,837.1 | 16.5 | 12.7 | 197.3 | 258.7 | 334.5 | 16.5 | −3.8 | 184.7 | 61.4 | 75.8 |
| 2 | Compensation of employees | 12,561.5 | 13,447.8 | 14,234.5 | 15,041.7 | 15,696.2 | 3.1 | 4.5 | 27.1 | 14.6 | −30.7 | 3.1 | 1.3 | 22.6 | −12.4 | −45.3 |
| 3 | Wages and salaries | 10,314.9 | 11,123.8 | 11,735.1 | 12,410.6 | 12,976.3 | −0.1 | 1.1 | 2.7 | 22.7 | 17.6 | −0.1 | 1.2 | 1.6 | 20.0 | −5.0 |
| 4 | Government | 1,544.3 | 1,621.5 | 1,730.7 | 1,851.8 | 1,927.4 | 0.0 | 0.2 | −1.2 | 2.7 | −2.8 | 0.0 | 0.2 | −1.4 | 3.9 | −5.5 |
| 5 | Other | 8,770.5 | 9,502.4 | 10,004.4 | 10,558.8 | 11,048.9 | −0.1 | 0.9 | 3.9 | 20.0 | 20.5 | −0.1 | 0.9 | 3.0 | 16.1 | 0.4 |
| 6 | Supplements to wages and salaries | 2,246.6 | 2,324.0 | 2,499.4 | 2,631.1 | 2,719.9 | 3.2 | 3.4 | 24.4 | −8.0 | −48.3 | 3.2 | 0.2 | 21.0 | −32.4 | −40.3 |
| 7 | Employer contributions for employee pension and insurance funds | 1,539.9 | 1,558.7 | 1,685.0 | 1,773.3 | 1,831.8 | 3.4 | 3.8 | 24.9 | 0.6 | −27.5 | 3.4 | 0.4 | 21.1 | −24.2 | −28.1 |
| 8 | Employer contributions for government social insurance | 706.8 | 765.3 | 814.4 | 857.8 | 888.1 | −0.1 | −0.4 | −0.5 | −8.7 | −20.9 | −0.1 | −0.2 | −0.1 | −8.2 | −12.2 |
| 9 | Proprietors’ income with IVA and CCAdj | 1,820.1 | 1,868.7 | 1,842.6 | 1,916.0 | 2,017.0 | 1.5 | −0.2 | −99.4 | −107.1 | −92.3 | 1.5 | −1.7 | −99.1 | −7.7 | 14.8 |
| 10 | Farm | 74.5 | 94.4 | 70.6 | 54.9 | 72.8 | 0.0 | −0.7 | −0.8 | −2.9 | −3.0 | 0.0 | −0.7 | −0.1 | −2.1 | −0.1 |
| 11 | Nonfarm | 1,745.7 | 1,774.3 | 1,772.0 | 1,861.0 | 1,944.3 | 1.5 | 0.5 | −98.6 | −104.2 | −89.3 | 1.5 | −1.0 | −99.0 | −5.6 | 14.9 |
| 12 | Rental income of persons with CCAdj | 777.1 | 874.6 | 1,002.6 | 1,067.6 | 1,139.8 | 0.4 | 3.5 | 0.1 | −10.6 | 25.3 | 0.4 | 3.1 | −3.4 | −10.7 | 35.9 |
| 13 | Corporate profits with IVA and CCAdj | 3,099.6 | 3,364.7 | 3,580.5 | 3,736.0 | 4,025.0 | 1.6 | 2.1 | −36.8 | −65.8 | −52.5 | 1.6 | 0.4 | −38.9 | −28.9 | 13.3 |
| 14 | Taxes on corporate income | 470.6 | 599.9 | 621.2 | 660.9 | 638.8 | 1.7 | −0.7 | 8.2 | −19.4 | −56.4 | 1.7 | −2.4 | 8.9 | −27.6 | −36.9 |
| 15 | Profits after tax with IVA and CCAdj | 2,629.0 | 2,764.8 | 2,959.3 | 3,075.1 | 3,386.1 | −0.1 | 2.8 | −45.0 | −46.3 | 3.9 | −0.1 | 2.9 | −47.8 | −1.3 | 50.2 |
| 16 | Net dividends | 1,887.0 | 2,022.8 | 2,038.4 | 2,141.9 | 2,159.0 | 0.0 | −5.1 | −116.0 | −83.8 | −102.1 | 0.0 | −5.1 | −110.9 | 32.2 | −18.3 |
| 17 | Undistributed profits with IVA and CCAdj | 742.0 | 741.9 | 920.9 | 933.2 | 1,227.2 | −0.1 | 7.8 | 71.0 | 37.5 | 105.9 | −0.1 | 7.9 | 63.2 | −33.6 | 68.5 |
| 18 | Net interest and miscellaneous payments | 464.6 | 411.4 | 561.9 | 569.0 | 613.4 | 4.7 | 1.0 | 281.0 | 401.7 | 470.6 | 4.7 | −3.7 | 279.9 | 120.7 | 68.9 |
| 19 | Taxes on production and imports | 1,699.8 | 1,836.2 | 1,862.7 | 1,973.0 | 2,233.1 | −0.3 | 1.7 | 1.7 | 18.3 | 19.3 | −0.3 | 2.0 | 0.0 | 16.6 | 1.0 |
| 20 | Less: Subsidies | 626.1 | 128.0 | 102.4 | 96.1 | 122.0 | 0.0 | 0.0 | 0.1 | 1.8 | 9.9 | 0.0 | 0.0 | 0.1 | 1.7 | 8.1 |
| 21 | Business current transfer payments (net) | 199.5 | 255.9 | 261.5 | 289.2 | 277.8 | 6.3 | 3.1 | 22.9 | 2.8 | −4.7 | 6.3 | −3.2 | 19.8 | −20.1 | −7.5 |
| 22 | To persons (net) | 93.5 | 126.1 | 107.6 | 84.4 | 89.5 | 0.0 | −0.6 | 1.4 | −15.3 | −17.3 | 0.0 | −0.6 | 2.0 | −16.7 | −2.1 |
| 23 | To government (net) | 99.8 | 115.9 | 119.6 | 150.8 | 146.2 | 0.1 | 0.2 | 7.0 | 10.8 | 15.6 | 0.1 | 0.1 | 6.8 | 3.8 | 4.8 |
| 24 | To the rest of the world (net) | 6.2 | 14.0 | 34.4 | 54.0 | 42.1 | 6.2 | 3.5 | 14.4 | 7.3 | −3.0 | 6.2 | −2.7 | 10.9 | −7.2 | −10.2 |
| 25 | Current surplus of government enterprises | −11.9 | −18.9 | −46.0 | −41.0 | −43.2 | −0.9 | −2.9 | 1.0 | 6.5 | 9.4 | −0.9 | −1.9 | 3.8 | 5.5 | 2.9 |
- CCAdj
- Capital consumption adjustment
- IVA
- Inventory valuation adjustment
Note. Dollar levels are from National Income and Product Accounts table 1.12.
U.S. Bureau of Economic Analysis
| Line | Series | Level | Revision in level | Revision in change | |||||||||||||
|---|---|---|---|---|---|---|---|---|---|---|---|---|---|---|---|---|---|
| 2021 | 2022 | 2023 | 2024 | 2025 | 2021 | 2022 | 2023 | 2024 | 2025 | 2021 | 2022 | 2023 | 2024 | 2025 | |||
| 1 | GDP | 23,745.8 | 26,059.7 | 27,825.9 | 29,381.0 | 30,861.3 | 20.2 | 5.1 | 14.4 | 83.0 | 99.2 | 20.2 | −15.1 | 9.3 | 68.6 | 16.2 | |
| 2 | Less: Statistical discrepancy | 38.4 | −7.9 | 118.1 | 84.7 | −46.4 | 0.6 | −7.5 | −207.8 | −211.6 | −276.0 | 0.6 | −8.1 | −200.3 | −3.8 | −64.4 | |
| 3 | Equals: GDI | 23,707.4 | 26,067.6 | 27,707.8 | 29,296.3 | 30,907.7 | 19.6 | 12.6 | 222.2 | 294.6 | 375.2 | 19.6 | −7.0 | 209.5 | 72.5 | 80.6 | |
| 4 | Plus: Income receipts from the rest of the world | 1,083.3 | 1,219.3 | 1,393.4 | 1,483.5 | 1,564.6 | 0.0 | −0.5 | −4.4 | −2.0 | 8.2 | 0.0 | −0.5 | −4.0 | 2.4 | 10.2 | |
| 5 | Less: Income payments to the rest of the world | 932.5 | 1,064.5 | 1,327.0 | 1,519.5 | 1,579.8 | 0.0 | −3.2 | 14.7 | 25.6 | 58.5 | 0.0 | −3.2 | 18.0 | 10.9 | 32.9 | |
| 6 | Equals: Gross national income | 23,858.2 | 26,222.4 | 27,774.3 | 29,260.4 | 30,892.5 | 19.6 | 15.4 | 203.0 | 267.0 | 324.9 | 19.6 | −4.2 | 187.6 | 64.0 | 58.0 | |
| 7 | Less: Consumption of fixed capital | 3,873.9 | 4,310.1 | 4,576.4 | 4,805.0 | 5,055.5 | 3.1 | 2.7 | 5.6 | 8.3 | −9.6 | 3.1 | −0.4 | 3.0 | 2.7 | −17.9 | |
| 8 | Equals: National income | 19,984.3 | 21,912.3 | 23,197.9 | 24,455.4 | 25,837.1 | 16.5 | 12.7 | 197.3 | 258.7 | 334.5 | 16.5 | −3.8 | 184.7 | 61.4 | 75.8 | |
| 9 | Less: | ||||||||||||||||
| 10 | Corporate profits with IVA and CCAdj | 3,099.6 | 3,364.7 | 3,580.5 | 3,736.0 | 4,025.0 | 1.6 | 2.1 | −36.8 | −65.8 | −52.5 | 1.6 | 0.4 | −38.9 | −28.9 | 13.3 | |
| 11 | Taxes on production and imports less subsidies | 1,073.7 | 1,708.1 | 1,760.3 | 1,877.0 | 2,111.1 | −0.3 | 1.7 | 1.5 | 16.5 | 9.4 | −0.3 | 2.0 | −0.1 | 15.0 | −7.1 | |
| 12 | Contributions for government social insurance, domestic | 1,558.6 | 1,705.0 | 1,799.3 | 1,904.3 | 1,980.1 | −0.7 | 1.1 | −1.4 | −18.9 | −38.9 | −0.7 | 1.9 | −2.5 | −17.5 | −20.0 | |
| 13 | Net interest and miscellaneous payments on assets | 464.6 | 411.4 | 561.9 | 569.0 | 613.4 | 4.7 | 1.0 | 281.0 | 401.7 | 470.6 | 4.7 | −3.7 | 279.9 | 120.7 | 68.9 | |
| 14 | Business current transfer payments (net) | 199.5 | 255.9 | 261.5 | 289.2 | 277.8 | 6.3 | 3.1 | 22.9 | 2.8 | −4.7 | 6.3 | −3.2 | 19.8 | −20.1 | −7.5 | |
| 15 | Current surplus of government enterprises | −11.9 | −18.9 | −46.0 | −41.0 | −43.2 | −0.9 | −2.9 | 1.0 | 6.5 | 9.4 | −0.9 | −1.9 | 3.8 | 5.5 | 2.9 | |
| 16 | Plus: Personal income receipts on assets | 3,246.7 | 3,529.2 | 4,110.7 | 4,376.1 | 4,540.6 | 2.5 | −5.4 | 133.6 | 230.7 | 324.4 | 2.5 | −7.8 | 138.9 | 97.1 | 93.6 | |
| 17 | Plus: Personal current transfer receipts | 4,660.4 | 4,141.9 | 4,251.3 | 4,546.4 | 4,914.0 | 0.2 | 2.3 | −5.4 | −9.0 | −37.9 | 0.2 | 2.0 | −7.7 | −3.6 | −28.9 | |
| 18 | Equals: Personal income | 21,507.4 | 22,157.2 | 23,642.3 | 25,043.4 | 26,327.6 | 8.4 | 3.4 | 57.3 | 137.5 | 227.7 | 8.4 | −5.0 | 53.9 | 80.2 | 90.2 | |
| Addenda: | |||||||||||||||||
| 19 | Average of GDP and GDI1 | 23,726.6 | 26,063.7 | 27,766.8 | 29,338.7 | 30,884.5 | 19.9 | 8.9 | 118.3 | 188.8 | 237.2 | 19.9 | −11.0 | 109.4 | 70.5 | 48.4 | |
| 20 | Statistical discrepancy as a percentage of GDP | 0.2 | 0.0 | 0.4 | 0.3 | −0.2 | 0.0 | 0.0 | −0.8 | −0.7 | −0.9 | 0.0 | 0.0 | −0.8 | 0.1 | −0.2 | |
- CCAdj
- Capital consumption adjustment
- GDI
- Gross domestic income
- GDP
- Gross domestic product
- IVA
- Inventory valuation adjustment
- A supplemental measure of U.S. economic activity that equally weights GDP and GDI.
Note. Dollar levels are from National Income and Product Accounts table 1.17.5.
U.S. Bureau of Economic Analysis
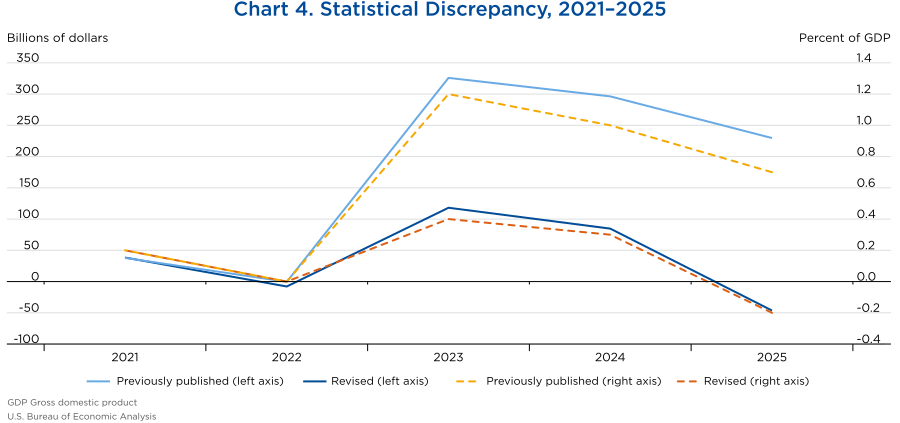
The update had a notable impact on the statistical discrepancy (chart 4 and table 6) for 2023–2025. In theory, GDI should equal GDP, but in practice, they differ because their components are estimated using largely independent source data. The statistical discrepancy as a percent of GDP was revised closer to zero for all 3 years: from 1.2 percent to 0.4 percent in 2023, from 1.0 percent to 0.3 percent in 2024, and from 0.7 percent to –0.2 percent in 2025.
Measures of personal income were also impacted by newly available and revised source data (table 7), most notably in 2024 and 2025.
- Personal income was revised up $137.5 billion in 2024 and $227.7 billion in 2025 led by upward revisions to personal interest income based primarily on extrapolations of 2023 IRS SOI data for corporations, sole proprietorships, and partnerships informed by Compustat interest expense data.
- The personal saving rate (personal saving as a percentage of disposable personal income) was unrevised for 2021 and revised up for 2022–2025.
| Line | Series | Level | Revision in level | Revision in change | ||||||||||||
|---|---|---|---|---|---|---|---|---|---|---|---|---|---|---|---|---|
| 2021 | 2022 | 2023 | 2024 | 2025 | 2021 | 2022 | 2023 | 2024 | 2025 | 2021 | 2022 | 2023 | 2024 | 2025 | ||
| 1 | Personal income | 21,507.4 | 22,157.2 | 23,642.3 | 25,043.4 | 26,327.6 | 8.4 | 3.4 | 57.3 | 137.5 | 227.7 | 8.4 | −5.0 | 53.9 | 80.2 | 90.2 |
| 2 | Compensation of employees | 12,561.5 | 13,447.8 | 14,234.5 | 15,041.7 | 15,696.2 | 3.1 | 4.5 | 27.1 | 14.6 | −30.7 | 3.1 | 1.3 | 22.6 | −12.4 | −45.3 |
| 3 | Wages and salaries | 10,314.9 | 11,123.8 | 11,735.1 | 12,410.6 | 12,976.3 | −0.1 | 1.1 | 2.7 | 22.7 | 17.6 | −0.1 | 1.2 | 1.6 | 20.0 | −5.0 |
| 4 | Private industries | 8,770.5 | 9,502.4 | 10,004.4 | 10,558.8 | 11,048.9 | −0.1 | 0.9 | 3.9 | 20.0 | 20.5 | −0.1 | 0.9 | 3.0 | 16.1 | 0.4 |
| 5 | Government | 1,544.3 | 1,621.5 | 1,730.7 | 1,851.8 | 1,927.4 | 0.0 | 0.2 | −1.2 | 2.7 | −2.8 | 0.0 | 0.2 | −1.4 | 3.9 | −5.5 |
| 6 | Supplements to wages and salaries | 2,246.6 | 2,324.0 | 2,499.4 | 2,631.1 | 2,719.9 | 3.2 | 3.4 | 24.4 | −8.0 | −48.3 | 3.2 | 0.2 | 21.0 | −32.4 | −40.3 |
| 7 | Proprietors’ income with IVA and CCAdj | 1,820.1 | 1,868.7 | 1,842.6 | 1,916.0 | 2,017.0 | 1.5 | −0.2 | −99.4 | −107.1 | −92.3 | 1.5 | −1.7 | −99.1 | −7.7 | 14.8 |
| 8 | Farm | 74.5 | 94.4 | 70.6 | 54.9 | 72.8 | 0.0 | −0.7 | −0.8 | −2.9 | −3.0 | 0.0 | −0.7 | −0.1 | −2.1 | −0.1 |
| 9 | Nonfarm | 1,745.7 | 1,774.3 | 1,772.0 | 1,861.0 | 1,944.3 | 1.5 | 0.5 | −98.6 | −104.2 | −89.3 | 1.5 | −1.0 | −99.0 | −5.6 | 14.9 |
| 10 | Rental income of persons with CCAdj | 777.1 | 874.6 | 1,002.6 | 1,067.6 | 1,139.8 | 0.4 | 3.5 | 0.1 | −10.6 | 25.3 | 0.4 | 3.1 | −3.4 | −10.7 | 35.9 |
| 11 | Personal income receipts on assets | 3,246.7 | 3,529.2 | 4,110.7 | 4,376.1 | 4,540.6 | 2.5 | −5.4 | 133.6 | 230.7 | 324.4 | 2.5 | −7.8 | 138.9 | 97.1 | 93.6 |
| 12 | Personal interest income | 1,475.3 | 1,572.6 | 2,079.4 | 2,241.1 | 2,389.6 | 2.5 | −0.3 | 249.6 | 314.5 | 421.3 | 2.5 | −2.8 | 249.9 | 64.9 | 106.8 |
| 13 | Personal dividend income | 1,771.4 | 1,956.7 | 2,031.4 | 2,134.9 | 2,151.0 | 0.0 | −5.1 | −116.0 | −83.8 | −96.9 | 0.0 | −5.1 | −110.9 | 32.2 | −13.1 |
| 14 | Personal current transfer receipts | 4,660.4 | 4,141.9 | 4,251.3 | 4,546.4 | 4,914.0 | 0.2 | 2.3 | −5.4 | −9.0 | −37.9 | 0.2 | 2.0 | −7.7 | −3.6 | −28.9 |
| 15 | Government social benefits to persons | 4,567.0 | 4,015.8 | 4,143.7 | 4,462.0 | 4,824.5 | 0.2 | 2.8 | −6.9 | 6.3 | −20.6 | 0.2 | 2.6 | −9.7 | 13.1 | −26.9 |
| 16 | Other current transfer receipts, from business (net) | 93.5 | 126.1 | 107.6 | 84.4 | 89.5 | 0.0 | −0.6 | 1.4 | −15.3 | −17.3 | 0.0 | −0.6 | 2.0 | −16.7 | −2.1 |
| 17 | Less: Contributions for government social insurance | 1,558.6 | 1,705.0 | 1,799.3 | 1,904.3 | 1,980.1 | −0.7 | 1.1 | −1.4 | −18.9 | −38.9 | −0.7 | 1.9 | −2.5 | −17.5 | −20.0 |
| 18 | Less: Personal current taxes | 2,701.4 | 3,242.0 | 2,833.9 | 2,997.9 | 3,341.6 | 3.4 | −1.3 | −1.8 | 9.7 | 107.8 | 3.4 | −4.6 | −0.6 | 11.5 | 98.1 |
| 19 | Equals: Disposable personal income (DPI) | 18,806.0 | 18,915.2 | 20,808.4 | 22,045.5 | 22,986.0 | 5.1 | 4.7 | 59.2 | 127.8 | 119.8 | 5.1 | −0.4 | 54.4 | 68.7 | −8.0 |
| 20 | Less: Personal outlays | 16,617.8 | 18,256.0 | 19,535.8 | 20,664.3 | 21,744.1 | −5.9 | −21.6 | −54.3 | −60.1 | −75.3 | −5.9 | −15.7 | −32.7 | −5.9 | −15.2 |
| 21 | Equals: Personal saving | 2,188.2 | 659.2 | 1,272.7 | 1,381.2 | 1,241.9 | 11.0 | 26.3 | 113.4 | 187.9 | 195.2 | 11.0 | 15.3 | 87.1 | 74.5 | 7.2 |
| 22 | Personal saving as a percentage of DPI (percent) | 11.6 | 3.5 | 6.1 | 6.3 | 5.4 | 0.0 | 0.2 | 0.5 | 0.9 | 0.8 | 0.0 | 0.2 | 0.3 | 0.4 | −0.1 |
- CCAdj
- Capital consumption adjustment
- DPI
- Disposable personal income
- IVA
- Inventory valuation adjustment
Note. Dollar levels are from National Income and Product Accounts table 2.1.
U.S. Bureau of Economic Analysis
The revisions to net exports of goods and services reflect the annual update of BEA's ITAs, which revised goods and primary income data from 2021 to 2025 and services and secondary income data from 1999 to 2025.7 However, the revision period for the 2026 annual update of the NIPAs was 2021 to 2025. As a result, there are discontinuities between the 2020 and 2021 NIPA estimates of services and secondary income. For current-dollar net exports of goods and services (and for current-dollar GDP), the change from 2020 to 2021 was $9.0 billion higher than if the ITA revisions to 2020 had been incorporated (table 8).
| Line | Series | 2020 | 2021 | Change from 2020 to 2021 | ||||
|---|---|---|---|---|---|---|---|---|
| Published (not open to revision) | Adjusted1 | Discontinuity2 | Revised | Revised | Adjusted1 | |||
| 1 | Net exports of goods and services | −618.6 | −609.6 | 9.0 | −841.1 | −222.5 | −231.5 | |
| 2 | Exports | 2,163.8 | 2,163.6 | −0.2 | 2,568.5 | 404.7 | 404.9 | |
| 3 | Goods | 1,421.6 | 1,421.6 | 0.0 | 1,747.2 | 325.6 | 325.6 | |
| 4 | Services | 742.2 | 742.0 | −0.2 | 821.3 | 79.1 | 79.3 | |
| 5 | Imports | 2,782.4 | 2,773.2 | −9.2 | 3,409.6 | 627.2 | 636.4 | |
| 6 | Goods | 2,305.1 | 2,305.1 | 0.0 | 2,841.6 | 536.5 | 536.5 | |
| 7 | Services | 477.3 | 468.1 | −9.2 | 568.0 | 90.7 | 99.9 | |
| 8 | Net receipts of income | 211.6 | 211.6 | 0.0 | 150.8 | −60.8 | −60.8 | |
| 9 | Income receipts | 989.1 | 989.1 | 0.0 | 1,083.3 | 94.2 | 94.2 | |
| 10 | Wage and salary receipts | 6.8 | 6.8 | 0.0 | 7.1 | 0.3 | 0.3 | |
| 11 | Income receipts on assets | 982.2 | 982.2 | 0.0 | 1,076.2 | 94.0 | 94.0 | |
| 12 | Interest | 218.2 | 218.2 | 0.0 | 202.2 | −16.0 | −16.0 | |
| 13 | Dividends | 559.5 | 559.5 | 0.0 | 589.0 | 29.5 | 29.5 | |
| 14 | Reinvested earnings of US direct investment abroad | 204.5 | 204.5 | 0.0 | 285.0 | 80.5 | 80.5 | |
| 15 | Income payments | 777.5 | 777.5 | 0.0 | 932.5 | 155.0 | 155.0 | |
| 16 | Wage and salary payments | 14.4 | 14.4 | 0.0 | 18.3 | 3.9 | 3.9 | |
| 17 | Income payments on assets | 763.0 | 763.0 | 0.0 | 914.2 | 151.2 | 151.2 | |
| 18 | Interest | 444.2 | 444.2 | 0.0 | 440.4 | −3.8 | −3.8 | |
| 19 | Dividends | 234.6 | 234.6 | 0.0 | 246.5 | 11.9 | 11.9 | |
| 20 | Reinvested earnings of foreign direct investment in the United States | 84.2 | 84.2 | 0.0 | 227.3 | 143.1 | 143.1 | |
| 21 | Current taxes and transfer payments to the rest of the world (net) | −157.7 | −162.8 | −5.1 | −177.7 | −20.0 | −14.9 | |
| Addenda: | ||||||||
| 22 | Gross domestic product | 21,375.3 | 21,384.3 | 9.0 | 23,745.8 | 2,370.5 | 2,361.5 | |
| 23 | Gross national product | 21,586.9 | 21,595.9 | 9.0 | 23,896.7 | 2,309.8 | 2,300.8 | |
- NIPA
- National Income and Product Account
- Equals the level if revisions to the U.S. International Transactions Accounts (ITAs) had been carried back in the NIPAs.
- Equals the revisions to the U.S. ITAs that have not been carried back in the NIPAs at this time.
Note. Dollar levels are from National Income and Product Accounts table 4.1.
U.S. Bureau of Economic Analysis
GDP and GDI
Chart 5 shows revised and previously published percent changes from the preceding quarter for real GDP for the first quarter of 2021 through the first quarter of 2026. With the updated estimates, the overall pattern of economic growth over this period remains unchanged.
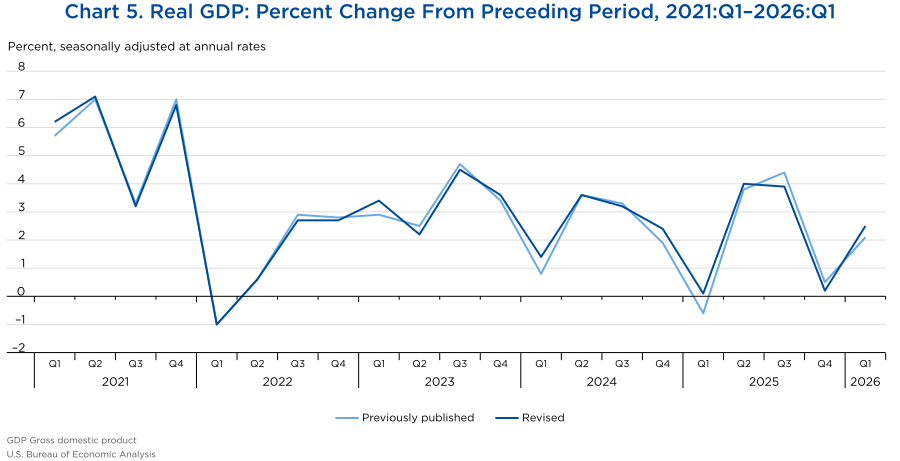
Notable quarterly revisions include:
- In the first quarter of 2024, the increase in real GDP was revised up 0.6 percentage point, from 0.8 percent to 1.4 percent, primarily reflecting a downward revision to imports (led by consumer durable goods) based on revised data from BEA's ITAs and an upward revision to government spending (led by state and local government investment in structures) based on revised Census VIP data.
- In the fourth quarter of 2024, the increase in real GDP was revised up 0.5 percentage point, from 1.9 percent to 2.4 percent, primarily reflecting upward revisions to nonresidential fixed investment (led by structures, notably commercial and health care) based on revised Census VIP data and to consumer spending (led by final expenditures of nonprofit institutions serving households and food services and accommodations) based on revised Census QSS data and revised monthly retail sales.
- In the first quarter of 2025, the increase in real GDP was revised up 0.7 percentage point, from a decrease of 0.6 percent to an increase of 0.1 percent, primarily reflecting updated data from BEA's ITAs. Imports were revised down (led by consumer goods, both durable and nondurable, and by automotive vehicles, engines, and parts) and exports were revised up (led by other business services).
- In the third quarter of 2025, the increase in real GDP was revised down 0.5 percentage point, from a decrease of 0.6 percent to an increase of 0.1 percent, primarily reflecting an upward revision to imports of both goods and services, based on updated data from BEA's ITAs. Within goods imports, upward revisions were widespread, led by consumer goods (mainly nondurable) and by capital goods, except automotive. Within services, the leading contributor to the revision was other business services (led by insurance).
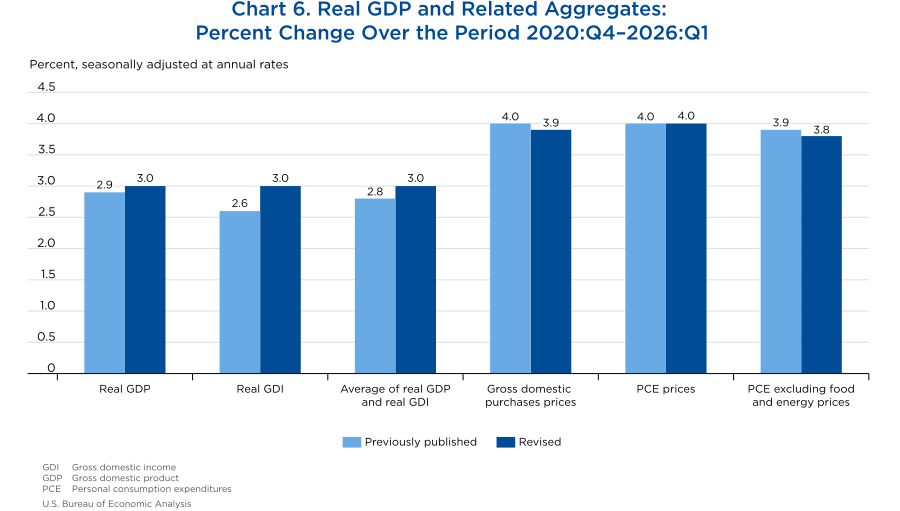
From the fourth quarter of 2020 to the first quarter of 2026, the average annual rate of change in real GDP was 3.0 percent, revised up 0.1 percentage point from the previously published estimate. Real GDI over the same period also increased 3.0 percent, revised up 0.4 percentage point, revising the average of GDP and GDI up by 0.2 percentage point (chart 6).
Prices
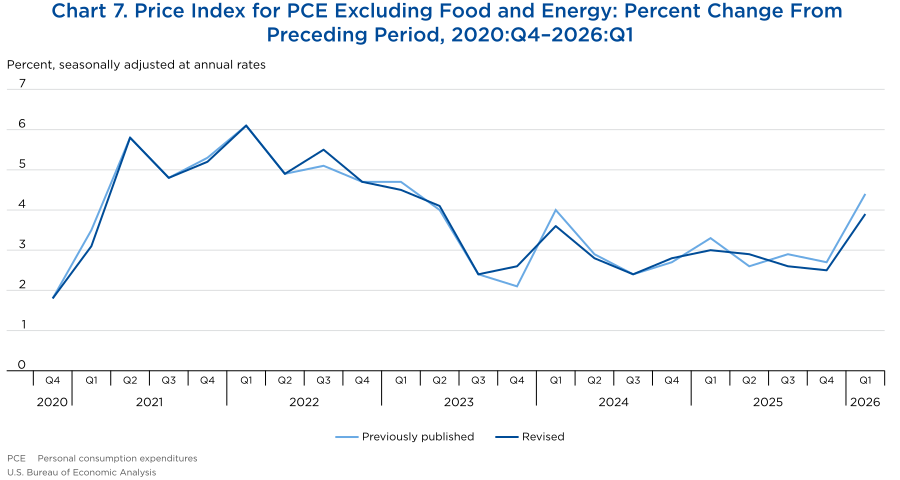
From the fourth quarter of 2020 to the first quarter of 2026, the average annual rate of change in the price index for gross domestic purchases was 3.9 percent, revised down 0.1 percentage point from the previously published estimate. Over the same period, the price index for PCE increased 4.0 percent, the same as previously published, and the core PCE price index, which excludes food and energy, increased 3.8 percent, revised down 0.1 percentage point.
Quarterly revisions to the change in the core PCE price index primarily reflect updated BLS CPIs (chart 7).
Previously published and revised price indexes are shown in charts 8 through 10 for the three methodology changes noted above. Revised indexes follow the same general pattern as previously published while reducing quarter-to-quarter volatility and improving the alignment between the components of consumer spending and the indexes used for deflation.
Business cycles
The percent change in real GDP during the latest expansion from the second quarter of 2020 to the first quarter of 2026 was 27.1 percent (4.3 percent at an annual rate). There were no revisions to earlier contractions and expansions, because those cycles were not impacted by the updated timespan (table 9).
| Cyclical fluctuations | Percent change | |
|---|---|---|
| Annual rates | Not annual rates | |
| Contractions | ||
| 1948:Q4–1949:Q4 | −1.5 | −1.5 |
| 1953:Q2–1954:Q2 | −2.4 | −2.4 |
| 1957:Q3–1958:Q2 | −3.9 | −3.0 |
| 1960:Q2–1961:Q1 | −0.2 | −0.1 |
| 1969:Q4–1970:Q4 | −0.2 | −0.2 |
| 1973:Q4–1975:Q1 | −2.5 | −3.1 |
| 1980:Q1–1980:Q3 | −4.3 | −2.2 |
| 1981:Q3–1982:Q4 | −2.0 | −2.5 |
| 1990:Q3–1991:Q1 | −2.7 | −1.4 |
| 2001:Q1–2001:Q4 | 0.7 | 0.5 |
| 2007:Q4–2009:Q2 | −2.6 | −3.8 |
| 2019:Q4–2020:Q2 | −17.4 | −9.1 |
| Expansions | ||
| 1949:Q4–1953:Q2 | 7.6 | 29.3 |
| 1954:Q2–1957:Q3 | 4.0 | 13.7 |
| 1958:Q2–1960:Q2 | 5.5 | 11.4 |
| 1961:Q1–1969:Q4 | 4.9 | 51.9 |
| 1970:Q4–1973:Q4 | 5.1 | 16.0 |
| 1975:Q1–1980:Q1 | 4.3 | 23.2 |
| 1980:Q3–1981:Q3 | 4.3 | 4.3 |
| 1982:Q4–1990:Q3 | 4.3 | 38.2 |
| 1991:Q1–2001:Q1 | 3.6 | 42.5 |
| 2001:Q4–2007:Q4 | 2.9 | 18.7 |
| 2009:Q2–2019:Q4 | 2.5 | 29.0 |
| 2020:Q2–2026:Q1 | 4.3 | 27.1 |
- GDP
- Gross domestic product
Note. Periods of contraction and expansion reflect official business cycle dates as determined by the National Bureau of Economic Research. Refer to www.nber.org.
U.S. Bureau of Economic Analysis
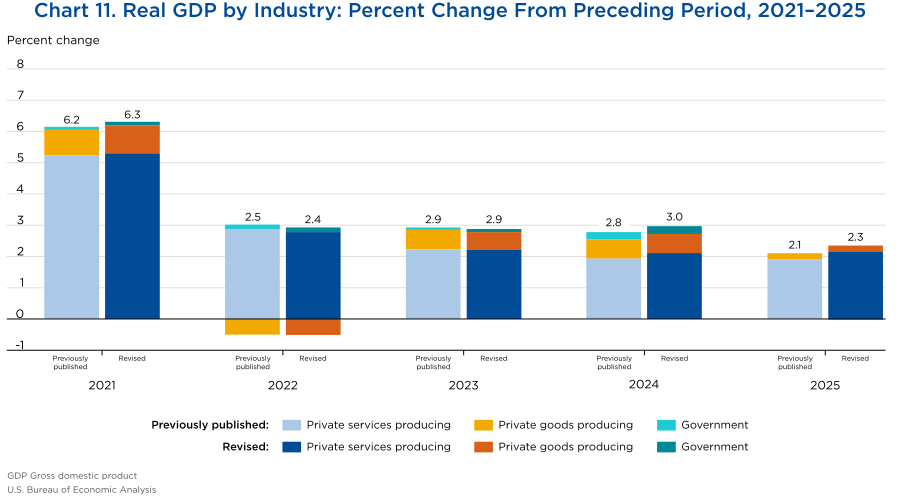
The picture of GDP by industry—or value added, which measures an industry's contribution to GDP—was largely unchanged with the annual update. Revisions to annual percent changes in real GDP by industry for 2021–2025 are discussed below and presented in chart 11 and table 10. Revisions to industry contributions to the percent change in real GDP are presented in table 11.
Revisions to GDP by industry
The updated estimates reflect upward revisions to private goods-producing industries, private services-producing industries, and government. As with the revisions to the NIPAs, the revisions to the Industry Economic Accounts were largely driven by newly available and revised source data.
- For 2021, the change in real GDP was revised up 0.1 percentage point, from 6.2 percent to 6.3 percent, primarily reflecting upward revisions to private goods-producing industries (led by durable-goods manufacturing and nondurable-goods manufacturing) and private services-producing industries (led by finance and insurance, real estate and rental and leasing, and wholesale trade). The direction of change was the same as previously published for 21 of 22 major industry groups.
- For 2022, the increase in real GDP was revised down 0.1 percentage point, from 2.5 percent to 2.4 percent, primarily reflecting a downward revision to private services-producing industries (led by management of companies and enterprises). The direction of change was the same for all 22 major industry groups.
- For 2023, the increase in real GDP was 2.9 percent, the same as previously published. Within private goods-producing industries, downward revisions to nondurable-goods manufacturing and construction were partly offset by upward revisions to mining and durable-goods manufacturing. Within private services-producing industries, downward revisions led by retail trade, real estate and rental and leasing, administrative and waste management services, and health care and social assistance were partly offset by upward revisions led by finance and insurance. Within government, state and local government was revised up. The direction of change was the same as previously published for 16 of 22 major industry groups.
- For 2024, the increase in real GDP was revised up 0.2 percentage point, from 2.8 percent to 3.0 percent, primarily reflecting an upward revision to private services-producing industries (led by information, real estate and rental and leasing, and finance and insurance). The direction of change was the same as previously published for 19 of 22 major industry groups.
- For 2025, the increase in real GDP was revised up 0.2 percentage point, from 2.1 percent to 2.3 percent, primarily reflecting an upward revision to private services-producing industries (led by wholesale trade, real estate and rental and leasing, and finance and insurance). The direction of change was the same as previously published for 18 of 22 major industry groups.
| Line | Series | Share of current-dollar GDP | Change from preceding period | Revision in percent change | |||||||||
|---|---|---|---|---|---|---|---|---|---|---|---|---|---|
| Percent | Percent | Percentage points | |||||||||||
| 2025 | 2021 | 2022 | 2023 | 2024 | 2025 | 2021 | 2022 | 2023 | 2024 | 2025 | |||
| 1 | GDP | 100.0 | 6.3 | 2.4 | 2.9 | 3.0 | 2.3 | 0.1 | −0.1 | 0.0 | 0.2 | 0.2 | |
| 2 | Private industries | 88.9 | 7.1 | 2.6 | 3.1 | 3.1 | 2.7 | 0.2 | −0.1 | −0.1 | 0.2 | 0.3 | |
| 3 | Agriculture, forestry, fishing, and hunting | 0.8 | 6.2 | 0.3 | 2.5 | −3.2 | −1.0 | 0.0 | −0.2 | −0.2 | −8.6 | 1.4 | |
| 4 | Mining | 1.3 | −7.3 | −8.7 | 42.1 | 2.1 | 5.4 | 1.3 | 0.2 | 3.7 | −0.7 | 5.2 | |
| 5 | Utilities | 1.6 | −2.2 | 1.0 | 11.8 | 2.4 | 1.8 | 0.1 | −0.1 | 6.1 | 0.2 | 2.8 | |
| 6 | Construction | 4.3 | 2.6 | −6.3 | −1.0 | 5.2 | −0.2 | 0.1 | −0.1 | −1.1 | 0.3 | −2.0 | |
| 7 | Manufacturing | 9.5 | 8.1 | −0.9 | 0.0 | 3.8 | 1.4 | 0.7 | −0.1 | −0.5 | 0.8 | −0.1 | |
| 8 | Durable goods | 5.1 | 8.1 | 0.2 | 0.8 | −0.6 | 2.9 | 0.7 | 0.0 | 0.9 | −0.3 | 0.1 | |
| 9 | Nondurable goods | 4.4 | 8.3 | −2.1 | −0.9 | 9.1 | −0.3 | 0.7 | −0.2 | −2.1 | 2.2 | −0.3 | |
| 10 | Wholesale trade | 6.3 | −0.4 | −1.3 | 1.3 | −0.2 | 6.4 | 0.6 | 0.2 | 2.8 | 0.5 | 4.6 | |
| 11 | Retail trade | 5.9 | 0.9 | −2.9 | 6.4 | 10.2 | −2.0 | 0.3 | −0.1 | −4.1 | −0.2 | −1.7 | |
| 12 | Transportation and warehousing | 3.3 | 14.9 | 0.4 | 1.4 | 3.2 | 0.4 | 0.5 | −0.1 | −1.1 | 0.1 | −1.2 | |
| 13 | Information | 5.7 | 13.9 | 7.3 | 9.9 | 7.4 | 8.2 | 0.3 | −0.1 | 1.9 | 2.0 | 0.2 | |
| 14 | Finance, insurance, real estate, rental, and leasing | 22.4 | 6.4 | 3.8 | 2.8 | 1.9 | 4.0 | 0.5 | 0.0 | 1.5 | 0.6 | 0.9 | |
| 15 | Finance and insurance | 8.7 | 6.3 | 0.5 | 5.7 | 0.7 | 3.9 | 0.8 | 0.2 | 7.0 | 0.6 | 0.5 | |
| 16 | Real estate and rental and leasing | 13.7 | 6.5 | 5.8 | 1.2 | 2.6 | 4.0 | 0.4 | 0.0 | −1.6 | 0.6 | 1.1 | |
| 17 | Professional and business services | 12.8 | 11.3 | 7.5 | 1.8 | 1.2 | 2.5 | −1.7 | −0.7 | −1.1 | −0.8 | −0.4 | |
| 18 | Professional, scientific, and technical services | 8.0 | 14.0 | 7.8 | 3.8 | 3.1 | 4.1 | 0.3 | 0.0 | −0.7 | 0.0 | −0.1 | |
| 19 | Management of companies and enterprises | 1.8 | −1.5 | 4.1 | 2.5 | −3.6 | 0.7 | −13.0 | −5.2 | 0.3 | −6.9 | −0.3 | |
| 20 | Administrative and waste management services | 3.0 | 12.6 | 8.8 | −3.5 | −0.9 | −0.7 | 0.4 | 0.1 | −2.7 | 0.3 | −1.4 | |
| 21 | Educational services, health care, and social assistance | 8.7 | 4.7 | 5.4 | 3.7 | 4.7 | 3.4 | 0.2 | 0.0 | −1.0 | 0.5 | −0.7 | |
| 22 | Educational services | 1.1 | 2.8 | 7.9 | 2.8 | 4.0 | 1.1 | 0.1 | 0.2 | 0.3 | 1.2 | 0.5 | |
| 23 | Health care and social assistance | 7.5 | 5.0 | 5.0 | 3.9 | 4.8 | 3.7 | 0.2 | −0.1 | −1.1 | 0.3 | −1.0 | |
| 24 | Arts, entertainment, recreation, accommodation, and food services | 4.2 | 26.1 | 8.9 | −0.1 | 0.3 | 0.0 | 1.0 | 0.2 | −3.7 | 0.0 | −0.2 | |
| 25 | Arts, entertainment, and recreation | 1.0 | 25.7 | 18.2 | −1.6 | 0.6 | 1.8 | 0.5 | 0.0 | −7.7 | −0.8 | −2.9 | |
| 26 | Accommodation and food services | 3.1 | 26.2 | 6.1 | 0.4 | 0.2 | −0.6 | 1.2 | 0.2 | −2.4 | 0.2 | 0.8 | |
| 27 | Other services, except government | 2.0 | 3.4 | 4.6 | −7.5 | −0.6 | −3.7 | 0.2 | 0.0 | −2.3 | 0.5 | −1.9 | |
| 28 | Government | 11.1 | 0.8 | 1.3 | 0.9 | 2.3 | −0.2 | 0.0 | −0.1 | 0.2 | 0.1 | −0.2 | |
| 29 | Federal | 3.6 | 0.9 | −0.6 | 0.4 | 2.3 | −3.0 | 0.1 | 0.0 | 0.0 | 0.2 | 0.3 | |
| 30 | State and local | 7.6 | 0.8 | 2.2 | 1.1 | 2.2 | 1.2 | 0.0 | −0.1 | 0.3 | 0.0 | −0.5 | |
| Addenda: | |||||||||||||
| 31 | Private goods-producing industries1 | 16.0 | 5.4 | −2.9 | 3.3 | 3.6 | 1.2 | 0.5 | −0.1 | −0.3 | 0.0 | 0.0 | |
| 32 | Private services-producing industries2 | 72.9 | 7.5 | 3.9 | 3.1 | 2.9 | 3.0 | 0.1 | −0.1 | 0.0 | 0.2 | 0.3 | |
- GDP
- Gross domestic product
- Consists of agriculture, forestry, fishing, and hunting; mining; construction; and manufacturing.
- Consists of utilities; wholesale trade; retail trade; transportation and warehousing; information; finance, insurance, real estate, rental, and leasing; professional and business services; educational services, health care, and social assistance; arts, entertainment, recreation, accommodation, and food services; and “other services, except government.”
Note. Percent changes are from Industry Economic Accounts table “Percent Changes in Chain-Type Quantity Indexes for Value Added by Industry.”
U.S. Bureau of Economic Analysis
| Line | Series | Contributions to percent change | Revision in contributions to percent change | |||||||||
|---|---|---|---|---|---|---|---|---|---|---|---|---|
| 2021 | 2022 | 2023 | 2024 | 2025 | 2021 | 2022 | 2023 | 2024 | 2025 | |||
| Percentage change from preceding period: | ||||||||||||
| 1 | GDP | 6.3 | 2.4 | 2.9 | 3.0 | 2.3 | 0.1 | −0.1 | 0.0 | 0.2 | 0.2 | |
| Percentage points: | ||||||||||||
| 2 | Private industries | 6.20 | 2.28 | 2.78 | 2.71 | 2.35 | 0.15 | −0.08 | −0.08 | 0.17 | 0.24 | |
| 3 | Agriculture, forestry, fishing, and hunting | 0.05 | 0.00 | 0.03 | −0.03 | −0.01 | 0.00 | −0.01 | 0.00 | −0.08 | 0.01 | |
| 4 | Mining | −0.09 | −0.14 | 0.59 | 0.03 | 0.07 | 0.01 | 0.00 | 0.05 | −0.01 | 0.06 | |
| 5 | Utilities | −0.04 | 0.02 | 0.19 | 0.04 | 0.03 | 0.00 | 0.00 | 0.10 | 0.00 | 0.05 | |
| 6 | Construction | 0.12 | −0.28 | −0.04 | 0.23 | −0.01 | 0.01 | −0.01 | −0.04 | 0.02 | −0.09 | |
| 7 | Manufacturing | 0.82 | −0.09 | 0.00 | 0.38 | 0.14 | 0.07 | 0.00 | −0.05 | 0.08 | 0.00 | |
| 8 | Durable goods | 0.44 | 0.01 | 0.04 | −0.03 | 0.15 | 0.04 | 0.00 | 0.05 | −0.01 | 0.01 | |
| 9 | Nondurable goods | 0.38 | −0.10 | −0.05 | 0.41 | −0.01 | 0.03 | 0.00 | −0.11 | 0.09 | −0.01 | |
| 10 | Wholesale trade | −0.02 | −0.08 | 0.08 | −0.01 | 0.38 | 0.04 | 0.01 | 0.17 | 0.03 | 0.27 | |
| 11 | Retail trade | 0.06 | −0.19 | 0.40 | 0.61 | −0.12 | 0.02 | −0.01 | −0.25 | −0.04 | −0.10 | |
| 12 | Transportation and warehousing | 0.45 | 0.01 | 0.05 | 0.11 | 0.01 | 0.02 | −0.01 | −0.04 | 0.01 | −0.04 | |
| 13 | Information | 0.74 | 0.39 | 0.51 | 0.40 | 0.45 | 0.01 | 0.00 | 0.09 | 0.11 | 0.03 | |
| 14 | Finance, insurance, real estate, rental, and leasing | 1.38 | 0.79 | 0.60 | 0.42 | 0.87 | 0.12 | 0.00 | 0.33 | 0.14 | 0.21 | |
| 15 | Finance and insurance | 0.50 | 0.04 | 0.44 | 0.06 | 0.33 | 0.06 | 0.01 | 0.54 | 0.05 | 0.07 | |
| 16 | Real estate and rental and leasing | 0.87 | 0.76 | 0.16 | 0.36 | 0.54 | 0.05 | 0.00 | −0.21 | 0.09 | 0.14 | |
| 17 | Professional and business services | 1.41 | 0.95 | 0.23 | 0.15 | 0.32 | −0.21 | −0.09 | −0.14 | −0.12 | −0.05 | |
| 18 | Professional, scientific, and technical services | 1.07 | 0.60 | 0.30 | 0.25 | 0.33 | 0.03 | 0.00 | −0.06 | 0.00 | 0.00 | |
| 19 | Management of companies and enterprises | −0.03 | 0.08 | 0.05 | −0.07 | 0.01 | −0.24 | −0.09 | 0.01 | −0.13 | −0.01 | |
| 20 | Administrative and waste management services | 0.38 | 0.27 | −0.12 | −0.03 | −0.02 | 0.02 | 0.00 | −0.10 | 0.01 | −0.04 | |
| 21 | Educational services, health care, and social assistance | 0.41 | 0.45 | 0.31 | 0.39 | 0.29 | 0.02 | 0.00 | −0.08 | 0.03 | −0.07 | |
| 22 | Educational services | 0.03 | 0.09 | 0.03 | 0.05 | 0.01 | 0.00 | 0.00 | 0.00 | 0.02 | 0.00 | |
| 23 | Health care and social assistance | 0.37 | 0.36 | 0.28 | 0.35 | 0.28 | 0.01 | 0.00 | −0.08 | 0.02 | −0.07 | |
| 24 | Arts, entertainment, recreation, accommodation, and food services | 0.85 | 0.34 | 0.00 | 0.01 | 0.00 | 0.04 | 0.00 | −0.15 | 0.00 | −0.01 | |
| 25 | Arts, entertainment, and recreation | 0.20 | 0.16 | −0.02 | 0.01 | 0.02 | 0.00 | 0.00 | −0.08 | −0.01 | −0.03 | |
| 26 | Accommodation and food services | 0.64 | 0.18 | 0.01 | 0.01 | −0.02 | 0.02 | 0.01 | −0.08 | 0.01 | 0.03 | |
| 27 | Other services, except government | 0.07 | 0.10 | −0.16 | −0.01 | −0.08 | 0.00 | 0.00 | −0.05 | 0.01 | −0.04 | |
| 28 | Government | 0.11 | 0.15 | 0.10 | 0.25 | −0.02 | 0.01 | −0.01 | 0.02 | 0.01 | −0.03 | |
| 29 | Federal | 0.03 | −0.02 | 0.02 | 0.08 | −0.11 | 0.00 | 0.00 | 0.00 | 0.00 | 0.01 | |
| 30 | State and local | 0.07 | 0.17 | 0.08 | 0.17 | 0.09 | 0.00 | −0.01 | 0.02 | 0.00 | −0.04 | |
| Addenda: | ||||||||||||
| 31 | Private goods-producing industries1 | 0.90 | −0.51 | 0.57 | 0.61 | 0.19 | 0.09 | −0.01 | −0.05 | 0.00 | −0.01 | |
| 32 | Private services-producing industries2 | 5.30 | 2.78 | 2.21 | 2.11 | 2.16 | 0.06 | −0.08 | −0.02 | 0.18 | 0.26 | |
- GDP
- Gross domestic product
- Consists of agriculture, forestry, fishing, and hunting; mining; construction; and manufacturing.
- Consists of utilities; wholesale trade; retail trade; transportation and warehousing; information; finance, insurance, real estate, rental, and leasing; professional and business services; educational services, health care, and social assistance; arts, entertainment, recreation, accommodation, and food services; and “other services, except government.”
Note. Percent changes are from Industry Economic Accounts table “Contributions to Percent Change in Real Gross Domestic Product by Industry.”
U.S. Bureau of Economic Analysis
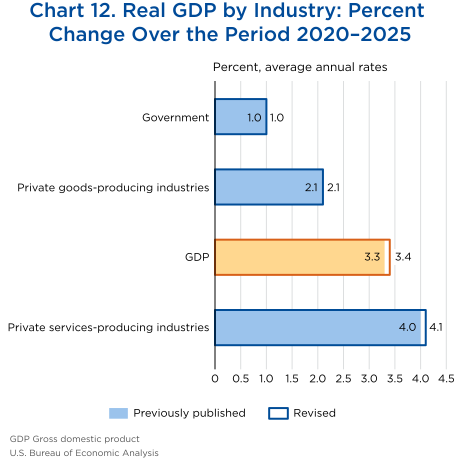
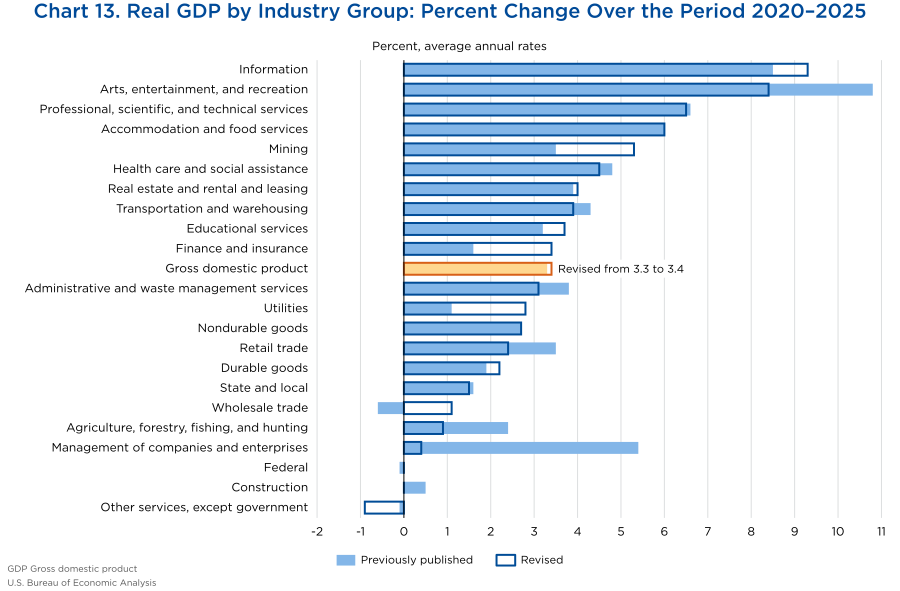
From 2020 to 2025, the average annual change in real GDP was 3.4 percent, 0.1 percentage point higher than previously estimated (chart 12). Over the same period, private goods-producing industries increased 2.1 percent, the same as previously estimated. Private services-producing industries increased 4.1 percent, 0.1 percentage point higher than previously estimated. Government increased 1.0 percent, the same as previously estimated. The direction of change over the period was unrevised for 21 of 22 major industry groups (chart 13). The largest revision over the period was to management of companies and enterprises (revised up from an increase of 0.4 percent to an increase of 5.4 percent).
Revisions to gross output
Gross output is principally a measure of an industry's sales or receipts, which includes sales to final users in the economy (GDP) and sales to other industries (intermediate inputs). The percent change in real gross output was revised down 0.1 percentage point to an increase of 6.8 percent for 2021, revised down 0.1 percentage point to an increase of 2.8 percent for 2022, revised down 0.6 percentage point to an increase of 2.0 percent for 2023, revised up 0.1 percentage point to an increase of 2.4 percent for 2024, and revised up 0.3 percentage point to an increase of 1.8 percent for 2025 (table 12).
| Line | Series | Change from preceding period | Revision in percent change | |||||||||
|---|---|---|---|---|---|---|---|---|---|---|---|---|
| Percent | Percentage points | |||||||||||
| 2021 | 2022 | 2023 | 2024 | 2025 | 2021 | 2022 | 2023 | 2024 | 2025 | |||
| 1 | All industries | 6.8 | 2.8 | 2.0 | 2.4 | 1.8 | −0.1 | −0.1 | −0.6 | 0.1 | 0.3 | |
| 2 | Private industries | 7.4 | 3.1 | 1.9 | 2.2 | 1.8 | −0.1 | −0.2 | −0.8 | 0.0 | 0.2 | |
| 3 | Agriculture, forestry, fishing, and hunting | 0.2 | −3.4 | 4.9 | 0.5 | −0.8 | 0.1 | 0.0 | 0.1 | −2.2 | 1.9 | |
| 4 | Mining | 8.3 | 8.6 | 7.5 | −0.3 | 2.7 | 0.1 | 0.0 | −0.2 | −0.1 | 2.2 | |
| 5 | Utilities | 2.0 | 3.3 | −1.0 | 2.4 | 2.0 | 0.0 | 0.0 | −0.2 | 0.2 | −0.6 | |
| 6 | Construction | 1.6 | −3.4 | 4.0 | 5.2 | −1.8 | −0.1 | 0.0 | −0.1 | 1.6 | −0.5 | |
| 7 | Manufacturing | 3.3 | −0.2 | 0.8 | 0.2 | 0.4 | 0.1 | 0.0 | −0.7 | 0.1 | 0.3 | |
| 8 | Durable goods | 4.9 | 1.4 | 1.8 | −1.2 | 1.1 | 0.1 | −0.1 | −0.3 | −0.2 | 0.6 | |
| 9 | Nondurable goods | 1.8 | −1.7 | −0.1 | 1.6 | −0.3 | 0.0 | 0.0 | −1.0 | 0.3 | 0.0 | |
| 10 | Wholesale trade | 10.8 | 2.5 | −4.9 | −0.3 | 1.9 | 0.0 | 0.0 | −1.1 | 0.6 | 2.3 | |
| 11 | Retail trade | 8.0 | −0.2 | 3.6 | 6.2 | 0.2 | 0.0 | 0.1 | −0.1 | 0.0 | −0.5 | |
| 12 | Transportation and warehousing | 11.0 | 6.4 | 1.1 | 2.1 | 1.1 | 0.2 | 0.0 | 2.2 | 0.0 | −0.5 | |
| 13 | Information | 11.8 | 6.8 | 3.6 | 4.8 | 7.2 | 0.1 | −0.1 | −0.4 | 0.7 | 0.4 | |
| 14 | Finance, insurance, real estate, rental, and leasing | 6.8 | 1.9 | 1.7 | 1.7 | 2.3 | 0.3 | −0.3 | −2.9 | −0.2 | 0.6 | |
| 15 | Finance and insurance | 3.5 | 0.3 | 3.0 | 2.1 | 2.3 | 0.6 | 0.3 | −3.5 | −0.6 | 0.4 | |
| 16 | Real estate and rental and leasing | 9.2 | 3.0 | 0.9 | 1.4 | 2.4 | −0.1 | −0.8 | −2.5 | 0.1 | 0.8 | |
| 17 | Professional and business services | 8.6 | 7.4 | 0.9 | 1.2 | 2.4 | −1.4 | −0.2 | −0.7 | −0.9 | −0.5 | |
| 18 | Professional, scientific, and technical services | 11.1 | 7.6 | 2.0 | 3.0 | 4.3 | 0.1 | 0.1 | −1.3 | −0.1 | 0.6 | |
| 19 | Management of companies and enterprises | 0.5 | 3.4 | 2.5 | 0.7 | 0.3 | −8.3 | −3.3 | 0.0 | −4.3 | −3.7 | |
| 20 | Administrative and waste management services | 7.7 | 9.0 | −2.1 | −2.2 | −0.7 | −0.8 | 0.7 | 0.2 | −0.5 | −1.0 | |
| 21 | Educational services, health care, and social assistance | 6.1 | 4.6 | 5.0 | 5.6 | 4.0 | 0.0 | −0.2 | −0.2 | −0.3 | 0.0 | |
| 22 | Educational services | 2.4 | 6.2 | 4.4 | 5.5 | 1.9 | −0.2 | −1.6 | 0.2 | −2.2 | −0.2 | |
| 23 | Health care and social assistance | 6.6 | 4.4 | 5.1 | 5.6 | 4.3 | 0.0 | 0.0 | −0.2 | 0.0 | 0.1 | |
| 24 | Arts, entertainment, recreation, accommodation, and food services | 23.8 | 12.3 | 4.7 | 1.4 | 1.5 | −1.2 | 0.6 | 0.2 | 0.0 | −0.3 | |
| 25 | Arts, entertainment, and recreation | 25.1 | 18.2 | 3.3 | 3.4 | 1.8 | −0.3 | 0.2 | −0.5 | 0.0 | −1.7 | |
| 26 | Accommodation and food services | 23.4 | 10.5 | 5.2 | 0.7 | 1.4 | −1.5 | 0.7 | 0.4 | 0.0 | 0.1 | |
| 27 | Other services, except government | 6.2 | 7.0 | 0.9 | 1.5 | −2.1 | −0.1 | 0.0 | −1.4 | −0.2 | −0.2 | |
| 28 | Government | 2.1 | 0.0 | 2.8 | 3.5 | 1.3 | 0.1 | −0.2 | 1.0 | 0.7 | 0.5 | |
| 29 | Federal | 2.7 | −3.3 | 0.9 | 3.1 | −2.7 | 0.1 | 0.0 | 0.0 | 0.3 | −0.4 | |
| 30 | State and local | 1.9 | 1.4 | 3.6 | 3.7 | 3.1 | 0.2 | −0.4 | 1.4 | 0.8 | 0.9 | |
| Addenda: | ||||||||||||
| 31 | Private goods-producing industries1 | 3.0 | −0.5 | 2.2 | 1.3 | −0.1 | 0.0 | −0.1 | −0.5 | 0.3 | 0.3 | |
| 32 | Private services-producing industries2 | 8.8 | 4.4 | 1.7 | 2.5 | 2.4 | −0.3 | −0.2 | −1.0 | −0.1 | 0.2 | |
- Consists of agriculture, forestry, fishing, and hunting; mining; construction; and manufacturing.
- Consists of utilities; wholesale trade; retail trade; transportation and warehousing; information; finance, insurance, real estate, rental, and leasing; professional and business services; educational services, health care, and social assistance; arts, entertainment, recreation, accommodation, and food services; and “other services, except government.”
Note. Percent changes are from Industry Economic Accounts table “Percent Changes in Chain-Type Quantity Indexes for Gross Output by Industry.”
U.S. Bureau of Economic Analysis
| Line | Series | Change from preceding period | Revision in percent change | ||||||||
|---|---|---|---|---|---|---|---|---|---|---|---|
| Percent | Percentage points | ||||||||||
| 2021 | 2022 | 2023 | 2024 | 2025 | 2021 | 2022 | 2023 | 2024 | 2025 | ||
| 1 | PCE | 8.8 | 2.9 | 2.3 | 2.9 | 2.6 | 0.0 | −0.1 | −0.3 | 0.0 | 0.0 |
| 2 | Goods | 11.3 | −0.7 | 1.7 | 2.7 | 2.9 | 0.0 | −0.1 | 0.0 | −0.1 | −0.3 |
| 3 | Durable goods | 16.3 | −2.3 | 3.7 | 3.6 | 3.4 | −0.1 | −0.3 | −0.1 | −0.3 | −0.2 |
| 4 | Motor vehicles and parts | 14.4 | −6.7 | 3.8 | −0.4 | 2.6 | 0.0 | 0.0 | 0.6 | 0.0 | 0.4 |
| 5 | Furnishings and durable household equipment | 12.6 | −3.3 | 1.6 | 5.3 | 2.2 | 0.0 | 0.0 | 0.0 | 0.0 | −0.5 |
| 6 | Recreational goods and vehicles | 17.1 | 1.4 | 6.7 | 6.2 | 5.7 | 0.0 | −0.8 | −1.0 | −0.9 | −0.5 |
| 7 | Other durable goods | 27.6 | 4.2 | 0.8 | 5.5 | 2.3 | 0.0 | 0.1 | 0.0 | −0.1 | −0.2 |
| 8 | Nondurable goods | 8.6 | 0.2 | 0.6 | 2.3 | 2.6 | 0.0 | 0.0 | 0.0 | 0.0 | −0.4 |
| 9 | Food and beverages purchased for off-premises consumption | 4.2 | −2.1 | −1.8 | 1.5 | 1.1 | 0.0 | 0.1 | 0.0 | −0.1 | −0.3 |
| 10 | Clothing and footwear | 27.4 | 0.3 | 1.3 | 2.5 | 5.9 | 0.0 | 0.1 | 0.0 | −0.1 | −0.2 |
| 11 | Gasoline and other energy goods | 12.1 | 0.9 | 0.6 | 0.4 | −0.1 | −0.1 | 0.1 | 0.0 | 0.3 | −0.9 |
| 12 | Other nondurable goods | 6.6 | 2.2 | 2.7 | 3.4 | 3.7 | 0.0 | 0.0 | 0.0 | −0.1 | −0.3 |
| 13 | Services | 7.6 | 4.8 | 2.6 | 3.0 | 2.5 | 0.0 | −0.1 | −0.4 | 0.0 | 0.2 |
| 14 | Household consumption expenditures (for services) | 8.9 | 4.6 | 3.0 | 2.9 | 2.8 | 0.1 | −0.1 | −0.4 | 0.0 | 0.2 |
| 15 | Housing and utilities | 2.7 | 2.6 | 1.2 | 1.5 | 1.8 | 0.0 | 0.0 | −0.1 | 0.0 | 0.5 |
| 16 | Health care | 9.1 | 4.1 | 6.2 | 5.7 | 4.5 | 0.0 | −0.1 | 0.1 | 0.3 | 0.2 |
| 17 | Transportation services | 21.9 | 10.1 | 0.7 | 4.7 | 2.9 | 0.0 | 0.0 | 0.0 | 0.2 | −0.3 |
| 18 | Recreation services | 19.0 | 11.4 | 3.2 | 0.7 | 1.3 | 0.0 | 0.0 | −0.7 | −0.7 | −0.3 |
| 19 | Food services and accommodations | 20.6 | 9.4 | 3.8 | 1.4 | 1.7 | 0.0 | 0.0 | 0.0 | 0.0 | 0.2 |
| 20 | Financial services and insurance | 4.7 | −0.6 | 0.6 | 2.6 | 3.3 | 1.1 | −0.2 | −2.6 | 0.1 | 0.9 |
| 21 | Other services | 10.1 | 5.7 | 2.7 | 2.5 | 2.8 | −0.6 | −0.6 | −0.7 | −0.5 | −0.7 |
| 22 | Final consumption expenditures of nonprofit institutions serving households1 | −15.4 | 9.6 | −4.8 | 4.7 | −3.7 | 0.0 | 0.1 | 0.2 | 0.1 | −0.3 |
| 23 | Gross output of nonprofit institutions2 | 1.7 | 3.4 | 1.9 | 4.1 | 1.8 | 0.0 | 0.0 | −0.1 | 0.0 | 0.0 |
| 24 | Less: Receipts from sales of goods and services by nonprofit institutions3 | 8.9 | 1.3 | 4.6 | 3.8 | 3.8 | 0.0 | 0.0 | −0.3 | −0.1 | 0.0 |
- NPISH
- Nonprofit institutions serving households
- PCE
- Personal consumption expenditures
- Net expenses of NPISHs, defined as their gross operating expenses less primary sales to households.
- Gross output is net of unrelated sales, secondary sales, and sales to business, to government, and to the rest of the world; excludes own-account investment (construction and software).
- Excludes unrelated sales, secondary sales, and sales to business, to government, and to the rest of the world; includes membership dues and fees.
Note. Percent changes are from National Income and Product Accounts table 2.3.1.
U.S. Bureau of Economic Analysis
| Line | Series | Contributions to percent change | Revision in contributions to percent change | ||||||||
|---|---|---|---|---|---|---|---|---|---|---|---|
| 2021 | 2022 | 2023 | 2024 | 2025 | 2021 | 2022 | 2023 | 2024 | 2025 | ||
| Percent change from preceding period: | |||||||||||
| 1 | PCE | 8.8 | 2.9 | 2.3 | 2.9 | 2.6 | 0.0 | −0.1 | −0.3 | 0.0 | 0.0 |
| Percentage points: | |||||||||||
| 2 | Goods | 3.75 | −0.24 | 0.56 | 0.87 | 0.91 | 0.00 | −0.03 | −0.01 | −0.04 | −0.10 |
| 3 | Durable goods | 1.88 | −0.28 | 0.43 | 0.40 | 0.37 | 0.00 | −0.03 | −0.01 | −0.03 | −0.02 |
| 4 | Motor vehicles and parts | 0.57 | −0.30 | 0.15 | −0.02 | 0.09 | 0.00 | 0.00 | 0.02 | 0.00 | 0.01 |
| 5 | Furnishings and durable household equipment | 0.34 | −0.09 | 0.04 | 0.13 | 0.05 | 0.00 | 0.00 | 0.00 | 0.00 | −0.02 |
| 6 | Recreational goods and vehicles | 0.59 | 0.05 | 0.22 | 0.21 | 0.19 | 0.00 | −0.03 | −0.04 | −0.02 | −0.01 |
| 7 | Other durable goods | 0.38 | 0.06 | 0.01 | 0.08 | 0.03 | 0.00 | 0.00 | 0.00 | 0.00 | −0.01 |
| 8 | Nondurable goods | 1.87 | 0.04 | 0.13 | 0.47 | 0.54 | 0.00 | 0.00 | −0.01 | −0.01 | −0.08 |
| 9 | Food and beverages purchased for off-premises consumption | 0.35 | −0.17 | −0.14 | 0.11 | 0.08 | 0.00 | 0.01 | 0.00 | −0.01 | −0.03 |
| 10 | Clothing and footwear | 0.69 | 0.01 | 0.04 | 0.07 | 0.16 | 0.00 | 0.00 | 0.00 | 0.00 | 0.00 |
| 11 | Gasoline and other energy goods | 0.25 | 0.02 | 0.02 | 0.01 | 0.00 | 0.00 | 0.00 | 0.00 | 0.01 | −0.02 |
| 12 | Other nondurable goods | 0.58 | 0.19 | 0.22 | 0.28 | 0.30 | 0.00 | 0.00 | 0.00 | 0.00 | −0.03 |
| 13 | Services | 5.09 | 3.14 | 1.73 | 2.02 | 1.72 | 0.05 | −0.07 | −0.26 | −0.02 | 0.10 |
| 14 | Household consumption expenditures (for services) | 5.62 | 2.87 | 1.88 | 1.88 | 1.83 | 0.05 | −0.08 | −0.27 | −0.02 | 0.11 |
| 15 | Housing and utilities | 0.52 | 0.47 | 0.22 | 0.27 | 0.32 | 0.00 | 0.00 | −0.01 | −0.01 | 0.09 |
| 16 | Health care | 1.49 | 0.67 | 0.99 | 0.93 | 0.76 | 0.00 | 0.00 | 0.03 | 0.05 | 0.04 |
| 17 | Transportation services | 0.57 | 0.30 | 0.02 | 0.15 | 0.10 | 0.00 | 0.00 | 0.00 | 0.00 | −0.01 |
| 18 | Recreation services | 0.63 | 0.41 | 0.12 | 0.03 | 0.05 | 0.00 | 0.00 | −0.03 | −0.03 | −0.01 |
| 19 | Food services and accommodations | 1.20 | 0.61 | 0.27 | 0.10 | 0.12 | 0.00 | 0.00 | 0.00 | −0.01 | 0.01 |
| 20 | Financial services and insurance | 0.39 | −0.04 | 0.04 | 0.19 | 0.26 | 0.10 | −0.01 | −0.20 | 0.00 | 0.07 |
| 21 | Other services | 0.83 | 0.47 | 0.22 | 0.21 | 0.23 | −0.05 | −0.05 | −0.06 | −0.04 | −0.07 |
| 22 | Final consumption expenditures of nonprofit institutions serving households1 | −0.53 | 0.27 | −0.15 | 0.14 | −0.11 | 0.00 | 0.01 | 0.00 | 0.00 | 0.00 |
| 23 | Gross output of nonprofit institutions2 | 0.20 | 0.37 | 0.21 | 0.44 | 0.20 | 0.00 | 0.00 | −0.01 | 0.00 | 0.00 |
| 24 | Less: Receipts from sales of goods and services by nonprofit institutions3 | 0.73 | 0.10 | 0.36 | 0.30 | 0.31 | 0.00 | −0.01 | −0.02 | −0.01 | 0.01 |
- PCE
- Personal consumption expenditures
- Net expenses of NPISHs, defined as their gross operating expenses less primary sales to households.
- Gross output is net of unrelated sales, secondary sales, and sales to business, to government, and to the rest of the world; excludes own-account investment (construction and software).
- Excludes unrelated sales, secondary sales, and sales to business, to government, and to the rest of the world; includes membership dues and fees.
Note. Contributions are from National Income and Product Accounts table 2.3.2.
U.S. Bureau of Economic Analysis
| Line | Series | Change from preceding period | Revision in percent change | ||||||||
|---|---|---|---|---|---|---|---|---|---|---|---|
| Percent | Percentage points | ||||||||||
| 2021 | 2022 | 2023 | 2024 | 2025 | 2021 | 2022 | 2023 | 2024 | 2025 | ||
| 1 | Private fixed investment | 7.4 | 2.4 | 3.7 | 3.7 | 3.6 | 0.1 | −0.1 | 0.3 | 0.7 | 0.9 |
| 2 | Nonresidential | 6.3 | 6.4 | 7.7 | 3.9 | 5.4 | 0.1 | −0.1 | 0.4 | 1.0 | 1.3 |
| 3 | Structures | −2.7 | 3.4 | 16.1 | 3.8 | −2.2 | 0.0 | −0.1 | −0.6 | 2.7 | 3.1 |
| 4 | Commercial and health care | −3.7 | −3.0 | 5.3 | −3.1 | 2.3 | 0.0 | 0.0 | 0.0 | 3.3 | 8.2 |
| 5 | Manufacturing | 3.2 | 24.2 | 51.7 | 20.8 | −13.2 | 0.0 | 0.0 | 0.0 | 4.2 | −5.5 |
| 6 | Power and communication | −4.7 | −7.0 | 13.4 | 4.6 | 0.9 | 0.0 | −0.1 | −3.0 | 0.7 | −2.1 |
| 7 | Mining exploration, shafts, and wells1 | 17.6 | 20.6 | 5.3 | −6.8 | 1.9 | 0.2 | −0.5 | 0.0 | −1.5 | 13.6 |
| 8 | Other structures2 | −12.1 | 2.2 | 14.6 | 1.2 | 0.7 | −0.1 | 0.0 | 0.0 | 4.3 | 5.7 |
| 9 | Equipment | 7.2 | 2.8 | 4.9 | 3.3 | 8.8 | 0.1 | 0.0 | 2.0 | −0.2 | 0.5 |
| 10 | Information processing equipment | 11.1 | 6.7 | −1.6 | 5.2 | 23.8 | 0.4 | 0.3 | 2.2 | −0.4 | 1.9 |
| 11 | Computers and peripheral equipment | 14.5 | 5.1 | −7.7 | 20.6 | 53.1 | 0.0 | 0.1 | −0.4 | 1.1 | 4.1 |
| 12 | Other3 | 9.5 | 7.4 | 1.5 | −1.7 | 8.2 | 0.6 | 0.2 | 3.5 | −0.8 | 1.1 |
| 13 | Industrial equipment | 6.8 | 1.0 | 4.1 | 1.3 | 2.1 | 0.1 | −0.4 | 3.8 | 0.0 | −0.9 |
| 14 | Transportation equipment | 3.5 | −0.2 | 26.9 | 4.8 | 3.6 | −0.1 | −0.1 | 1.2 | −0.2 | 0.0 |
| 15 | Other equipment4 | 4.6 | 0.9 | −1.0 | 0.9 | −2.5 | −0.1 | 0.1 | 0.7 | −0.2 | 0.3 |
| 16 | Intellectual property products | 10.4 | 11.6 | 5.6 | 4.6 | 6.8 | 0.0 | −0.1 | −0.6 | 1.1 | 1.2 |
| 17 | Software5 | 14.9 | 15.0 | 6.1 | 6.8 | 12.2 | 0.0 | 0.1 | −1.1 | 0.1 | 1.1 |
| 18 | Research and development6 | 8.6 | 9.6 | 5.7 | 3.5 | 3.7 | 0.0 | −0.1 | −0.2 | 2.1 | 1.6 |
| 19 | Entertainment, literary, and artistic originals | −1.4 | 6.9 | 2.2 | −0.6 | −3.1 | 0.0 | 0.0 | −0.1 | −0.1 | −0.6 |
| 20 | Residential | 10.7 | −8.2 | −8.1 | 3.2 | −2.7 | 0.1 | −0.1 | −0.3 | 0.0 | −0.5 |
| 21 | Structures | 10.7 | −8.3 | −8.4 | 3.1 | −2.7 | 0.1 | 0.0 | −0.3 | 0.0 | −0.4 |
| 22 | Permanent site | 20.2 | −6.6 | −8.5 | 2.1 | −6.3 | 0.0 | 0.0 | 0.0 | 0.4 | 0.6 |
| 23 | Single family | 22.6 | −7.8 | −14.5 | 6.3 | −4.3 | 0.0 | 0.0 | 0.0 | 0.0 | 1.4 |
| 24 | Multifamily | 11.7 | −1.4 | 15.1 | −9.9 | −12.9 | −0.1 | 0.0 | 0.0 | 1.7 | −2.2 |
| 25 | Other structures7 | 3.2 | −10.0 | −8.3 | 4.1 | 0.6 | 0.1 | −0.2 | −0.6 | −0.4 | −1.4 |
| 26 | Equipment | 8.6 | −0.6 | 5.2 | 5.2 | 2.3 | 0.0 | 0.0 | 0.0 | −0.1 | −0.4 |
- Includes petroleum and mineral exploration.
- Consists primarily of religious, educational, vocational, lodging, railroads, farm, and amusement and recreational structures, net purchases of used structures, and brokers’ commissions on the sale of structures.
- Includes communication equipment, nonmedical instruments, medical equipment and instruments, photocopy and related equipment, and office and accounting equipment.
- Consists primarily of furniture and fixtures, agricultural machinery, construction machinery, mining and oilfield machinery, service industry machinery, and electrical equipment not elsewhere classified.
- Excludes software embedded, or bundled, in computers and “other equipment.”
- Includes research and development expenditures for software.
- Consists primarily of manufactured homes, improvements, dormitories, net purchases of used structures, and brokers’ commissions on the sale of residential structures and adjoining land, and other ownership transfer costs.
Note. Percent changes are from National Income and Product Accounts table 5.3.1.
U.S. Bureau of Economic Analysis
| Line | Series | Contributions to percent change | Revision in contributions to percent change | ||||||||
|---|---|---|---|---|---|---|---|---|---|---|---|
| 2021 | 2022 | 2023 | 2024 | 2025 | 2021 | 2022 | 2023 | 2024 | 2025 | ||
| Percent change from preceding period: | |||||||||||
| 1 | Private fixed investment | 7.4 | 2.4 | 3.7 | 3.7 | 3.6 | 0.1 | −0.1 | 0.3 | 0.7 | 0.9 |
| Percentage points: | |||||||||||
| 2 | Nonresidential | 4.71 | 4.67 | 5.72 | 3.03 | 4.21 | 0.05 | −0.04 | 0.30 | 0.76 | 1.05 |
| 3 | Structures | −0.45 | 0.52 | 2.64 | 0.70 | −0.40 | 0.00 | −0.01 | −0.09 | 0.49 | 0.54 |
| 4 | Commercial and health care | −0.21 | −0.17 | 0.31 | −0.18 | 0.12 | 0.00 | 0.00 | 0.00 | 0.20 | 0.44 |
| 5 | Manufacturing | 0.06 | 0.50 | 1.41 | 0.83 | −0.61 | 0.00 | 0.00 | 0.00 | 0.16 | −0.26 |
| 6 | Power and communication | −0.17 | −0.22 | 0.39 | 0.15 | 0.03 | 0.00 | 0.00 | −0.09 | 0.03 | −0.06 |
| 7 | Mining exploration, shafts, and wells1 | 0.29 | 0.35 | 0.11 | −0.14 | 0.03 | 0.00 | 0.00 | 0.00 | −0.03 | 0.24 |
| 8 | Other structures2 | −0.43 | 0.06 | 0.43 | 0.04 | 0.02 | −0.01 | 0.00 | −0.01 | 0.14 | 0.18 |
| 9 | Equipment | 2.08 | 0.79 | 1.38 | 0.95 | 2.54 | 0.04 | 0.00 | 0.56 | −0.04 | 0.18 |
| 10 | Information processing equipment | 1.15 | 0.68 | −0.16 | 0.50 | 2.33 | 0.04 | 0.02 | 0.23 | −0.02 | 0.22 |
| 11 | Computers and peripheral equipment | 0.48 | 0.17 | −0.26 | 0.61 | 1.81 | 0.00 | 0.00 | −0.01 | 0.03 | 0.13 |
| 12 | Other3 | 0.67 | 0.51 | 0.10 | −0.11 | 0.52 | 0.04 | 0.02 | 0.24 | −0.05 | 0.08 |
| 13 | Industrial equipment | 0.43 | 0.06 | 0.26 | 0.08 | 0.13 | 0.00 | −0.03 | 0.24 | 0.00 | −0.06 |
| 14 | Transportation equipment | 0.19 | −0.01 | 1.36 | 0.30 | 0.23 | −0.01 | 0.00 | 0.06 | −0.02 | −0.01 |
| 15 | Other equipment4 | 0.31 | 0.06 | −0.07 | 0.06 | −0.16 | 0.00 | 0.01 | 0.04 | −0.01 | 0.01 |
| 16 | Intellectual property products | 3.08 | 3.36 | 1.70 | 1.39 | 2.07 | 0.01 | −0.03 | −0.17 | 0.32 | 0.34 |
| 17 | Software5 | 1.82 | 1.80 | 0.78 | 0.86 | 1.56 | 0.00 | 0.00 | −0.14 | −0.01 | 0.11 |
| 18 | Research and development6 | 1.29 | 1.41 | 0.87 | 0.54 | 0.58 | 0.01 | −0.03 | −0.03 | 0.33 | 0.25 |
| 19 | Entertainment, literary, and artistic originals | −0.03 | 0.15 | 0.05 | −0.01 | −0.07 | 0.00 | 0.00 | 0.00 | 0.00 | −0.01 |
| 20 | Residential | 2.68 | −2.26 | −2.05 | 0.71 | −0.60 | 0.02 | −0.03 | −0.07 | 0.00 | −0.10 |
| 21 | Structures | 2.64 | −2.25 | −2.07 | 0.69 | −0.61 | 0.02 | −0.02 | −0.07 | 0.00 | −0.10 |
| 22 | Permanent site | 2.20 | −0.85 | −1.04 | 0.23 | −0.68 | 0.00 | 0.00 | 0.00 | 0.05 | 0.06 |
| 23 | Single family | 1.91 | −0.82 | −1.41 | 0.51 | −0.36 | 0.00 | 0.00 | 0.00 | 0.00 | 0.12 |
| 24 | Multifamily | 0.28 | −0.04 | 0.37 | −0.28 | −0.32 | 0.00 | 0.00 | 0.00 | 0.04 | −0.06 |
| 25 | Other structures7 | 0.44 | −1.40 | −1.04 | 0.46 | 0.07 | 0.02 | −0.02 | −0.08 | −0.05 | −0.16 |
| 26 | Equipment | 0.04 | 0.00 | 0.02 | 0.02 | 0.01 | 0.00 | 0.00 | 0.00 | 0.00 | 0.00 |
- Includes petroleum and mineral exploration.
- Consists primarily of religious, educational, vocational, lodging, railroads, farm, and amusement and recreational structures, net purchases of used structures, and brokers’ commissions on the sale of structures.
- Includes communication equipment, nonmedical instruments, medical equipment and instruments, photocopy and related equipment, and office and accounting equipment.
- Consists primarily of furniture and fixtures, agricultural machinery, construction machinery, mining and oilfield machinery, service industry machinery, and electrical equipment not elsewhere classified.
- Excludes software embedded, or bundled, in computers and “other equipment.”
- Includes research and development expenditures for software.
- Consists primarily of manufactured homes, improvements, dormitories, net purchases of used structures, and brokers’ commissions on the sale of residential structures and adjoining land, and other ownership transfer costs.
Note. Percent changes are from National Income and Product Accounts table 5.3.2.
U.S. Bureau of Economic Analysis
| Line | Series | Level | Revision in level | ||||||||
|---|---|---|---|---|---|---|---|---|---|---|---|
| 2021 | 2022 | 2023 | 2024 | 2025 | 2021 | 2022 | 2023 | 2024 | 2025 | ||
| 1 | Change in private inventories | 22.9 | 143.9 | 38.1 | 28.2 | 6.7 | −0.5 | −1.6 | −9.4 | −15.3 | −21.8 |
| 2 | Farm | −2.8 | −10.2 | 6.8 | −9.1 | 0.3 | 0.0 | 0.0 | 0.0 | −9.5 | −16.8 |
| 3 | Mining, utilities, and construction | −19.1 | 3.6 | 5.4 | −1.0 | −0.8 | 0.0 | 0.3 | −2.5 | 0.3 | 0.0 |
| 4 | Manufacturing | −6.5 | 45.0 | 18.3 | 3.6 | −12.1 | 0.0 | −0.1 | −4.3 | −1.5 | −1.6 |
| 5 | Durable-goods industries | −2.8 | 36.0 | 5.6 | 2.2 | −10.8 | 0.0 | −0.1 | −4.2 | −1.2 | −1.3 |
| 6 | Nondurable-goods industries | −3.8 | 9.1 | 12.7 | 1.4 | −1.0 | −0.1 | 0.0 | −0.1 | −0.3 | 0.1 |
| 7 | Wholesale trade | 39.7 | 79.0 | −7.8 | −7.7 | 6.0 | −0.1 | 0.0 | 1.5 | −1.5 | 1.7 |
| 8 | Durable-goods industries | 33.9 | 64.6 | −5.8 | −6.0 | −3.4 | 0.0 | 0.0 | 1.5 | −1.0 | −0.1 |
| 9 | Nondurable-goods industries | 6.3 | 16.1 | −2.1 | −1.7 | 9.4 | −0.1 | 0.0 | 0.0 | −0.5 | 1.8 |
| 10 | Retail trade | 4.2 | 30.6 | 14.3 | 37.5 | 5.0 | −0.4 | −0.1 | −0.5 | 0.7 | −0.6 |
| 11 | Motor vehicle and parts dealers | −37.2 | 16.8 | 33.2 | 27.4 | 1.5 | 0.0 | 0.0 | −0.7 | 0.6 | −0.1 |
| 12 | Food and beverage stores | −1.4 | 0.5 | 0.9 | 0.5 | 1.2 | −0.1 | −0.1 | 0.0 | 0.0 | 0.2 |
| 13 | General merchandise stores | 10.5 | 4.3 | −2.8 | 3.6 | −1.6 | 0.0 | 0.0 | 0.0 | 0.0 | −0.6 |
| 14 | Other retail stores | 34.1 | 8.9 | −16.9 | 6.3 | 3.7 | −0.1 | 0.0 | 0.1 | −0.1 | −0.1 |
| 15 | Other industries | 7.9 | −4.2 | 0.8 | 6.5 | 7.8 | 0.0 | −1.6 | −3.1 | −2.5 | 0.8 |
| 16 | Residual | −2.7 | −1.5 | 0.3 | −1.8 | 0.4 | −0.1 | −0.1 | −0.5 | −1.1 | −5.7 |
Note. Levels are from National Income and Product Accounts table 5.7.6B. The chained-dollar series are calculated as the period-to-period change in end-of-period inventories. Because the formula for the chain-type quantity indexes uses weights of more than one period, chained-dollar estimates are usually not additive.
U.S. Bureau of Economic Analysis
| Line | Series | Change from preceding period | Revision in change | ||||||||
|---|---|---|---|---|---|---|---|---|---|---|---|
| 2021 | 2022 | 2023 | 2024 | 2025 | 2021 | 2022 | 2023 | 2024 | 2025 | ||
| 1 | Change in private inventories | 46.8 | 121.0 | −105.8 | −9.9 | −21.5 | −0.5 | −1.1 | −7.7 | −5.9 | −6.5 |
| 2 | Farm | 9.1 | −7.4 | 17.0 | −16.0 | 9.5 | 0.0 | 0.0 | 0.0 | −9.5 | −7.4 |
| 3 | Mining, utilities, and construction | −22.5 | 22.7 | 1.8 | −6.4 | 0.2 | 0.0 | 0.3 | −2.7 | 2.8 | −0.3 |
| 4 | Manufacturing | −9.4 | 51.5 | −26.7 | −14.7 | −15.7 | 0.0 | −0.1 | −4.2 | 2.7 | 0.0 |
| 5 | Durable-goods industries | −1.7 | 38.8 | −30.5 | −3.4 | −13.0 | 0.0 | −0.1 | −4.2 | 3.0 | 0.0 |
| 6 | Nondurable-goods industries | −7.9 | 12.8 | 3.6 | −11.2 | −2.4 | −0.1 | 0.0 | 0.0 | −0.2 | 0.4 |
| 7 | Wholesale trade | 59.9 | 39.3 | −86.8 | 0.1 | 13.7 | −0.1 | 0.1 | 1.5 | −3.0 | 3.3 |
| 8 | Durable-goods industries | 65.3 | 30.7 | −70.3 | −0.2 | 2.6 | 0.0 | 0.0 | 1.6 | −2.6 | 0.9 |
| 9 | Nondurable-goods industries | −4.4 | 9.8 | −18.2 | 0.4 | 11.1 | −0.1 | 0.1 | 0.0 | −0.5 | 2.3 |
| 10 | Retail trade | 15.7 | 26.4 | −16.3 | 23.2 | −32.5 | −0.4 | 0.3 | −0.4 | 1.1 | −1.2 |
| 11 | Motor vehicle and parts dealers | −22.4 | 54.0 | 16.4 | −5.7 | −25.9 | 0.0 | 0.0 | −0.7 | 1.3 | −0.7 |
| 12 | Food and beverage stores | −2.4 | 1.9 | 0.4 | −0.5 | 0.7 | −0.1 | 0.0 | 0.1 | 0.0 | 0.1 |
| 13 | General merchandise stores | 14.1 | −6.2 | −7.1 | 6.4 | −5.2 | 0.0 | 0.0 | 0.0 | 0.0 | −0.6 |
| 14 | Other retail stores | 28.4 | −25.2 | −25.8 | 23.3 | −2.7 | −0.1 | 0.1 | 0.2 | −0.2 | −0.1 |
| 15 | Other industries | −4.2 | −12.2 | 5.0 | 5.7 | 1.3 | 0.0 | −1.5 | −1.5 | 0.6 | 3.4 |
Note. Levels are from National Income and Product Accounts table 5.7.6B. The chained-dollar series are calculated as the period-to-period change in end-of-period inventories. Because the formula for the chain-type quantity indexes uses weights of more than one period, chained-dollar estimates are usually not additive.
U.S. Bureau of Economic Analysis
| Line | Series | Change from preceding period | Revision in percent change | ||||||||
|---|---|---|---|---|---|---|---|---|---|---|---|
| Percent | Percentage points | ||||||||||
| 2021 | 2022 | 2023 | 2024 | 2025 | 2021 | 2022 | 2023 | 2024 | 2025 | ||
| 1 | Exports of goods and services | 6.5 | 7.6 | 2.8 | 3.6 | 2.1 | 0.0 | 0.0 | 0.0 | 0.0 | 0.5 |
| 2 | Exports of goods | 7.7 | 6.0 | 1.9 | 2.1 | 1.0 | 0.0 | −0.1 | −0.3 | 0.1 | −0.8 |
| 3 | Foods, feeds, and beverages | −4.9 | −2.8 | −5.4 | 9.6 | −4.8 | 0.0 | 0.1 | 0.0 | 0.1 | −2.4 |
| 4 | Industrial supplies and materials | 1.9 | 7.3 | 0.9 | 0.1 | −2.6 | −0.1 | 0.0 | −0.1 | −0.1 | −1.5 |
| 5 | Capital goods, except automotive | 11.0 | 5.7 | 2.1 | 5.8 | 8.5 | 0.0 | −0.3 | −0.7 | 0.1 | −0.7 |
| 6 | Automotive vehicles, engines, and parts | 11.9 | 7.1 | 7.0 | −7.2 | −9.5 | 0.0 | 0.0 | 0.0 | 0.2 | 0.7 |
| 7 | Consumer goods, except food and automotive | 26.4 | 7.7 | 3.1 | 0.9 | 0.8 | 0.0 | −0.1 | 0.0 | 0.0 | −0.8 |
| 8 | Other1 | 1.7 | 10.0 | 11.2 | 1.2 | 6.4 | 0.0 | 0.0 | −0.1 | 0.2 | 2.8 |
| 9 | Exports of services | 4.0 | 10.9 | 4.6 | 6.4 | 3.9 | 0.0 | 0.0 | 0.5 | −0.3 | 2.7 |
| 10 | Transport | 7.7 | 21.7 | 8.7 | 5.1 | 1.2 | 0.1 | −1.5 | −0.1 | −0.7 | −3.8 |
| 11 | Travel (for all purposes including education) | −3.6 | 86.3 | 28.6 | 10.1 | −0.8 | −0.1 | 0.1 | 0.6 | −0.9 | 1.5 |
| 12 | Charges for the use of intellectual property n.e.c. | 10.8 | 0.1 | −4.8 | 11.1 | 11.2 | 0.1 | 0.0 | 1.4 | −0.5 | 7.7 |
| 13 | Other business services2 | 3.2 | 1.6 | 0.0 | 5.1 | 5.1 | 0.0 | 0.3 | 0.4 | 0.1 | 3.1 |
| 14 | Government goods and services n.e.c. | −0.3 | 21.3 | 8.2 | −9.0 | −19.7 | 0.0 | 0.1 | 0.1 | 0.0 | −0.6 |
| 15 | Other | −4.0 | −9.0 | 19.6 | 15.9 | 8.5 | 0.0 | 0.0 | 0.2 | −0.4 | 3.4 |
- n.e.c.
- Not elsewhere classified
- Includes net exports of goods under merchanting, beginning in 1999, reclassified from services to goods.
- Includes maintenance and repair services, insurance services, financial services, telecommunication, computer and information services, personal, cultural, and recreational services, construction services, and “other business services.”
Note. Percent changes are from National Income and Product Accounts table 4.2.1.
U.S. Bureau of Economic Analysis
| Line | Series | Contributions to percent change | Revision in contribution to percent change | ||||||||
|---|---|---|---|---|---|---|---|---|---|---|---|
| 2021 | 2022 | 2023 | 2024 | 2025 | 2021 | 2022 | 2023 | 2024 | 2025 | ||
| Percent change from preceding period: | |||||||||||
| 1 | Exports of goods and services | 6.5 | 7.6 | 2.8 | 3.6 | 2.1 | 0.0 | 0.0 | 0.0 | 0.0 | 0.5 |
| Percentage points: | |||||||||||
| 2 | Exports of goods | 5.10 | 4.14 | 1.30 | 1.35 | 0.65 | −0.01 | −0.06 | −0.16 | 0.02 | −0.52 |
| 3 | Foods, feeds, and beverages | −0.33 | −0.18 | −0.31 | 0.49 | −0.25 | 0.00 | 0.01 | 0.00 | 0.00 | −0.12 |
| 4 | Industrial supplies and materials | 0.44 | 1.87 | 0.24 | 0.03 | −0.56 | −0.01 | 0.01 | −0.01 | −0.02 | −0.32 |
| 5 | Capital goods, except automotive | 2.25 | 1.12 | 0.40 | 1.14 | 1.70 | 0.01 | −0.07 | −0.14 | 0.01 | −0.15 |
| 6 | Automotive vehicles, engines, and parts | 0.68 | 0.39 | 0.38 | −0.42 | −0.51 | 0.00 | 0.00 | −0.01 | 0.02 | 0.04 |
| 7 | Consumer goods, except food and automotive | 2.02 | 0.65 | 0.25 | 0.07 | 0.07 | 0.00 | 0.00 | 0.00 | −0.01 | −0.06 |
| 8 | Other1 | 0.05 | 0.30 | 0.34 | 0.04 | 0.20 | 0.00 | 0.00 | 0.00 | 0.01 | 0.09 |
| 9 | Exports of services | 1.35 | 3.43 | 1.50 | 2.23 | 1.43 | 0.00 | 0.01 | 0.17 | −0.08 | 1.01 |
| 10 | Transport | 0.20 | 0.57 | 0.26 | 0.16 | 0.04 | 0.00 | −0.04 | 0.00 | −0.02 | −0.12 |
| 11 | Travel (for all purposes including education) | −0.12 | 2.38 | 1.38 | 0.63 | −0.05 | −0.01 | 0.00 | 0.02 | −0.05 | 0.10 |
| 12 | Charges for the use of intellectual property n.e.c. | 0.60 | 0.01 | −0.25 | 0.55 | 0.60 | 0.01 | 0.00 | 0.07 | −0.02 | 0.42 |
| 13 | Other business services2 | 0.68 | 0.30 | 0.00 | 0.98 | 1.03 | 0.00 | 0.05 | 0.07 | 0.02 | 0.62 |
| 14 | Government goods and services n.e.c. | 0.00 | 0.19 | 0.08 | −0.10 | −0.19 | 0.00 | 0.00 | 0.00 | 0.00 | 0.00 |
| 15 | Other | −0.01 | −0.01 | 0.02 | 0.02 | 0.01 | 0.00 | 0.00 | 0.00 | 0.00 | 0.00 |
- n.e.c.
- Not elsewhere classified
- Includes net exports of goods under merchanting, beginning in 1999, reclassified from services to goods.
- Includes maintenance and repair services, insurance services, financial services, telecommunication, computer and information services, personal, cultural, and recreational services, construction services, and “other business services.”
Note. Contributions are from National Income and Product Accounts table 4.2.2.
U.S. Bureau of Economic Analysis
| Line | Series | Change from preceding period | Revision in percent change | ||||||||
|---|---|---|---|---|---|---|---|---|---|---|---|
| Percent | Percentage points | ||||||||||
| 2021 | 2022 | 2023 | 2024 | 2025 | 2021 | 2022 | 2023 | 2024 | 2025 | ||
| 1 | Imports of goods and services | 14.3 | 8.2 | −0.8 | 5.9 | 3.6 | −0.3 | −0.3 | 0.1 | 0.1 | 0.9 |
| 2 | Imports of goods | 14.5 | 6.7 | −1.9 | 5.1 | 2.7 | 0.0 | 0.0 | 0.0 | −0.1 | 0.2 |
| 3 | Foods, feeds, and beverages | 9.3 | 5.2 | −5.6 | 1.9 | −2.9 | 0.0 | 0.0 | 0.0 | 0.0 | 0.1 |
| 4 | Industrial supplies and materials | 11.1 | 1.9 | −4.1 | 0.6 | −6.3 | 0.3 | −0.1 | −0.1 | 0.0 | 0.3 |
| 5 | Capital goods, except automotive | 16.5 | 10.4 | −1.5 | 11.8 | 16.0 | 0.0 | 0.0 | 0.0 | −0.1 | 0.4 |
| 6 | Automotive vehicles, engines, and parts | 10.0 | 11.4 | 12.4 | 1.2 | −10.1 | 0.0 | 0.0 | 0.0 | −0.3 | −0.1 |
| 7 | Consumer goods, except food and automotive | 20.6 | 8.6 | −8.3 | 5.9 | 0.7 | −0.1 | 0.0 | 0.0 | −0.3 | 0.3 |
| 8 | Other | 5.6 | −9.0 | 9.5 | −1.7 | 14.9 | 0.0 | 0.1 | 0.0 | 1.3 | −1.5 |
| 9 | Imports of services | 13.0 | 15.9 | 4.1 | 9.3 | 7.1 | −2.0 | −1.2 | 0.3 | 1.1 | 3.6 |
| 10 | Transport | 17.7 | 22.1 | −14.4 | 6.9 | 1.2 | −13.5 | −6.9 | −5.8 | −0.3 | −1.7 |
| 11 | Travel (for all purposes including education) | 73.6 | 101.6 | 30.2 | 14.8 | 6.2 | 0.0 | 0.7 | 0.0 | −0.7 | 1.5 |
| 12 | Charges for the use of intellectual property n.e.c. | 1.6 | 15.6 | −11.1 | 2.9 | 3.8 | 0.0 | −0.1 | 3.5 | 2.6 | 10.6 |
| 13 | Other business services1 | 8.0 | 1.0 | 5.7 | 9.8 | 10.4 | 0.0 | 0.5 | 1.4 | 2.1 | 5.2 |
| 14 | Government goods and services n.e.c. | −4.5 | −0.6 | −6.5 | −4.0 | −7.6 | 0.0 | 0.0 | 0.8 | −0.5 | −2.2 |
| 15 | Other | 14.5 | −15.5 | 0.7 | 0.6 | −4.1 | −0.8 | −0.3 | 0.2 | −0.2 | 1.5 |
- n.e.c.
- Not elsewhere classified
- Includes maintenance and repair services, insurance services, financial services, telecommunication, computer and information services, personal, cultural, and recreational services, construction services, and “other business services.”
Note. Percent changes are from National Income and Product Accounts table 4.2.1.
U.S. Bureau of Economic Analysis
| Line | Series | Contributions to percent change | Revision in contribution to percent change | ||||||||
|---|---|---|---|---|---|---|---|---|---|---|---|
| 2021 | 2022 | 2023 | 2024 | 2025 | 2021 | 2022 | 2023 | 2024 | 2025 | ||
| Percent change from preceding period: | |||||||||||
| 1 | Imports of goods and services | 14.3 | 8.2 | −0.8 | 5.9 | 3.6 | −0.3 | −0.3 | 0.1 | 0.1 | 0.9 |
| Percentage points: | |||||||||||
| 2 | Imports of goods | 12.07 | 5.6 | −1.58 | 4.1 | 2.13 | 0.06 | 0.01 | −0.02 | −0.02 | 0.13 |
| 3 | Foods, feeds, and beverages | 0.52 | 0.28 | −0.3 | 0.1 | −0.16 | 0.00 | 0.00 | 0.00 | 0.00 | 0.00 |
| 4 | Industrial supplies and materials | 1.91 | 0.38 | −0.78 | 0.11 | −1 | 0.06 | −0.02 | −0.02 | 0.01 | 0.04 |
| 5 | Capital goods, except automotive | 3.73 | 2.28 | −0.33 | 2.64 | 3.78 | 0.00 | 0.01 | 0.00 | −0.02 | 0.10 |
| 6 | Automotive vehicles, engines, and parts | 1.08 | 1.14 | 1.28 | 0.15 | −1.16 | 0.00 | 0.00 | 0.01 | −0.02 | −0.01 |
| 7 | Consumer goods, except food and automotive | 4.58 | 1.89 | −1.78 | 1.17 | 0.14 | 0.00 | 0.01 | −0.02 | −0.04 | 0.04 |
| 8 | Other | 0.26 | −0.37 | 0.33 | −0.07 | 0.53 | 0.00 | 0.00 | 0.00 | 0.05 | −0.05 |
| 9 | Imports of services | 2.20 | 2.64 | 0.75 | 1.83 | 1.45 | −0.36 | −0.23 | 0.06 | 0.18 | 0.72 |
| 10 | Transport | 0.47 | 0.65 | −0.50 | 0.21 | 0.03 | −0.36 | −0.29 | −0.16 | −0.06 | −0.08 |
| 11 | Travel (for all purposes including education) | 0.88 | 1.71 | 0.93 | 0.60 | 0.27 | 0.00 | 0.02 | 0.01 | −0.02 | 0.06 |
| 12 | Charges for the use of intellectual property n.e.c. | 0.03 | 0.22 | −0.17 | 0.04 | 0.05 | 0.00 | 0.00 | 0.06 | 0.04 | 0.14 |
| 13 | Other business services1 | 0.84 | 0.09 | 0.53 | 1.01 | 1.15 | 0.01 | 0.04 | 0.14 | 0.24 | 0.60 |
| 14 | Government goods and services n.e.c. | −0.04 | 0.00 | −0.04 | −0.03 | −0.05 | 0.00 | 0.00 | 0.01 | −0.01 | −0.01 |
| 15 | Other | 0.03 | −0.03 | 0.00 | 0.00 | −0.01 | 0.00 | 0.00 | 0.00 | 0.00 | 0.00 |
- n.e.c.
- Not elsewhere classified
- Includes maintenance and repair services, insurance services, financial services, telecommunication, computer and information services, personal, cultural, and recreational services, construction services, and “other business services.”
Note. Contributions are from National Income and Product Accounts table 4.2.2.
U.S. Bureau of Economic Analysis
| Line | Series | Change from preceding period | Revision in percent change | ||||||||
|---|---|---|---|---|---|---|---|---|---|---|---|
| Percent | Percentage points | ||||||||||
| 2021 | 2022 | 2023 | 2024 | 2025 | 2021 | 2022 | 2023 | 2024 | 2025 | ||
| 1 | Government consumption expenditures and gross investment | 0.1 | −1.5 | 4.5 | 4.5 | 1.6 | 0.2 | −0.3 | 1.0 | 0.7 | 0.5 |
| 2 | Consumption expenditures1 | 0.7 | −1.6 | 4.1 | 4.2 | 1.3 | 0.2 | −0.3 | 1.1 | 0.9 | 0.7 |
| 3 | Gross investment2 | −2.4 | −1.0 | 5.9 | 5.4 | 2.9 | 0.1 | −0.1 | 0.3 | −0.5 | −0.3 |
| 4 | Federal | 1.9 | −3.3 | 3.5 | 3.6 | −1.3 | 0.0 | 0.0 | 0.2 | −0.2 | −0.1 |
| 5 | National defense | −0.8 | −3.7 | 3.7 | 3.5 | 0.9 | 0.1 | 0.1 | 0.0 | −0.5 | −0.3 |
| 6 | Consumption expenditures | −0.7 | −4.7 | 3.2 | 3.9 | 1.0 | 0.1 | 0.1 | 0.0 | −0.1 | 0.9 |
| 7 | Gross investment | −1.2 | 0.0 | 5.5 | 2.1 | 0.3 | 0.2 | 0.0 | 0.1 | −1.8 | −5.0 |
| 8 | Nondefense | 5.7 | −2.8 | 3.1 | 3.8 | −4.1 | 0.0 | −0.1 | 0.3 | 0.2 | 0.1 |
| 9 | Consumption expenditures | 5.8 | −5.5 | 4.6 | 5.6 | −7.1 | 0.0 | 0.0 | 0.1 | 2.2 | −1.9 |
| 10 | Gross investment | 5.4 | 4.3 | −0.6 | −1.1 | 4.8 | 0.1 | −0.2 | 0.6 | −5.2 | 6.5 |
| 11 | State and local | −1.0 | −0.4 | 5.1 | 5.0 | 3.3 | 0.3 | −0.4 | 1.5 | 1.2 | 0.8 |
| 12 | Consumption expenditures | 0.1 | 0.3 | 4.3 | 4.0 | 3.4 | 0.4 | −0.5 | 1.8 | 1.0 | 1.3 |
| 13 | Gross investment | −5.9 | −3.6 | 8.9 | 9.2 | 3.2 | 0.0 | −0.1 | 0.4 | 1.7 | −1.0 |
- Government consumption expenditures are services (such as education and national defense) produced by government that are valued at their cost of production. Excludes government sales to other sectors and government own-account investment (construction, software, and research and development).
- Gross government investment consists of general government and government enterprise expenditures for fixed assets; inventory investment is included in government consumption expenditures.
Note. Percent changes are from National Income and Product Accounts table 3.9.1.
U.S. Bureau of Economic Analysis
| Line | Series | Contributions to percent change | Revision in contribution to percent change | ||||||||
|---|---|---|---|---|---|---|---|---|---|---|---|
| 2021 | 2022 | 2023 | 2024 | 2025 | 2021 | 2022 | 2023 | 2024 | 2025 | ||
| Percent change from preceding period: | |||||||||||
| 1 | Government consumption expenditures and gross investment | 0.1 | −1.5 | 4.5 | 4.5 | 1.6 | 0.2 | −0.3 | 1.0 | 0.7 | 0.5 |
| Percentage points: | |||||||||||
| 2 | Consumption expenditures1 | 0.59 | −1.29 | 3.29 | 3.36 | 1.03 | 0.20 | −0.23 | 0.93 | 0.77 | 0.57 |
| 3 | Gross investment2 | −0.49 | −0.20 | 1.19 | 1.09 | 0.59 | 0.01 | −0.02 | 0.07 | −0.13 | −0.08 |
| 4 | Federal | 0.72 | −1.25 | 1.28 | 1.33 | −0.47 | 0.02 | 0.01 | 0.05 | −0.09 | −0.02 |
| 5 | National defense | −0.18 | −0.79 | 0.78 | 0.73 | 0.18 | 0.01 | 0.02 | 0.00 | −0.12 | −0.07 |
| 6 | Consumption expenditures | −0.12 | −0.79 | 0.54 | 0.64 | 0.17 | 0.01 | 0.02 | 0.00 | −0.03 | 0.16 |
| 7 | Gross investment | −0.06 | 0.00 | 0.25 | 0.09 | 0.01 | 0.00 | 0.00 | 0.01 | −0.08 | −0.23 |
| 8 | Nondefense | 0.90 | −0.46 | 0.50 | 0.60 | −0.65 | 0.00 | −0.02 | 0.05 | 0.02 | 0.05 |
| 9 | Consumption expenditures | 0.66 | −0.65 | 0.53 | 0.65 | −0.85 | 0.00 | 0.00 | 0.02 | 0.25 | −0.23 |
| 10 | Gross investment | 0.24 | 0.19 | −0.03 | −0.05 | 0.20 | 0.01 | −0.01 | 0.02 | −0.23 | 0.27 |
| 11 | State and local | −0.62 | −0.24 | 3.20 | 3.12 | 2.09 | 0.19 | −0.26 | 0.95 | 0.74 | 0.52 |
| 12 | Consumption expenditures | 0.05 | 0.15 | 2.23 | 2.08 | 1.71 | 0.19 | −0.25 | 0.91 | 0.56 | 0.64 |
| 13 | Gross investment | −0.67 | −0.39 | 0.98 | 1.05 | 0.38 | 0.01 | −0.01 | 0.05 | 0.19 | −0.12 |
- Government consumption expenditures are services (such as education and national defense) produced by government that are valued at their cost of production. Excludes government sales to other sectors and government own-account investment (construction, software, and research and development).
- Gross government investment consists of general government and government enterprise expenditures for fixed assets; inventory investment is included in government consumption expenditures.
Note. Contributions are from National Income and Product Accounts table 3.9.2.
U.S. Bureau of Economic Analysis
| Account 1. Domestic Income and Product Account | |||||
|---|---|---|---|---|---|
| Line | Series | 2025 | Line | Series | 2025 |
| 1 | Compensation of employees, paid | 15,718.9 | 15 | Personal consumption expenditures (3–3) | 20,870.2 |
| 2 | Wages and salaries | 12,999.0 | 16 | Goods | 6,489.2 |
| 3 | Domestic (3–12) | 12,967.0 | 17 | Durable goods | 2,263.8 |
| 4 | Rest of the world (5–15) | 32.1 | 18 | Nondurable goods | 4,225.5 |
| 5 | Supplements to wages and salaries (3–14) | 2,719.9 | 19 | Services | 14,380.9 |
| 6 | Taxes on production and imports (4–15) | 2,233.1 | 20 | Gross private domestic investment | 5,557.2 |
| 7 | Less: Subsidies (4–8) | 122.0 | 21 | Fixed investment (6–2) | 5,550.7 |
| 8 | Net operating surplus | 8,022.2 | 22 | Nonresidential | 4,365.9 |
| 9 | Private enterprises (2–19) | 8,065.4 | 23 | Structures | 957.4 |
| 10 | Current surplus of government enterprises (4–28) | −47.5 | 24 | Equipment | 1,681.4 |
| 11 | Consumption of fixed capital (6–14) | 5,055.5 | 25 | Intellectual property products | 1,727.1 |
| 26 | Residential | 1,182.8 | |||
| 12 | Gross domestic income | 30,907.7 | 27 | Change in private inventories (6–4) | 6.5 |
| 28 | Net exports of goods and services | −921.2 | |||
| 13 | Less: Statistical discrepancy (6–20) | −46.4 | 29 | Exports (5–1) | 3,341.1 |
| 30 | Imports (5–13) | 4,262.3 | |||
| 31 | Government consumption expenditures and gross investment (4–1 plus 6–3) | 5,355.1 | |||
| 32 | Federal | 1,942.8 | |||
| 33 | National defense | 1,124.9 | |||
| 34 | Nondefense | 817.9 | |||
| 35 | State and local | 3,412.3 | |||
| 14 | Gross domestic product | 30,861.3 | 36 | Gross domestic product | 30,861.3 |
| Account 2. Private Enterprise Income Account | |||||
|---|---|---|---|---|---|
| Line | Series | 2025 | Line | Series | 2025 |
| 1 | Income payments on assets | 6,225.8 | 19 | Net operating surplus, private enterprises (1–9) | 8,065.4 |
| 2 | Interest and miscellaneous payments (2–21 and 3–20 and 4–22 and 5–17) | 5,674.0 | 20 | Income receipts on assets | 5,619.9 |
| 3 | Dividend payments to the rest of the world (5–18) | 351.2 | 21 | Interest (2–2 and 3–4 and 4–7 and 5–5) | 4,555.8 |
| 4 | Reinvested earnings on foreign direct investment in the United States (5–19) | 200.6 | 22 | Dividend receipts from the rest of the world (5–6) | 741.6 |
| 5 | Business current transfer payments (net) | 277.8 | 23 | Reinvested earnings on U.S. direct investment abroad (5–7) | 322.6 |
| 6 | To persons (net) (3–24) | 89.5 | |||
| 7 | To government (net) (4–25) | 146.2 | |||
| 8 | To the rest of the world (net) (5–23 less 5–11 less 2–14) | 42.1 | |||
| 9 | Proprietors' income with IVA and CCAdj (3–17) | 2,017.0 | |||
| 10 | Rental income of persons with IVA and CCAdj (3–18) | 1,139.8 | |||
| 11 | Corporate profits with IVA and CCAdj | 4,025.0 | |||
| 12 | Taxes on corporate income | 638.8 | |||
| 13 | To government (4–16) | 623.3 | |||
| 14 | To the rest of the world (5–23) | 15.5 | |||
| 15 | Profits after tax with IVA and CCAdj | 3,386.1 | |||
| 16 | Net dividends (3–21 plus 4–23) | 2,159.0 | |||
| 17 | Undistributed corporate profits with IVA and CCAdj (6–12) | 1,227.2 | |||
| 18 | Uses of private enterprise income | 13,685.4 | 24 | Sources of private enterprise income | 13,685.4 |
| Account 3. Personal Income and Outlay Account | |||||
|---|---|---|---|---|---|
| Line | Series | 2025 | Line | Series | 2025 |
| 1 | Personal current taxes (4–14) | 3,341.6 | 10 | Compensation of employees | 15,696.2 |
| 2 | Personal outlays | 21,744.1 | 11 | Wages and salaries | 12,976.3 |
| 3 | Personal consumption expenditures (1–15) | 20,870.2 | 12 | Domestic (1–3) | 12,967.0 |
| 4 | Personal interest payments (2–21 and 3–20 and 4–22 and 5–17) | 573.1 | 13 | Rest of the world (5–3) | 9.3 |
| 5 | Personal current transfer payments | 300.8 | 14 | Supplements to wages and salaries (1–5) | 2,719.9 |
| 6 | To government (4–26) | 165.5 | 15 | Employer contributions for employee pension and insurance funds | 1,831.8 |
| 7 | To the rest of the world (net) (5–21 less 5–9) | 135.3 | 16 | Employer contributions for government social insurance | 888.1 |
| 8 | Personal saving (6–11) | 1,241.9 | 17 | Proprietors' income with IVA and CCAdj (2–9) | 2,017.0 |
| 18 | Rental income of persons with CCAdj (2–10) | 1,139.8 | |||
| 19 | Personal income receipts on assets | 4,540.6 | |||
| 20 | Personal interest income (2–2 plus 3–4 plus 4–7 plus 5–5 less 2–21 less 4–22 less 5–17) | 2,389.6 | |||
| 21 | Personal dividend income (2–16 less 4–23) | 2,151.0 | |||
| 22 | Personal current transfer receipts | 4,914.0 | |||
| 23 | Government social benefits (4–4) | 4,824.5 | |||
| 24 | From business (net) (2–6) | 89.5 | |||
| 25 | Less: Contributions for government social insurance, domestic (4–19) | 1,980.1 | |||
| 9 | Personal taxes, outlays, and saving | 26,327.6 | 26 | Personal income | 26,327.6 |
| Account 4. Government Receipts and Expenditures Account | |||||
|---|---|---|---|---|---|
| Line | Series | 2025 | Line | Series | 2025 |
| 1 | Consumption expenditures (1–31) | 4,256.5 | 13 | Current tax receipts | 6,240.1 |
| 2 | Current transfer payments | 4,913.6 | 14 | Personal current taxes (3–1) | 3,341.6 |
| 3 | Government social benefits | 4,862.5 | 15 | Taxes on production and imports (1–6) | 2,233.1 |
| 4 | To persons (3–23) | 4,824.5 | 16 | Taxes on corporate income (2–13) | 623.3 |
| 5 | To the rest of the world (5–22) | 38.0 | 17 | Taxes from the rest of the world (5–10) | 42.1 |
| 6 | Other current transfer payments to the rest of the world (5–22) | 51.1 | 18 | Contributions for government social insurance | 1,986.9 |
| 7 | Interest payments (2–21 and 3–20 and 4–22 and 5–17) | 1,494.2 | 19 | From persons (3–25) | 1,980.1 |
| 8 | Subsidies (1–7) | 122.0 | 20 | From the rest of the world (5–10) | 6.8 |
| 9 | Net government saving (6–13) | −1,989.2 | 21 | Income receipts on assets | 299.0 |
| 10 | Federal | −1,777.9 | 22 | Interest and miscellaneous receipts (2–2 and 3–4 and 4–7 and 5–5) | 291.1 |
| 11 | State and local | −211.3 | 23 | Dividends (2–16 less 3–21) | 7.0 |
| 24 | Current transfer receipts | 314.2 | |||
| 25 | From business (net) (2–7) | 146.2 | |||
| 26 | From persons (3–6) | 165.5 | |||
| 27 | From the rest of the world (5–10) | 2.5 | |||
| 28 | Current surplus of government enterprises (1–10) | −43.2 | |||
| 12 | Government current expenditures and net saving | 8,797.0 | 29 | Government current receipts | 8,797.0 |
| Account 5. Foreign Transactions Current Account | |||||
|---|---|---|---|---|---|
| Line | Series | 2025 | Line | Series | 2025 |
| 1 | Exports of goods and services (1–29) | 3,341.1 | 13 | Imports of goods and services (1–30) | 4,262.3 |
| 2 | Income receipts from the rest of the world | 1,564.6 | 14 | Income payments to the rest of the world | 1,579.8 |
| 3 | Wage and salary receipts (3–13) | 9.3 | 15 | Wage and salary payments (1–4) | 32.1 |
| 4 | Income receipts on assets | 1,555.2 | 16 | Income payments on assets | 1,547.7 |
| 5 | Interest (2–21 and 3–20 and 4–22) | 491.1 | 17 | Interest (2–2 and 3–4 and 4–7) | 995.9 |
| 6 | Dividends (2–22) | 741.6 | 18 | Dividends (2–3) | 351.2 |
| 7 | Reinvested earnings on U.S. direct investment abroad (2–23) | 322.6 | 19 | Reinvested earnings on foreign direct investment in the United States (2–4) | 200.6 |
| 8 | Current taxes, contributions for government social insurance, and transfer receipts from the rest of the world | 231.8 | 20 | Current taxes and transfer payments to the rest of the world | 462.3 |
| 9 | To persons (5–21 less 3–7) | 9.8 | 21 | From persons (3–7) | 145.1 |
| 10 | To government (4–17 plus 4–20 plus 4–27) | 51.4 | 22 | From government (4–5 plus 4–6) | 89.0 |
| 11 | To business (2–8) | 170.5 | 23 | From business (2–8 and 2–14) | 228.1 |
| 24 | Balance on current account, national income and product accounts (7–1) | −1,166.9 | |||
| 12 | Current receipts from the rest of the world | 5,137.4 | 25 | Current payments to the res of the world and balance on current account, NIPAs | 5,137.4 |
| Account 6. Domestic Capital Account | |||||
|---|---|---|---|---|---|
| Line | Series | 2025 | Line | Series | 2025 |
| 1 | Gross domestic investment | 6,655.9 | 10 | Net saving | 480.0 |
| 2 | Private fixed investment (1–21) | 5,550.7 | 11 | Personal saving (3–8) | 1,241.9 |
| 3 | Government fixed investment (1–31) | 1,098.7 | 12 | Undistributed corporate profits with IVA and CCAdj (2–17) | 1,227.2 |
| 4 | Change in private inventories (1–27) | 6.5 | 13 | Net government saving (4–9) | −1,989.2 |
| 5 | Capital account transactions (net) (7–2) | −0.5 | 14 | Plus: Consumption of fixed capital (1–11) | 5,055.5 |
| 6 | Transfer payments for catastrophic losses (net) (7–3) | −0.5 | 15 | Private | 4,213.3 |
| 7 | Other capital account transactions (7–4) | 0.1 | 16 | Government | 842.2 |
| 8 | Net lending or net borrowing (−), NIPAs (7–5) | −1,166.4 | 17 | General government | 726.0 |
| 18 | Government enterprises | 116.2 | |||
| 19 | Equals: Gross saving | 5,535.4 | |||
| 20 | Statistical discrepancy (1–13) | −46.4 | |||
| 9 | Gross domestic investment, capital account transactions (net), and net lending, NIPAs | 5,489.0 | 21 | Gross saving and statistical discrepancy | 5,489.0 |
| Account 7. Foreign Transactions Capital Account | |||||
|---|---|---|---|---|---|
| Line | Series | 2025 | Line | Series | 2025 |
| 2 | Capital account transactions (net) (6–5) | −0.5 | |||
| 3 | Transfer payments for catastrophic losses (net) (6–6) | −0.5 | |||
| 4 | Other capital account transactions (6–7) | 0.1 | |||
| 5 | Net lending or net borrowing (−), national income and product accounts (6–8) | −1,166.4 | |||
| 1 | Balance on current account, NIPAs (5–24) | −1,166.9 | 6 | Capital account transactions (net) and net lending, NIPAs (6–5) | −1,166.9 |
- CCAdj
- Capital consumption adjustment
- IVA
- Inventory valuation adjustment
- NIPAs
- National Income and Product Accounts
Note. The seven summary accounts constitute a double-entry accounting system in which each of the entries in a summary account appears again in that account or in one of the other summary accounts. The numbers in parentheses indicate these “counter entries.” In some cases, an entry may be equal to another entry in the summary accounts. For example, supplements to wages and salaries appears in account 1, line 5, and in account 3, line 14. In other cases, an entry may be equal to a combination of other entries (or of parts of other entries). For example, for private enterprise interest payments (account 2, line 2), the counterentry includes parts of private enterprise interest receipts (account 2, line 21), of personal interest income (account 3, line 20), of government interest receipts (account 4, line 22), and of interest payments to the rest of the world (account 5, line 17).
U.S. Bureau of Economic Analysis
- NEA statistics are available in BEA's Interactive Data Application.
- For information about incorporation of source data on a best-change basis, refer to NIPA Handbook: Concepts and Methods of the U.S. National Income and Product Accounts, “Chapter 4: Estimating Methods.”
- For more information, see Mai-Chi Hoang, “2026 Annual Update of the U.S. International Economic Accounts,” Survey of Current Business (July 30, 2026).
- For periods when Census revenues are not available, current-dollar estimates will be informed by market indicators and judgmental trend.
- Consumer spending on professional association dues is deflated using the PCE price index for legal services and therefore is also impacted by this improvement.
- As a subtraction in the calculation of GDP, an increase in imports results in a negative contribution to GDP, and a decrease in imports results in a positive contribution to GDP.
- The ITA revisions for years before 2021 will be incorporated in a future NIPA update.
Suggested citation
Lisa Mataloni, “The 2026 Annual Update of the National Economic Accounts,” Survey of Current Business (September 30, 2026), https://doi.org/10.66137/BLNY5808.
