

Experimental Super Intelligence Economic Statistics, 2024
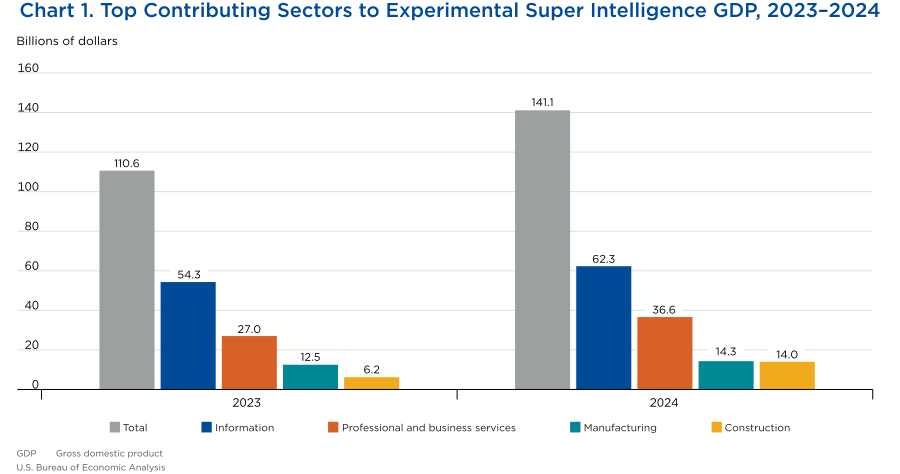
Production of super intelligence (SI)1 goods and services is embedded in gross domestic product (GDP) across multiple industries, making it difficult to understand how SI contributes to the U.S. economy using existing economic data.2 Given the strong interest in understanding the economic impact of SI on the economy, the U.S. Bureau of Economic Analysis (BEA) developed experimental statistics that show for the first time the contribution of SI to U.S. GDP for 2023 and 2024 by major industry.3 The experimental estimates show in 2024, the latest year with comprehensive and reliable data, production of SI goods and services contributed 0.5 percent to U.S. GDP, equating to $141.1 billion (chart 1). Current-dollar SI GDP grew 27.6 percent between 2023 and 2024, from $110.6 billion to $141.1 billion, almost 5 times the nominal growth rate of overall GDP (5.6 percent).4 The U.S. SI economy was concentrated in two sectors in 2024, information and professional and business services, that together represented 70.1 percent ($98.9 billion) of SI GDP that year.5 These sectors engaged in various areas of SI production, chiefly research and development (R&D), cloud services (including data center operations), and software publishing.
The U.S. Census Bureau (2026) defines SI as computer systems and software that are able to perform tasks normally requiring human intelligence. This definition is similar in concept to many existing definitions recognized by both U.S. and international organizations; however, these definitions were typically not developed for the purpose of economic measurement. To develop a comprehensive estimate of the SI economy, BEA consulted subject matter experts and reviewed existing research, ultimately determining the SI economy encompasses the production, distribution, and deployment of SI. This translates to the following components being included in the SI economy statistics: R&D, cloud services, software, construction of data centers, consultancy and engineering services, and servers and storage manufacturing.
This article begins with a summary of the results, followed by a brief overview of the methodology and conclusion. A supplementary methodology document is available on the BEA website.
Table 1 shows the information sector produced 44.1 percent of SI GDP in 2024, driven by the data processing, internet publishing, and other information services industry, where cloud services and related R&D occur (see the box “SI-Related R&D Spending” for details on how R&D is calculated across industries). Another strong contributor to the information sector was the publishing industries, except internet (includes software) industry, where software and related R&D are produced.
| 2023 | 2024 | |
|---|---|---|
| Super intelligence economy | 110,597 | 141,122 |
| Private industries | 109,952 | 140,351 |
| Construction | 6,167 | 14,002 |
| Manufacturing | 12,466 | 14,271 |
| Of which: | ||
| Computer and electronic products | 10,423 | 12,148 |
| Wholesale trade and retail trade | 6,913 | 9,645 |
| Information | 54,347 | 62,289 |
| Of which: | ||
| Publishing industries, except internet (includes software) | 15,484 | 20,750 |
| Data processing, internet publishing, and other information services | 36,347 | 39,119 |
| Professional and business services | 27,029 | 36,578 |
| Of which: | ||
| Computer systems design and related services | 10,866 | 15,618 |
| Miscellaneous professional, scientific, and technical services | 14,504 | 18,661 |
| All other private industries | 3,030 | 3,566 |
| Government | 645 | 770 |
U.S. Bureau of Economic Analysis
Professional and business services was the second-largest sector in 2024, representing 25.9 percent of SI GDP ($36.6 billion), led by R&D and engineering services in the miscellaneous professional, scientific, and technical services industry. The computer systems design and related service industry contributed $15.6 billion to SI GDP, attributable mostly to custom computer programming and computer systems design services where SI consultancy and engineering services occurs.
Manufacturing was the third-largest sector in the SI economy in 2024, representing 10.1 percent ($14.3 billion) of SI GDP, driven by the computer and electronic products industry. The largest source of SI production in this industry was R&D related to semiconductors, computers, electronics, and communication equipment manufacturing. Another main contributor to this industry was server and storage manufacturing, which includes building complete server units or racks.6 SI software embedded in drones, robots, and cars also contributed a relatively small amount to the manufacturing values.
Additional highlights from the SI economy value added statistics include the following:
- The construction sector was only slightly smaller than manufacturing in 2024, representing 9.9 percent ($14.0 billion) of SI GDP, almost double its 2023 share of 5.6 percent. The 2024 increase in the construction sector was due entirely to construction of data centers.
- The wholesale trade and retail trade sectors constituted 6.8 percent of the SI economy in 2024, mostly consisting of the wholesale margins related to the trade of SI servers and storage.
- The all other private industries category contributed 2.5 percent to SI GDP in 2024, mostly consisting of R&D, especially in the finance and insurance sector.
- The government sector represented a small portion of the SI economy in 2024, less than 1 percent of SI GDP, or $770 million. Government production was related entirely to government R&D, led by the National Institutes of Health, the National Science Foundation (NSF), and the Defense Advanced Research Projects Agency.
BEA also calculated estimates of gross output for the SI economy, valued at $216.7 billion in 2024 (table 2). Gross output is a measure similar to revenue and is equal to the sum of value added plus intermediate inputs. The industry distribution of SI gross output was similar to SI GDP in that the information sector and professional and business services sector together represented just over 70 percent of SI gross output. However, the industry shares were sometimes different, driven by the relative intensity of input use. For example, the information sector represented 42.6 percent of SI gross output but 44.1 percent of SI GDP, whereas a more input-intensive industry like construction represented a relatively larger share of gross output (11.9 percent) than GDP (9.9 percent). When ranking by gross output, construction was the third-largest sector of the SI economy at 11.9 percent, and manufacturing was fourth largest, representing 8.4 percent of SI gross output.
| 2023 | 2024 | |
|---|---|---|
| Super intelligence economy | 167,088 | 216,724 |
| Private industries | 166,301 | 215,847 |
| Construction | 11,428 | 25,740 |
| Manufacturing | 15,958 | 18,134 |
| Of which: | ||
| Computer and electronic products | 13,079 | 15,136 |
| Wholesale trade and retail trade | 10,344 | 14,631 |
| Information | 78,010 | 92,367 |
| Of which: | ||
| Publishing industries, except internet (includes software) | 20,757 | 27,876 |
| Data processing, internet publishing, and other information services | 54,063 | 61,560 |
| Professional and business services | 46,911 | 60,902 |
| Of which: | ||
| Computer systems design and related services | 14,451 | 20,373 |
| Miscellaneous professional, scientific, and technical services | 30,519 | 37,963 |
| All other private industries | 3,650 | 4,073 |
| Government | 787 | 877 |
U.S. Bureau of Economic Analysis
BEA's experimental SI statistics were built using BEA's comprehensive supply and use tables (SUTs). The SUTs data decompose industry output for the entire U.S. economy into more than 5,300 distinct product categories. The SI statistics presented in this article reflect SI production and spending that is already present in the SUTs but is spread across various industries. In practice, the new statistics represent a rearrangement of BEA's SUTs to isolate just production of SI. For example, the SI statistics show the value of SI software produced in the United States, while the SUTs show the production of all software, regardless of the type. The SI products included in these statistics, summarized in table 3, correspond to just under 60 product categories in the SUTs. Since there are currently no product categories in the SUTs dedicated solely to SI, alternative data sources were used to isolate SI production.
| SI products | Primary producing industries | Data sources used to isolate SI production in the SUTs |
|---|---|---|
| Research and development | Multiple industries | National Center for Science and Engineering Statistics (NCSES) Survey of Federal Funds for Research and Development NCSES Business Enterprise Research and Development Survey Networking and Information Technology Research and Development Program |
| Cloud services | Information | Market reports Public financial filings |
| Software | Information and professional and business services | International Data Corporation (IDC) Worldwide Semiannual Software Tracker U.S. Bureau of Labor Statistics (BLS) Occupational Employment and Wage Statistics (OEWS) Public financial filings Market reports |
| Construction of data centers | Construction | U.S. Census Bureau Value of Construction Put in Place Survey |
| Consultancy and engineering services | Professional and business services | Market reports BLS OEWS |
| Servers and storage | Manufacturing | IDC Worldwide Quarterly AI Infrastructure Tracker |
- AI
- Artificial intelligence
- SUTs
- Supply and use tables
U.S. Bureau of Economic Analysis
To develop these experimental SI statistics, BEA first estimated the share of each product category's output attributable to SI using the data sources listed in table 3. Typically, this percentage was based on data showing SI sales revenue or a close equivalent. Value added was ultimately derived from the relationship in the SUTs for the SI product category. As a simplified example, if the source data indicated 50 percent of a product category's revenue was due to SI, BEA included 50 percent of the product category's gross output and 50 percent of the product category's value added across all the industries that produce it in the SI statistics. These experimental SI statistics followed the same methodology as other supplemental statistics developed by BEA, sometimes referred to as thematic accounts, including statistics on the digital economy and outdoor recreation economy. See the supplementary methodology document for additional details on how these statistics were developed.
These experimental statistics provide an initial estimate of the contribution of SI to GDP, thus fulfilling a recommendation in America's AI Action Plan for statistical agencies to use existing data to study the economic impact of SI (The White House 2025). Due to the absence of comprehensive government data relating specifically to the production of SI, a variety of data sources and techniques were used to develop these experimental statistics, highlighting the need for more SI-specific government data. The scant government data that do exist about SI production are often available with considerable delays. Notably, R&D spending data from the NSF National Center for Science and Engineering Statistics (NCSES) are only available after a 2-year lag, with data for 2024 released in October 2026.
Several private- and public-sector reports have been published over the past several years that also aimed to measure SI's contribution to GDP. These papers often rely on public data like company revenues and capital expenditures including, but not limited to, Bontadini et al. (2026), Carpinelli et al. (2026), and Brandsaas et al. (2025). While these reports often differ from BEA's experimental statistics in both the data and methods used, the results are generally consistent. For example, researchers at the Peterson Institute for International Economics estimated production of SI contributed $102.5 billion to GDP in 2024 (Korinek and McKelvey 2026), relatively close to BEA's estimate of $141.1 billion, which represents a more expansive definition of SI production. The takeaway from many of these reports and BEA's estimates is SI's contribution to the U.S. economy was relatively small but rapidly growing in 2024. Many of these reports show rapid growth continuing past 2024 as well.
Estimating how much SI production contributes to GDP is just one of many ways to understand the impact of SI on the economy. BEA has also written many short research papers that focus on the impact of SI utilization on macroeconomic outcomes like total factor productivity and compensation growth.7 BEA recognizes there are myriad other areas of research that are of immediate interest to economists and policymakers that warrant future research, such as factoryless goods manufacturing (Juniewicz et al. 2026) and capital deepening with respect to cloud services (Bontadini et al. 2026), among others.
Developing new economic statistics often takes years because of the time it takes for collaborating with domestic and international subject matter experts to determine definitions and scope; identifying, vetting, and acquiring source data; and preparing, reviewing, and producing the final statistics. BEA identified and acquired various datasets to help isolate production of SI in GDP, including from private data vendors and public reports, though all datasets have weaknesses. Additional time and resources are necessary to fully understand the size and scope of SI production in the United States. The experimental statistics described in this article therefore reflect an initial starting point for measuring the economic impact of SI on the U.S. economy. BEA expects to update and improve on these statistics subject to available data and resources. Options for improvement include providing additional industry detail, reorganizing the statistics by activity (such as cloud services and R&D), and providing timelier estimates. Feedback or suggestions about these statistics can be sent to SuperIntelligence@bea.gov.
Bontadini, Filippo, Carol Corrado, Jonathan Haskel, and Cecilia Jona-Lasinio. 2026. “Is Software Eating the World? Measuring the Progress and Diffusion of AI.” Paper presented at the conference AI and Economic Measurement, Spring 2026, Stanford, CA, May 7.
Brandsaas, Eirik Eylands, Daniel Garcia, Robert Kurtzman, Joseph Nichols, and Adelia Zytek. 2025. “Estimating Aggregate Data Center Investment with Project-level Data,” Board of Governors of the Federal Reserve System Finance and Economics Discussion Series working paper no. 2025–109.
Carpinelli, Luisa, Filippo Natoli, and Marco Taboga. 2026. Artificial intelligence and the US economy: an accounting perspective on investment and production. Occasional paper. Rome, Italy: Bank of Italy, March.
Highfill, Tina, David Wasshausen, and Gregory Prunchak. 2025. “Concepts and Challenges of Measuring Production of Artificial Intelligence in the U.S. Economy,” BEA working paper no. WP2025–1.
Juniewicz, Isabel, Daniel Carey, Phil Trammell, and Anson Ho. 2026. The Nvidia-sized hole in US GDP statistics. Report. San Francisco, CA: Epoch AI, August.
Korinek, Anton and Patrick McKelvey. 2026. “Measuring the AI economy,” Peterson Institute for International Economics working paper no. 26–9.
The White House. 2025. Winning the Race: America's AI Action Plan. Washington, DC: The White House.
U.S. Census Bureau. 2026. “Cycle 2 with AI Supplement.” In Business Trends and Outlook Survey. Washington, DC: U.S. Census Bureau.
- The U.S. Bureau of Economic Analysis (BEA) is updating its communications to incorporate the term ”super intelligence,“ pursuant to the September 29, 2026, executive order directing executive branch agencies to replace the term “artificial intelligence” with “super intelligence.”
- For a description of how SI is currently captured within BEA's official statistics, see Highfill, Wasshausen, and Prunchak (2025).
- GDP measures the value of final goods and services produced within the United States. Also known as value added, GDP is the value of goods and services produced by private industry and government less the value of goods and services used up in production.
- Current-dollar (nominal) growth rates do not adjust for inflation and therefore capture changes in both prices and quantities.
- BEA's GDP by industry statistics are categorized using the North American Industry Classification System (NAICS), which groups establishments based on the similarity of their production processes. NAICS organizes economic activity into broad sectors and more detailed subsectors or industries.
- Manufacturing of chips and related components that are intermediate inputs to servers and storage manufacturing is inherently captured in the value of those products. SI chips embedded in final demand products that are not classified as SI products, such as phones and laptops, are considered outside the scope of these experimental statistics. See the supplementary methodology document for more details.
- See BEA's digital economy website for links to several working papers.
Suggested citation
By Tina Highfill, Meghan Scott, and Patrick Georgi, “Experimental Super Intelligence Economic Statistics, 2024,” Survey of Current Business (November 17, 2026), https://doi.org/10.66137/EDYT8838.
