Arts and Cultural Production Satellite Account
New Statistics for 2016
On March 19, 2019, the Bureau of Economic Analysis (BEA) released national and state-level estimates for the Arts and Cultural Production Satellite Account (ACPSA). The new release updated the estimates for 2014 and 2015 and introduced new estimates for 2016.1 This article discusses the newly released 2016 value-added, employment, and compensation statistics in the ACPSA.
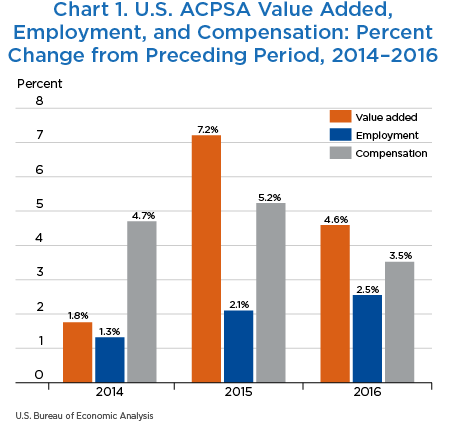
For the nation, value added for the ACPSA industries increased 4.6 percent to $804.2 billion in 2016, following an increase of 7.2 percent in 2015 (chart 1).2 Consequently, ACPSA value added contributed 4.3 percent nationally to current-dollar gross domestic product (GDP) in 2016 (table 1). The ACPSA contribution was larger than many other industries within the U.S. economy, including transportation and warehousing services, which contributed 3.1 percent, and accommodation and food services, which contributed 3.0 percent.
| Geography | Value added | State GDP | Value added as a percent of GDP |
|---|---|---|---|
| United States | 804,197 | 18,707,189 | 4.3 |
| Alabama | 4,642 | 203,398 | 2.3 |
| Alaska | 1,355 | 49,429 | 2.7 |
| Arizona | 9,346 | 311,397 | 3.0 |
| Arkansas | 2,911 | 120,090 | 2.4 |
| California | 185,517 | 2,663,396 | 7.0 |
| Colorado | 14,538 | 329,097 | 4.4 |
| Connecticut | 9,178 | 262,979 | 3.5 |
| Delaware | 1,025 | 70,380 | 1.5 |
| District of Columbia | 10,998 | 129,817 | 8.5 |
| Florida | 35,048 | 938,370 | 3.7 |
| Georgia | 22,075 | 538,238 | 4.1 |
| Hawaii | 2,577 | 85,867 | 3.0 |
| Idaho | 1,942 | 69,313 | 2.8 |
| Illinois | 27,207 | 805,434 | 3.4 |
| Indiana | 8,286 | 338,227 | 2.4 |
| Iowa | 4,009 | 180,351 | 2.2 |
| Kansas | 4,234 | 155,682 | 2.7 |
| Kentucky | 4,950 | 195,080 | 2.5 |
| Louisiana | 6,687 | 228,087 | 2.9 |
| Maine | 1,520 | 59,604 | 2.6 |
| Maryland | 11,135 | 384,156 | 2.9 |
| Massachusetts | 22,215 | 519,741 | 4.3 |
| Michigan | 13,958 | 490,183 | 2.8 |
| Minnesota | 12,064 | 338,638 | 3.6 |
| Mississippi | 2,458 | 106,891 | 2.3 |
| Missouri | 9,900 | 296,070 | 3.3 |
| Montana | 1,518 | 45,550 | 3.3 |
| Nebraska | 2,732 | 116,056 | 2.4 |
| Nevada | 7,019 | 150,436 | 4.7 |
| New Hampshire | 2,499 | 78,402 | 3.2 |
| New Jersey | 21,545 | 581,271 | 3.7 |
| New Mexico | 2,908 | 91,004 | 3.2 |
| New York | 119,857 | 1,541,524 | 7.8 |
| North Carolina | 14,352 | 518,248 | 2.8 |
| North Dakota | 1,437 | 50,772 | 2.8 |
| Ohio | 18,287 | 621,363 | 2.9 |
| Oklahoma | 4,280 | 178,510 | 2.4 |
| Oregon | 7,848 | 215,153 | 3.6 |
| Pennsylvania | 24,041 | 724,266 | 3.3 |
| Rhode Island | 1,931 | 57,727 | 3.3 |
| South Carolina | 5,273 | 212,675 | 2.5 |
| South Dakota | 1,189 | 48,462 | 2.5 |
| Tennessee | 14,182 | 334,385 | 4.2 |
| Texas | 45,114 | 1,564,396 | 2.9 |
| Utah | 6,913 | 157,902 | 4.4 |
| Vermont | 996 | 31,635 | 3.1 |
| Virginia | 16,998 | 493,866 | 3.4 |
| Washington | 41,079 | 492,943 | 8.3 |
| West Virginia | 1,604 | 69,814 | 2.3 |
| Wisconsin | 9,749 | 312,141 | 3.1 |
| Wyoming | 1,071 | 35,905 | 3.0 |
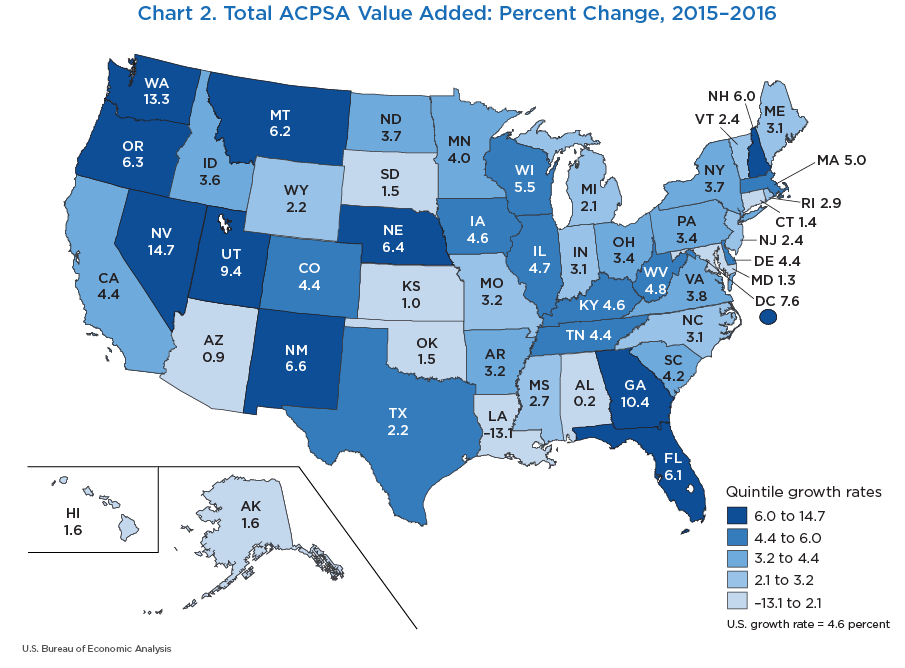
All states except Louisiana experienced growth in value added in 2016. State ACPSA value added ranged from an increase of 14.7 percent in Nevada to a decrease of 13.1 percent in Louisiana (chart 2). State ACPSA value-added contribution to state GDP ranged from 8.5 percent in the District of Columbia to 1.5 percent in Delaware.
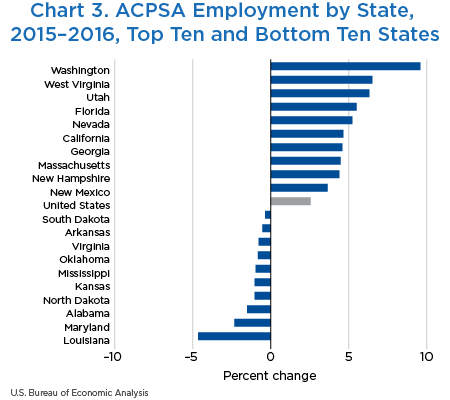
Nationwide, employment in the ACPSA industries grew 2.5 percent in 2016, following an increase of 2.1 percent in 2015 (chart 3). This increase represents a 6-year growth trend in U.S. ACPSA employment. Both the core ACPSA industries and the supporting ACPSA industries contributed to the increase in 2016, growing 2.6 percent and 2.7 percent, respectively.3 ACPSA employment totaled 5.0 million jobs in 2016, with 1.1 million jobs in core ACPSA industries and 3.7 million jobs in supporting ACPSA industries.4 Overall, total ACPSA employment accounted for 3.4 percent of total employment in the United States in 2016. Forty states and the District of Columbia had ACPSA employment growth in 2016. State ACPSA employment ranged from a 9.6 percent increase in Washington to a 4.7 percent decrease in Louisiana.
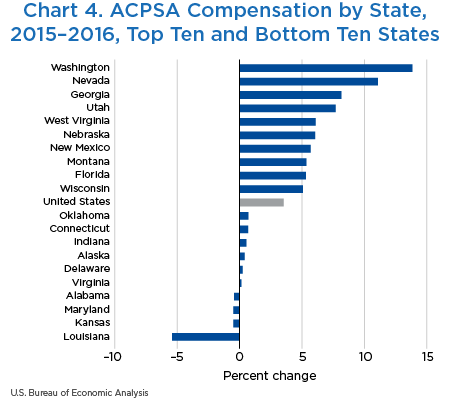
Nationwide, compensation in the ACPSA industries grew 3.5 percent in 2016, following an increase of 5.2 percent in 2015 (chart 4). This increase represents an 8-year growth trend in U.S. ACPSA compensation. Both the core ACPSA industries and the supporting ACPSA industries contributed to the increase in 2016, growing 4.6 percent and 3.3 percent, respectively. ACPSA compensation totaled $386.2 billion in 2016, with $80.6 billion in core ACPSA industries and $291.5 billion in supporting ACPSA industries. Overall, total ACPSA compensation accounted for 3.9 percent of total U.S. compensation in 2016. Forty-six states and the District of Columbia had compensation growth in 2016. State ACPSA compensation ranged from a 13.9 percent increase in Washington to a 5.4 percent decrease in Louisiana.
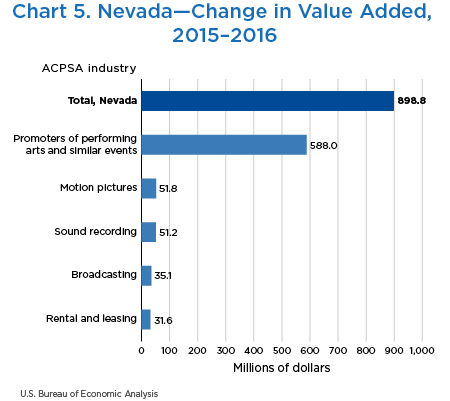
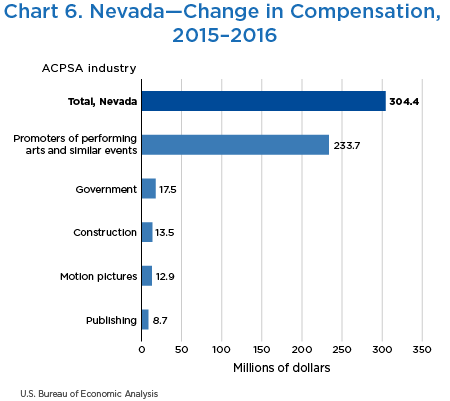
In 2016, Nevada led the nation in ACPSA growth in value added and was also in the top five for ACPSA growth in employment and compensation (table 2). Overall GDP growth in Nevada in 2016 ranked 10th among states at 4.3 percent, and the arts and culture sector contributed to that growth. Growth in ACPSA value added and compensation in Nevada were led by strong growth in promoters of performing arts and similar events (charts 5 and 6). In both cases, promoters of performing arts and similar events contributed over half of total growth in value added and compensation. The industry includes establishments primarily engaged in organizing, promoting, and/or managing live performing arts productions and similar events, such as state fairs, county fairs, agricultural fairs, concerts, and festivals. Theatrical (except motion pictures) booking agencies are also included in this industry.
| Geography | Value added growth | Value added rank | Employment growth | Employment rank | Compensation growth | Compensation rank |
|---|---|---|---|---|---|---|
| United States | 4.6 | ..... | 2.5 | ..... | 3.5 | ..... |
| Nevada | 14.7 | 1st | 5.2 | 5th | 11.1 | 2nd |
| Washington | 13.3 | 2nd | 9.6 | 1st | 13.9 | 1st |
| Georgia | 10.4 | 3rd | 4.6 | 7th | 8.2 | 3rd |
| Utah | 9.4 | 4th | 6.3 | 3rd | 7.7 | 4th |
| Louisiana | −13.1 | 50th | −4.7 | 50th | −5.4 | 50th |
Nevada, in particular Las Vegas, is a major tourist destination, attracting people not only for its casinos but also for its major musical and theatrical shows. According to the Las Vegas Convention and Visitors Authority, 2016 was the year with highest visitor volume, with approximately 42.9 million visitors.5 With several big-name artists in residence holding performances along with many top-class comedy, acrobatic, magic, and production shows, 2016 was a strong year for the promoters of performing arts and similar events industry in Nevada.
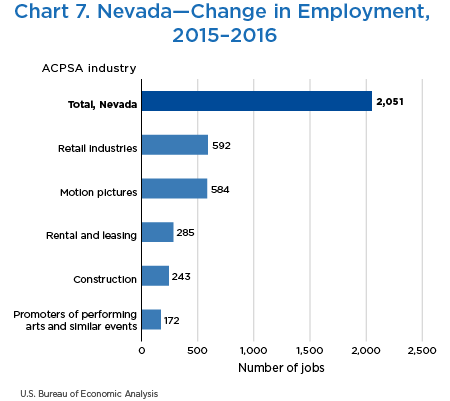
In contrast, ACPSA employment growth in Nevada was led by four supporting arts industries: retail industries, motion pictures, rental and leasing, and construction (chart 7). Employment in the promoters of performing arts and similar events industry represents only a small portion of overall ACPSA employment in Nevada, 3.0 percent. Retail industries and motion pictures represent 21.3 percent and 8.9 percent of overall ACPSA employment, respectively. In 2016, arts and culture in Nevada experienced increases almost across the board in all ACPSA industries.
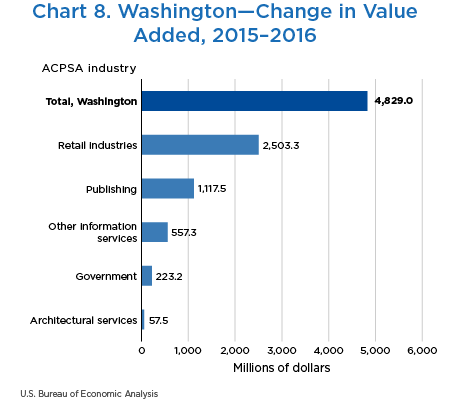
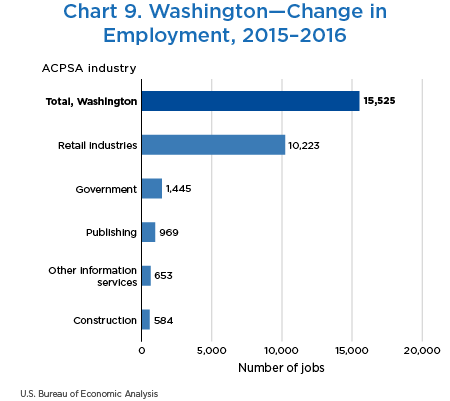
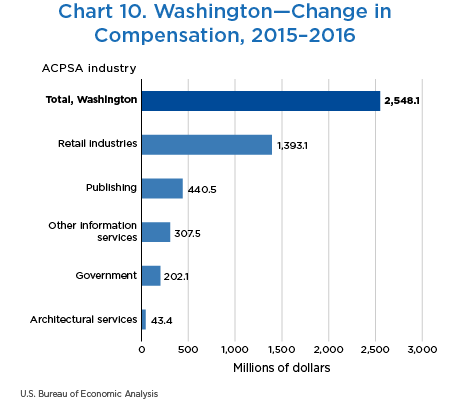
In 2016, Washington state had the second largest value-added growth rate, increasing 13.3 percent, and led the nation in ACPSA employment and compensation growth. Overall GDP growth in Washington ranked fifth, tied with Arizona, at 4.8 percent. Growth in ACPSA value added, employment, and compensation were led by strong growth in the retail industries (charts 8, 9, and 10). Washington’s retail industries, which include several online retailers, continued to be one of the largest drivers in its economy. The industry facilitates the dissemination of ACPSA products like photographic supplies, books, and records. According to the Washington Department of Revenue, taxable retail sales hit a record $145.9 billion in 2016–a 7.8 percent increase over 2015.6
In 2016, Washington’s ACPSA employment increased 9.6 percent, and ACPSA compensation increased 13.9 percent. The primary contributor to Washington’s overall ACPSA employment and compensation growth was retail industries, which added 65.8 percent of the overall change in employment and 54.7 percent of the overall change in compensation.
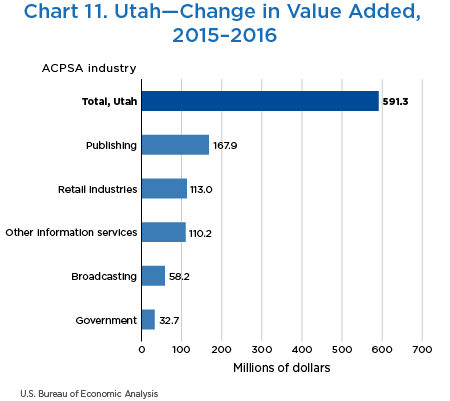
Utah was another state among the fastest growing in value added, coming in fourth and increasing 9.4 percent in 2016. In comparison, Utah’s overall state GDP growth ranked second for all states in 2016, increasing 5.6 percent. Unlike other states with a primary contributing industry, growth in Utah was attributed to multiple industries within the ACPSA (chart 11). Key industries to Utah’s growth were publishing, retail industries, and other information services. The state’s diversified economy allowed it to thrive on many fronts.
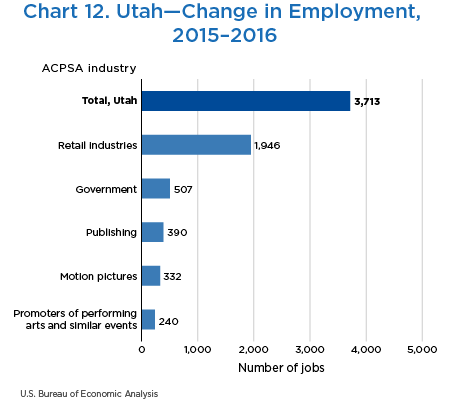
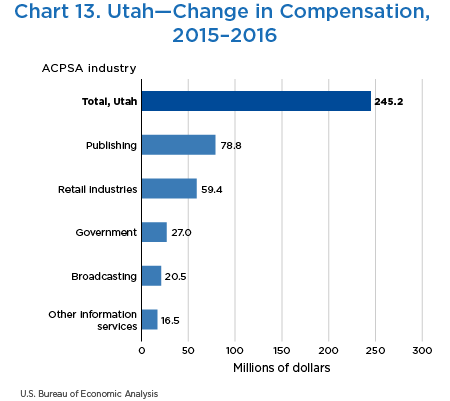
The retail and publishing industries were also among the main contributors to growth in both compensation and employment. Utah’s compensation increased by $245.2 million, and employment increased by 3,713 jobs in 2016 (charts 12 and 13). The retail industry contributed the most to the employment increase, with the government industries following. In compensation, the primary contributors to growth were publishing, which includes books as well as online publishing, and the retail industries. Many of the industries that contributed to the growth in Utah help support the vibrant artistic community in the state. Utah is home to several large arts and culture festivals, including the Sundance Film Festival, Moab Music Festival, Utah Arts Festival, and Utah Shakespeare Festival.7 According to a study conducted by the University of Utah Kem C. Gardner Policy Institute, the 2016 Sundance Film Festival generated $143.3 million of economic activity, supported 1,440 jobs, and contributed $72.5 million to Utah’s GDP.8
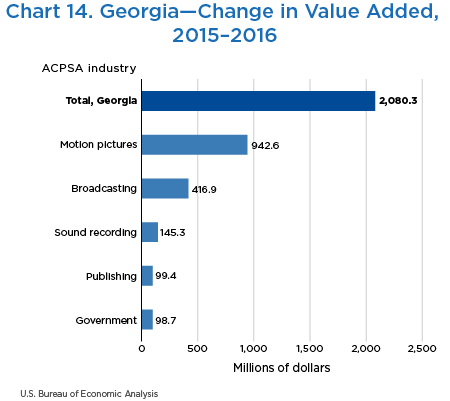
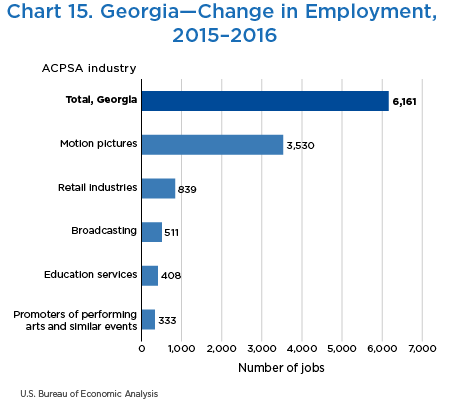
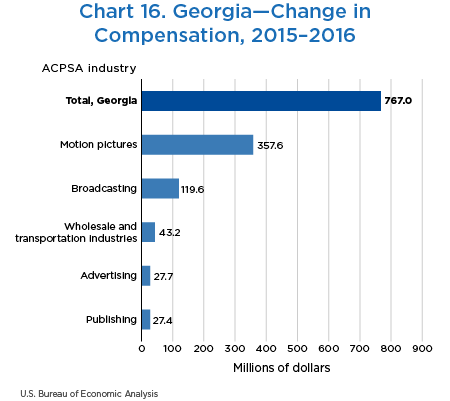
Georgia had the third-largest value-added growth rate in 2016, increasing 10.4 percent, and the third-largest growth rate in overall state GDP, 5.0 percent. Georgia’s ACPSA value added represented 4.1 percent of the state’s GDP, slightly below the national average of 4.3 percent. Georgia was also among the fastest growing states in employment and compensation, ranking seventh and third, respectively. The motion pictures industry was the leading contributor to the growth in all three statistical categories (charts 14, 15, and 16).
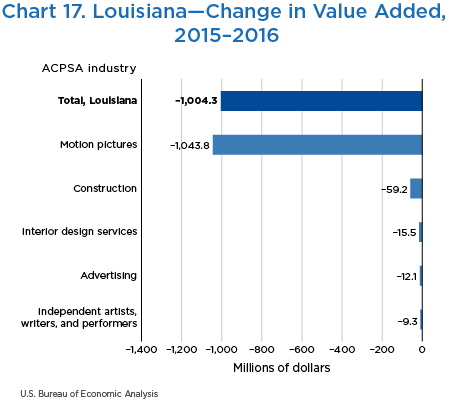
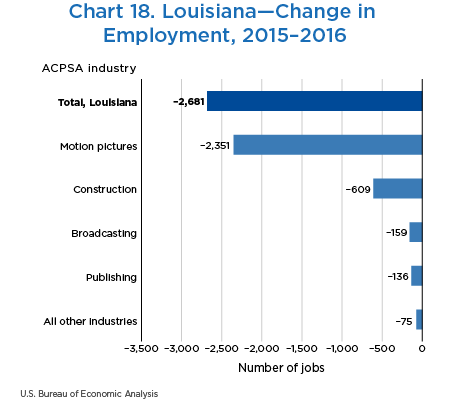
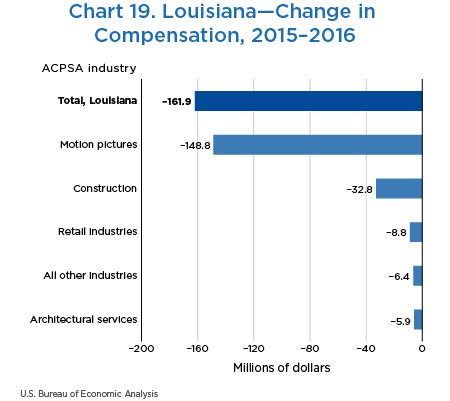
While the motion pictures industry was the leading contributor to ACPSA growth in Georgia, it served as the leading contributor to a decrease in Louisiana. Louisiana had the largest decrease in all three ACPSA statistics in 2016 (charts 17, 18, and 19). Value added declined 13.1 percent, employment declined 4.7 percent, and compensation declined 5.4 percent.
In 2015, Louisiana passed legislation capping the amount the state could spend on film tax credits at $180 million per year for 3 years.9 Critics of the legislation blamed the cap for the decline in film and television production within Louisiana and believed many of the producers moved to Georgia, where the state offered up to a 30 percent tax incentive without caps.10
- The updated statistics for 2014 and 2015 incorporated updated input-output tables from the Industry Economic Accounts at the national level, updated employment and wage data from the Quarterly Census of Employment and Wages, and updated data from various other sources.
- Value added measures an industry’s contribution to GDP.
- The core ACPSA industry category includes the commodities in which output is identified as primarily contributing to arts and culture; it includes performing arts, museums, design services, and arts education. The supporting ACPSA industry category consists of the commodities that support the core category through publication, dissemination of the creative process, or other supportive functions; for example, it includes event promotion, printing, and broadcasting.
- Total arts and cultural production industries includes core industries, supporting industries, and industries with secondary production that are designated as artistic and cultural.
- See Las Vegas Historic Tourism Statistics.
- See the news release on the Washington Department of Revenue website.
- See the report, “Utah ranks 3rd in the nation with most growth in arts and culture,” on the KSL Broadcasting website.
- See the news release on the Sundance Institute website.
- Tyler Bridges, “Major downturn plagues Louisiana's film, TV industry 'Hollywood South' after big changes to tax credit program,” The Advocate (April 3, 2016).
- For details on the incentive, see the Georgia Department of Economic Development website.
