
GDP and the Economy
Second Estimates for the First Quarter of 2019
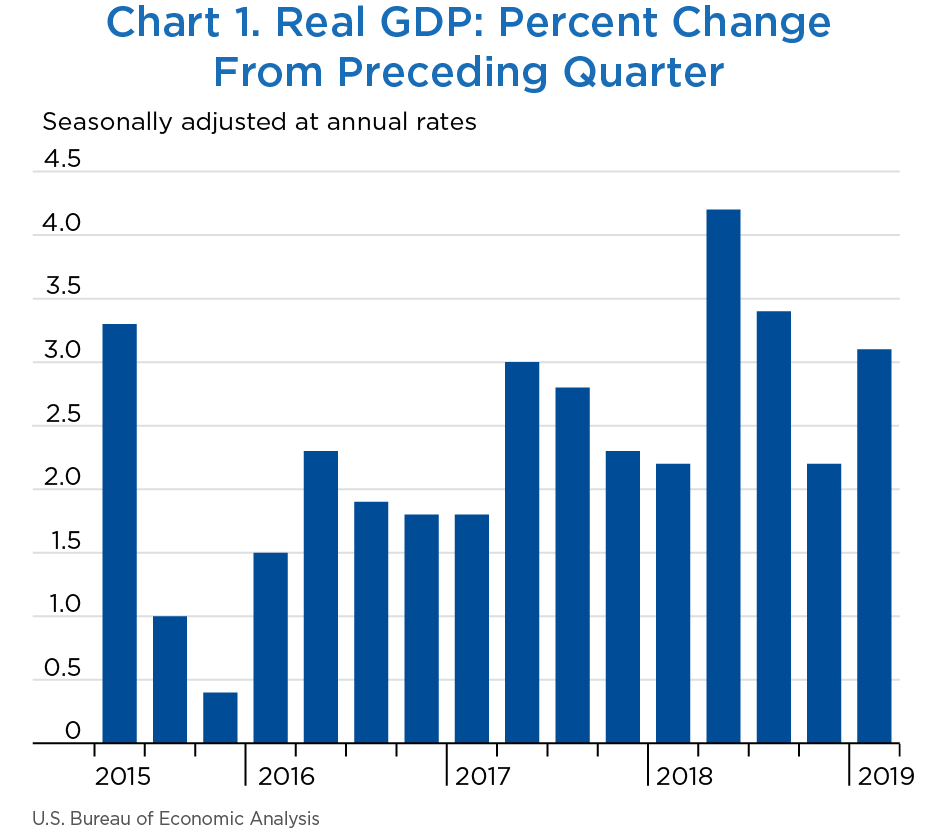
Real gross domestic product (GDP) increased at an annual rate of 3.1 percent in the first quarter of 2019, according to the second estimates of the National Income and Product Accounts (NIPAs) (chart 1 and table 1).1 With the second estimate, real GDP growth for the first quarter was revised down 0.1 percentage point from the advance estimate issued last month (see “Updates”). In the fourth quarter of 2018, real GDP increased 2.2 percent.
The increase in real GDP in the first quarter reflected positive contributions from consumer spending, inventory investment, exports, state and local government spending, and nonresidential fixed investment that were partly offset by a negative contribution from residential fixed investment.2 Imports, which are a subtraction in the calculation of GDP, decreased (chart 2 and table 1).
[Click chart to expand]

[Click chart to expand]
The acceleration in real GDP in the first quarter reflected an upturn in state and local government spending (line 26), accelerations in inventory investment (line 14) and in exports (line 16), and a smaller decrease in residential investment (line 13). These movements were partly offset by decelerations in consumer spending (line 2) and nonresidential fixed investment (line 9) and a downturn in federal government spending (line 23). Imports turned down (line 19).
- The upturn in state and local government spending primarily reflected an upturn in gross investment in structures.
- The acceleration in inventory investment primarily reflected an upturn in manufacturing inventory investment, for both durable and nondurable-goods industries.
- The acceleration in exports primarily reflected upturns in foods, feeds, and beverages and in automotive vehicles, engines, and parts. These movements were partly offset by downturns in industrial supplies and materials and in nonautomotive capital goods.
- The smaller decrease in residential investment primarily reflected an upturn in brokers' commissions and other ownership transfer costs, following four consecutive quarters of decline.
- The deceleration in consumer spending primarily reflected a downturn in goods, mainly for spending on new motor vehicles (most notably, new light-truck purchases). Spending on services decelerated, primarily reflecting a downturn in spending by nonprofit institutions serving households (most notably, professional advocacy and hospitals) that was partly offset by an acceleration in spending for health care.
- The downturn in federal government spending reflected a downturn in gross investment for defense equipment (mainly aircraft).
- The downturn in imports reflected a downturn in goods and a deceleration in services. Within goods imports, the downturn was widespread; the leading contributors were motor vehicles and consumer goods (nonfood, nonautomotive). Within services imports, travel services decelerated and transport services turned down.
Real gross domestic income (line 27) increased 1.4 percent in the first quarter after increasing 0.5 percent in the fourth quarter (revised).
| Line | Share of current-dollar GDP (percent) | Change from preceding period (percent) | Contribution to percent change in real GDP (percentage points) | |||||||
|---|---|---|---|---|---|---|---|---|---|---|
| 2019 | 2018 | 2019 | 2018 | 2019 | ||||||
| I | II | III | IV | I | II | III | IV | I | ||
| 1 | Gross domestic product1 | 100.0 | 4.2 | 3.4 | 2.2 | 3.1 | 4.2 | 3.4 | 2.2 | 3.1 |
| 2 | Personal consumption expenditures | 67.7 | 3.8 | 3.5 | 2.5 | 1.3 | 2.57 | 2.37 | 1.66 | 0.90 |
| 3 | Goods | 20.7 | 5.5 | 4.3 | 2.6 | −0.3 | 1.16 | 0.90 | 0.54 | −0.06 |
| 4 | Durable goods | 6.9 | 8.6 | 3.7 | 3.6 | −4.6 | 0.60 | 0.26 | 0.25 | −0.33 |
| 5 | Nondurable goods | 13.8 | 4.0 | 4.6 | 2.1 | 2.0 | 0.56 | 0.64 | 0.29 | 0.27 |
| 6 | Services | 47.0 | 3.0 | 3.2 | 2.4 | 2.1 | 1.42 | 1.47 | 1.12 | 0.96 |
| 7 | Gross private domestic investment | 18.1 | −0.5 | 15.2 | 3.7 | 4.3 | −0.07 | 2.53 | 0.66 | 0.78 |
| 8 | Fixed investment | 17.5 | 6.4 | 1.1 | 3.1 | 1.0 | 1.10 | 0.21 | 0.54 | 0.18 |
| 9 | Nonresidential | 13.7 | 8.7 | 2.5 | 5.4 | 2.3 | 1.15 | 0.35 | 0.73 | 0.31 |
| 10 | Structures | 3.1 | 14.5 | −3.4 | −3.9 | 1.7 | 0.43 | −0.11 | −0.12 | 0.05 |
| 11 | Equipment | 6.0 | 4.6 | 3.4 | 6.6 | −1.0 | 0.27 | 0.21 | 0.39 | −0.06 |
| 12 | Intellectual property products | 4.6 | 10.5 | 5.6 | 10.7 | 7.2 | 0.45 | 0.25 | 0.46 | 0.32 |
| 13 | Residential | 3.8 | −1.3 | −3.6 | −4.7 | −3.5 | −0.05 | −0.14 | −0.18 | −0.13 |
| 14 | Change in private inventories | 0.6 | ...... | ...... | ...... | ...... | −1.17 | 2.33 | 0.11 | 0.60 |
| 15 | Net exports of goods and services | −2.9 | ...... | ...... | ...... | ...... | 1.22 | −1.99 | −0.08 | 0.96 |
| 16 | Exports | 12.1 | 9.3 | −4.9 | 1.8 | 4.8 | 1.12 | −0.62 | 0.22 | 0.58 |
| 17 | Goods | 7.9 | 13.5 | −8.4 | 1.2 | 6.3 | 1.06 | −0.72 | 0.10 | 0.49 |
| 18 | Services | 4.2 | 1.5 | 2.4 | 2.7 | 2.0 | 0.07 | 0.10 | 0.11 | 0.08 |
| 19 | Imports | 15.0 | −0.6 | 9.3 | 2.0 | −2.5 | 0.10 | −1.37 | −0.30 | 0.39 |
| 20 | Goods | 12.1 | −0.4 | 10.5 | 0.5 | −3.1 | 0.06 | −1.24 | −0.06 | 0.39 |
| 21 | Services | 2.9 | −1.4 | 4.3 | 8.6 | 0.3 | 0.04 | −0.12 | −0.24 | −0.01 |
| 22 | Government consumption expenditures and gross investment | 17.1 | 2.5 | 2.6 | −0.4 | 2.5 | 0.43 | 0.44 | −0.07 | 0.42 |
| 23 | Federal | 6.4 | 3.7 | 3.5 | 1.1 | −0.1 | 0.24 | 0.23 | 0.07 | 0.00 |
| 24 | National defense | 3.8 | 5.9 | 4.9 | 6.4 | 4.0 | 0.22 | 0.18 | 0.24 | 0.15 |
| 25 | Nondefense | 2.6 | 0.5 | 1.6 | −6.1 | −5.9 | 0.01 | 0.04 | −0.16 | −0.16 |
| 26 | State and local | 10.7 | 1.8 | 2.0 | −1.3 | 4.0 | 0.20 | 0.22 | −0.14 | 0.42 |
| Addenda: | ||||||||||
| 27 | Gross domestic income (GDI)2 | ...... | 0.9 | 4.6 | 0.5 | 1.4 | ...... | ...... | ...... | ...... |
| 28 | Average of GDP and GDI | ...... | 2.5 | 4.0 | 1.3 | 2.2 | ...... | ...... | ...... | ...... |
| 29 | Final sales of domestic product | 99.4 | 5.4 | 1.0 | 2.1 | 2.5 | 5.33 | 1.03 | 2.05 | 2.47 |
| 30 | Goods | 29.6 | 6.5 | 6.1 | 5.7 | 6.0 | 1.91 | 1.77 | 1.66 | 1.74 |
| 31 | Services | 62.0 | 2.9 | 2.8 | 1.6 | 1.7 | 1.78 | 1.76 | 0.99 | 1.06 |
| 32 | Structures | 8.4 | 5.5 | −2.0 | −5.5 | 3.1 | 0.47 | −0.17 | −0.48 | 0.26 |
| 33 | Motor vehicle output | 2.7 | −5.8 | 9.6 | 3.3 | −8.3 | −0.17 | 0.25 | 0.09 | −0.24 |
| 34 | GDP excluding motor vehicle output | 97.3 | 4.5 | 3.2 | 2.1 | 3.4 | 4.33 | 3.10 | 2.08 | 3.31 |
- The GDP estimates under the contribution columns are also percent changes.
- GDI is deflated by the implicit price deflator for GDP. The fourth-quarter 2018 change in GDI reflects the incorporation of newly available wage and salary estimates.
Prices for gross domestic purchases, goods and services purchased by U.S. residents, increased 0.7 percent in the first quarter after increasing 1.7 percent in the fourth quarter (table 2, line 1, and chart 3). The deceleration primarily reflected a deceleration in prices paid for consumer services (led by a downturn in financial services and insurance). Food prices accelerated (line 20), increasing 3.1 percent after increasing 0.2 percent. Energy goods and services decreased 16.8 percent in the first quarter after decreasing 1.6 percent in the fourth quarter (line 21). Gross domestic purchases prices excluding food and energy (line 22) decelerated, increasing 1.2 percent in the first quarter after increasing 1.8 percent in the fourth quarter.

[Click chart to expand]
Consumer prices excluding food and energy (line 25), a measure of the “core” rate of inflation, decelerated, increasing 1.0 percent in the first quarter after increasing 1.8 percent in the fourth quarter.
| Line | Change from preceding period (percent) | Contribution to percent change in gross domestic purchases prices (percentage points) | |||||||
|---|---|---|---|---|---|---|---|---|---|
| 2018 | 2019 | 2018 | 2019 | ||||||
| II | III | IV | I | II | III | IV | I | ||
| 1 | Gross domestic purchases1 | 2.4 | 1.8 | 1.7 | 0.7 | 2.4 | 1.8 | 1.7 | 0.7 |
| 2 | Personal consumption expenditures | 2.0 | 1.6 | 1.5 | 0.4 | 1.32 | 1.04 | 0.98 | 0.25 |
| 3 | Goods | 0.4 | −0.4 | −1.1 | −1.7 | 0.08 | −0.07 | −0.23 | −0.36 |
| 4 | Durable goods | −1.6 | −0.9 | −1.5 | −0.5 | −0.11 | −0.06 | −0.10 | −0.04 |
| 5 | Nondurable goods | 1.4 | 0.0 | −1.0 | −2.4 | 0.19 | −0.01 | −0.13 | −0.32 |
| 6 | Services | 2.7 | 2.5 | 2.7 | 1.3 | 1.24 | 1.11 | 1.22 | 0.61 |
| 7 | Gross private domestic investment | 3.1 | 2.0 | 1.4 | 1.6 | 0.53 | 0.35 | 0.25 | 0.28 |
| 8 | Fixed investment | 3.2 | 2.0 | 1.4 | 1.7 | 0.53 | 0.34 | 0.24 | 0.28 |
| 9 | Nonresidential | 2.0 | 1.6 | 1.1 | 1.5 | 0.26 | 0.21 | 0.14 | 0.19 |
| 10 | Structures | 5.1 | 3.1 | 5.8 | 2.8 | 0.15 | 0.09 | 0.17 | 0.08 |
| 11 | Equipment | 0.8 | 1.2 | −0.7 | 0.8 | 0.05 | 0.07 | −0.04 | 0.05 |
| 12 | Intellectual property products | 1.4 | 1.0 | 0.3 | 1.5 | 0.06 | 0.04 | 0.01 | 0.07 |
| 13 | Residential | 7.3 | 3.6 | 2.6 | 2.5 | 0.27 | 0.13 | 0.10 | 0.09 |
| 14 | Change in private inventories | ...... | ...... | ...... | ...... | −0.01 | 0.01 | 0.01 | −0.01 |
| 15 | Government consumption expenditures and gross investment | 3.3 | 2.5 | 2.6 | 1.1 | 0.55 | 0.41 | 0.42 | 0.18 |
| 16 | Federal | 2.0 | 1.5 | 2.7 | 4.1 | 0.13 | 0.10 | 0.16 | 0.25 |
| 17 | National defense | 1.3 | 1.2 | 1.6 | 0.8 | 0.05 | 0.04 | 0.06 | 0.03 |
| 18 | Nondefense | 3.0 | 2.0 | 4.2 | 9.2 | 0.08 | 0.05 | 0.10 | 0.22 |
| 19 | State and local | 4.1 | 3.0 | 2.5 | −0.7 | 0.42 | 0.32 | 0.26 | −0.08 |
| Addenda: | |||||||||
| Gross domestic purchases: | |||||||||
| 20 | Food | 1.1 | 0.5 | 0.2 | 3.1 | 0.05 | 0.03 | 0.01 | 0.14 |
| 21 | Energy goods and services | 0.4 | 3.3 | −1.6 | −16.8 | 0.01 | 0.09 | −0.04 | −0.50 |
| 22 | Excluding food and energy | 2.5 | 1.8 | 1.8 | 1.2 | 2.33 | 1.68 | 1.68 | 1.06 |
| Personal consumption expenditures: | |||||||||
| 23 | Food and beverages purchased for off-premises consumption | 1.2 | 0.4 | 0.3 | 3.0 | ...... | ...... | ...... | ...... |
| 24 | Energy goods and services | 0.7 | 3.3 | −2.0 | −16.8 | ...... | ...... | ...... | ...... |
| 25 | Excluding food and energy | 2.1 | 1.6 | 1.8 | 1.0 | ...... | ...... | ...... | ...... |
| 26 | Gross domestic product | 3.0 | 1.8 | 1.7 | 0.8 | ...... | ...... | ...... | ...... |
| 27 | Exports of goods and services | 5.8 | 0.3 | −1.4 | −3.5 | ...... | ...... | ...... | ...... |
| 28 | Imports of goods and services | 0.8 | 0.4 | −1.0 | −3.0 | ...... | ...... | ...... | ...... |
- The estimates for gross domestic purchases under the contribution columns are also percent changes.
Personal income (table 3, line 1), which is measured in current dollars, increased $143.7 billion in the first quarter after increasing $177.8 billion in the fourth quarter (revised). The deceleration reflected downturns in personal interest income (line 17), personal dividend income (line 18), and farm proprietors’ income (line 13) that were partly offset by an acceleration in government social benefits to persons (line 20).
- Personal current taxes (line 29) increased $42.0 billion in the first quarter after decreasing $4.0 billion in the fourth quarter.
- Disposable personal income (DPI) (line 30 and chart 4) increased $101.7 billion in the first quarter after increasing $181.7 billion in the fourth quarter.
- The personal saving rate (line 33 and chart 5)—personal saving as a percentage of DPI—was 6.7 percent in the first quarter; in the fourth quarter, the personal saving rate was 6.5 percent.
- Real DPI (line 35) increased 2.2 percent in the first quarter after increasing 3.2 percent in the fourth quarter. Current-dollar DPI (line 34) increased 2.6 percent after increasing 4.7 percent. The differences in the movements in real DPI and current-dollar DPI reflected a deceleration in the implicit price deflator for consumer spending, which is used to deflate DPI.
With the release of the second estimate of GDP, the Bureau of Economic Analysis also released revised estimates of fourth-quarter wages and salaries, personal taxes, and contributions for government social insurance. These estimates reflect new wage and salary tabulations for the fourth quarter from the Bureau of Labor Statistics Quarterly Census of Employment and Wages program. As a result:
- Wages and salaries (line 3) is now estimated to have increased $45.3 billion in the fourth quarter, a downward revision of $54.7 billion.
- Personal income (line 1) is now estimated to have increased $177.8 billion, a downward revision of $51.3 billion.
- Real DPI is now estimated to have increased 3.2 percent (line 35) in the fourth quarter; in the advance estimate, real DPI increased 4.3 percent.
- The personal saving rate (line 33) is now estimated at 6.5 percent, a downward revision of 0.3 percentage points.
- The percent change in real gross domestic income (table 1, line 27) is now estimated at 0.5 percent, 1.2 percentage points lower than previously estimated.
| Line | Level | Change from preceding period | |||||
|---|---|---|---|---|---|---|---|
| 2018 | 2019 | 2018 | 2019 | ||||
| IV | I | II | III | IV | I | ||
| 1 | Personal income | 17,835.0 | 17,978.7 | 147.6 | 190.6 | 177.8 | 143.7 |
| 2 | Compensation of employees | 10,964.4 | 11,067.0 | 72.8 | 125.0 | 56.5 | 102.6 |
| 3 | Wages and salaries | 8,924.5 | 9,011.2 | 60.2 | 108.4 | 45.3 | 86.7 |
| 4 | Private industries | 7,530.0 | 7,607.0 | 52.0 | 94.0 | 36.5 | 76.9 |
| 5 | Goods-producing industries | 1,478.4 | 1,488.7 | −3.1 | 19.0 | 10.2 | 10.3 |
| 6 | Manufacturing | 887.3 | 890.6 | −7.1 | 9.8 | 6.6 | 3.3 |
| 7 | Services-producing industries | 6,051.6 | 6,118.3 | 55.1 | 75.0 | 26.2 | 66.6 |
| 8 | Trade, transportation, and utilities | 1,372.0 | 1,388.2 | 6.8 | 14.1 | 6.3 | 16.3 |
| 9 | Other services-producing industries | 4,679.7 | 4,730.0 | 48.3 | 60.9 | 19.9 | 50.4 |
| 10 | Government | 1,394.4 | 1,404.2 | 8.1 | 14.4 | 8.8 | 9.8 |
| 11 | Supplements to wages and salaries | 2,040.0 | 2,055.8 | 12.6 | 16.6 | 11.3 | 15.9 |
| 12 | Proprietors' income with IVA and CCAdj | 1,616.7 | 1,606.1 | 18.6 | 11.5 | 36.7 | −10.6 |
| 13 | Farm | 47.9 | 35.5 | 1.8 | −9.1 | 19.9 | −12.3 |
| 14 | Nonfarm | 1,568.9 | 1,570.6 | 16.8 | 20.6 | 16.8 | 1.7 |
| 15 | Rental income of persons with CCAdj | 768.6 | 783.2 | 5.0 | 13.2 | 1.2 | 14.6 |
| 16 | Personal income receipts on assets | 2,833.4 | 2,779.8 | 28.3 | 24.4 | 61.3 | −53.6 |
| 17 | Personal interest income | 1,645.6 | 1,612.6 | 8.9 | 9.7 | 29.4 | −33.0 |
| 18 | Personal dividend income | 1,187.9 | 1,167.2 | 19.3 | 14.7 | 31.9 | −20.7 |
| 19 | Personal current transfer receipts | 3,025.8 | 3,136.7 | 31.9 | 31.4 | 28.6 | 110.9 |
| 20 | Government social benefits to persons | 2,963.2 | 3,073.7 | 29.7 | 30.2 | 27.6 | 110.5 |
| 21 | Social security | 989.0 | 1,022.7 | 8.2 | 8.7 | 11.3 | 33.7 |
| 22 | Medicare | 759.5 | 782.5 | 10.8 | 15.4 | 19.6 | 23.0 |
| 23 | Medicaid | 604.6 | 615.4 | 12.3 | 5.2 | −3.2 | 10.9 |
| 24 | Unemployment insurance | 24.1 | 25.2 | −2.0 | −0.8 | −0.6 | 1.0 |
| 25 | Veterans' benefits | 113.1 | 116.2 | 2.4 | 3.0 | 2.1 | 3.1 |
| 26 | Other | 472.9 | 511.7 | −2.0 | −1.3 | −1.6 | 38.8 |
| 27 | Other current transfer receipts, from business (net) | 62.6 | 63.0 | 2.2 | 1.2 | 1.0 | 0.4 |
| 28 | Less: Contributions for government social insurance | 1,373.9 | 1,394.1 | 8.9 | 14.9 | 6.6 | 20.1 |
| 29 | Less: Personal current taxes | 2,060.9 | 2,102.9 | 5.3 | 29.6 | −4.0 | 42.0 |
| 30 | Equals: Disposable personal income (DPI) | 15,774.1 | 15,875.8 | 142.3 | 160.9 | 181.7 | 101.7 |
| 31 | Less: Personal outlays | 14,744.1 | 14,819.2 | 208.9 | 192.6 | 147.7 | 75.1 |
| 32 | Equals: Personal saving | 1,030.1 | 1,056.6 | −66.7 | −31.6 | 34.0 | 26.6 |
| 33 | Personal saving as a percentage of DPI | 6.5 | 6.7 | ...... | ...... | ...... | ...... |
| Addenda: | |||||||
| Percent change at annual rate | |||||||
| 34 | Current-dollar DPI | ...... | ...... | 3.8 | 4.2 | 4.7 | 2.6 |
| 35 | Real DPI, chained (2012) dollars | ...... | ...... | 1.8 | 2.6 | 3.2 | 2.2 |
- CCAdj
- Capital consumption adjustment
- IVA
- Inventory valuation adjustment

[Click chart to expand]

[Click chart to expand]
Real GDP increased 3.1 percent in the first quarter of 2019, a downward revision of 0.1 percentage point from the advance estimate (table 4, line 1). The revision primarily reflected downward revisions to nonresidential fixed investment (line 9) and inventory investment (line 14) and an upward revision to imports (line 19) that were mostly offset by upward revisions to exports (line 16) and to consumer spending on goods (line 3).
- Within nonresidential fixed investment, downward revisions to investment in equipment (most notably industrial equipment) and intellectual property products (primarily software) were partly offset by an upward revision to structures.
- The downward revision to inventory investment reflected downward revisions in retail and wholesale trade industries that were partly offset by an upward revision to inventory investment in manufacturing industries.
- The revisions to exports and imports were primarily to goods. For exports, the upward revision was widespread. For imports, upward revisions to motor vehicles and foods, feeds, and beverages were partly offset by a downward revision to petroleum.
- Within consumer spending, the upward revision was to goods, specifically, motor vehicles and parts.
| Line | Change from preceding period (percent) | Contribution to percent change in real gross domestic product (percentage points) | |||||
|---|---|---|---|---|---|---|---|
| Advance estimate | Second estimate | Second estimate minus advance estimate | Advance estimate | Second estimate | Second estimate minus advance estimate | ||
| 1 | Gross domestic product (GDP)1 | 3.2 | 3.1 | −0.1 | 3.2 | 3.1 | −0.1 |
| 2 | Personal consumption expenditures | 1.2 | 1.3 | 0.1 | 0.82 | 0.90 | 0.08 |
| 3 | Goods | −0.7 | −0.3 | 0.4 | −0.14 | −0.06 | 0.08 |
| 4 | Durable goods | −5.3 | −4.6 | 0.7 | −0.38 | −0.33 | 0.05 |
| 5 | Nondurable goods | 1.7 | 2.0 | 0.3 | 0.24 | 0.27 | 0.03 |
| 6 | Services | 2.0 | 2.1 | 0.1 | 0.96 | 0.96 | 0.00 |
| 7 | Gross private domestic investment | 5.1 | 4.3 | −0.8 | 0.92 | 0.78 | −0.14 |
| 8 | Fixed investment | 1.5 | 1.0 | −0.5 | 0.27 | 0.18 | −0.09 |
| 9 | Nonresidential | 2.7 | 2.3 | −0.4 | 0.38 | 0.31 | −0.07 |
| 10 | Structures | −0.8 | 1.7 | 2.5 | −0.02 | 0.05 | 0.07 |
| 11 | Equipment | 0.2 | −1.0 | −1.2 | 0.01 | −0.06 | −0.07 |
| 12 | Intellectual property products | 8.6 | 7.2 | −1.4 | 0.39 | 0.32 | −0.07 |
| 13 | Residential | −2.8 | −3.5 | −0.7 | −0.11 | −0.13 | −0.02 |
| 14 | Change in private inventories | ...... | ...... | ...... | 0.65 | 0.60 | −0.05 |
| 15 | Net exports of goods and services | ...... | ...... | ...... | 1.03 | 0.96 | −0.07 |
| 16 | Exports | 3.7 | 4.8 | 1.1 | 0.45 | 0.58 | 0.13 |
| 17 | Goods | 4.7 | 6.3 | 1.6 | 0.37 | 0.49 | 0.12 |
| 18 | Services | 1.8 | 2.0 | 0.2 | 0.08 | 0.08 | 0.00 |
| 19 | Imports | −3.7 | −2.5 | 1.2 | 0.58 | 0.39 | −0.19 |
| 20 | Goods | −4.4 | −3.1 | 1.3 | 0.56 | 0.39 | −0.17 |
| 21 | Services | −0.8 | 0.3 | 1.1 | 0.02 | −0.01 | −0.03 |
| 22 | Government consumption expenditures and gross investment | 2.4 | 2.5 | 0.1 | 0.41 | 0.42 | 0.01 |
| 23 | Federal | 0.0 | −0.1 | −0.1 | 0.00 | 0.00 | 0.00 |
| 24 | National defense | 4.1 | 4.0 | −0.1 | 0.16 | 0.15 | −0.01 |
| 25 | Nondefense | −5.9 | −5.9 | 0.0 | −0.16 | −0.16 | 0.00 |
| 26 | State and local | 3.9 | 4.0 | 0.1 | 0.41 | 0.42 | 0.01 |
| Addenda: | |||||||
| 27 | Final sales of domestic product | 2.5 | 2.5 | 0.0 | 2.53 | 2.47 | −0.06 |
| 28 | Gross domestic purchases price index | 0.8 | 0.7 | −0.1 | ...... | ...... | ...... |
| 29 | GDP price index | 0.9 | 0.8 | −0.1 | ...... | ...... | ...... |
- The GDP estimates under the contribution columns are also percent changes.
Measured in current dollars, profits from current production (corporate profits with the inventory valuation (IVA) adjustment and the capital consumption adjustment (CCAdj)) decreased $65.4 billion, or 2.8 percent at a quarterly rate, in the first quarter of 2019 after decreasing $9.7 billion, or 0.4 percent, in the fourth quarter of 2018 (table 5, line 2). Profits of domestic financial corporations increased $7.4 billion (line 4), profits of domestic nonfinancial corporations decreased $62.1 billion (line 5), and rest-of-the-world profits decreased $10.7 billion (line 6).
Profits after tax (without the IVA and the CCAdj) decreased $16.0 billion in the first quarter, after decreasing $34.2 billion in the fourth quarter (line 20).
| Line | Billions of dollars (annual rate) | Percent change from preceding quarter (quarterly rate) | ||||||||
|---|---|---|---|---|---|---|---|---|---|---|
| Level | Change from preceding quarter | |||||||||
| 2019 | 2018 | 2019 | 2018 | 2019 | ||||||
| I | II | III | IV | I | II | III | IV | I | ||
| 1 | Current production measures: | |||||||||
| 2 | Corporate profits with IVA and CCAdj | 2,245.5 | 65.0 | 78.2 | −9.7 | −65.4 | 3.0 | 3.5 | −0.4 | −2.8 |
| 3 | Domestic industries | 1,770.9 | 69.5 | 76.9 | −11.6 | −54.6 | 4.1 | 4.4 | −0.6 | −3.0 |
| 4 | Financial | 433.9 | 16.5 | −6.1 | −25.2 | 7.4 | 3.7 | −1.3 | −5.6 | 1.7 |
| 5 | Nonfinancial | 1,337.1 | 53.0 | 83.0 | 13.6 | −62.1 | 4.2 | 6.4 | 1.0 | −4.4 |
| 6 | Rest of the world | 474.5 | −4.5 | 1.3 | 1.9 | −10.7 | −0.9 | 0.3 | 0.4 | −2.2 |
| 7 | Receipts from the rest of the world | 823.4 | 0.5 | −9.5 | 8.8 | 4.0 | 0.1 | −1.2 | 1.1 | 0.5 |
| 8 | Less: Payments to the rest of the world | 348.8 | 5.0 | −10.8 | 6.9 | 14.8 | 1.5 | −3.2 | 2.1 | 4.4 |
| 9 | Less: Taxes on corporate income | 242.0 | 22.8 | 8.9 | −9.0 | 7.4 | 10.7 | 3.8 | −3.7 | 3.1 |
| 10 | Equals: Profits after tax | 2,003.4 | 42.2 | 69.3 | −0.7 | −72.7 | 2.1 | 3.5 | 0.0 | −3.5 |
| 11 | Net dividends | 1,237.9 | 9.8 | 27.6 | 28.9 | −41.5 | 0.8 | 2.3 | 2.3 | −3.2 |
| 12 | Undistributed profits from current production | 765.5 | 32.4 | 41.7 | −29.5 | −31.2 | 4.3 | 5.3 | −3.6 | −3.9 |
| 13 | Net cash flow | 2,621.0 | 59.4 | 56.2 | 0.6 | 6.1 | 2.4 | 2.2 | 0.0 | 0.2 |
| Industry profits: | ||||||||||
| 14 | Profits with IVA | 2,165.3 | 70.4 | 82.3 | −5.9 | −18.3 | 3.5 | 3.9 | −0.3 | −0.8 |
| 15 | Domestic industries | 1,690.7 | 74.9 | 81.0 | −7.8 | −7.6 | 4.8 | 5.0 | −0.5 | −0.4 |
| 16 | Financial | 443.8 | 17.1 | −5.3 | −25.4 | 12.9 | 3.8 | −1.1 | −5.6 | 3.0 |
| 17 | Nonfinancial | 1,246.9 | 57.8 | 86.3 | 17.5 | −20.5 | 5.2 | 7.4 | 1.4 | −1.6 |
| 18 | Rest of the world | 474.5 | −4.5 | 1.3 | 1.9 | −10.7 | −0.9 | 0.3 | 0.4 | −2.2 |
| Addenda: | ||||||||||
| 19 | Profits before tax (without IVA and CCAdj) | 2,172.1 | 86.1 | 26.8 | −43.2 | −8.6 | 4.1 | 1.2 | −1.9 | −0.4 |
| 20 | Profits after tax (without IVA and CCAdj) | 1,930.1 | 63.4 | 17.9 | −34.2 | −16.0 | 3.3 | 0.9 | −1.7 | −0.8 |
| 21 | IVA | −6.8 | −15.7 | 55.5 | 37.3 | −9.8 | ...... | ...... | ...... | ...... |
| 22 | CCAdj | 80.2 | −5.4 | −4.1 | −3.8 | −47.0 | ...... | ...... | ...... | ...... |
- CCAdj
- Capital consumption adjustment
- IVA
- Inventory valuation adjustment
- “Real” estimates are in chained (2012) dollars, and price indexes are chain-type measures. Each GDP estimate for a quarter (advance, second, and third) incorporates increasingly comprehensive and improved source data; for more information, see “The Revisions to GDP, GDI, and Their Major Components” in the January 2018 Survey of Current Business. Quarterly estimates are expressed at seasonally adjusted annual rates, which reflect a rate of activity for a quarter as if it were maintained for a year.
- In this article, “consumer spending” refers to “personal consumption expenditures,” “inventory investment” refers to “change in private inventories,” and “government spending” refers to “government consumption expenditures and gross investment.”