
Accounting for Household Production in the National Accounts
An Update, 1965–2017
As established in Landefeld and McCulla (2000), Landefeld, Fraumeni, and Vojtech (2009), Bridgman and others (2012), and Bridgman (2016), household production is an important consideration when evaluating aggregate production; that is, it provides a useful complement to the gross domestic product (GDP) estimates published by the Bureau of Economic Analysis (BEA). Accordingly, BEA publishes a satellite account that estimates the value of production by households.
This article updates Household Production Satellite Account estimates to include years 2015 through 2017, providing estimates of GDP that incorporate the production of nonmarket services. Household production has remained relatively consistent over the years, with a few variations, which are described in this article.
One of the most important underlying pieces used in this satellite account is household production hours. After outlining the methodology of the updates to the estimates of GDP and producing updated tables of GDP, we will further explain the methodology and analyze trends in household production hours. We will examine the trends in such estimates as child care, cooking, housework, and gardening to show increases or decreases in hours of work performed by men and women, both employed and nonemployed.
This section extends the previous analysis of Bridgman (2016), with new data to take us from 2014 to 2017, using the same methodology that was previously published.
Chart 1 shows the “adjusted” GDP growth rate, that is, the growth rate obtained using the estimates of GDP that incorporate the production of nonmarket services against the growth rate of National Income and Product Accounts (NIPA) GDP, published in April 2019. Our estimates begin in 2003—the year the American Time Use Survey data, described later, first became available. From 2003 to 2017, we estimate an average annual growth rate of nominal GDP of 3.94 percent. When household production is included, this average annual growth rate drops to 3.82 percent. Overall, the two growth rates continue to track each other closely. Wages of household workers were weak during 2005 but strong during 2013, contributing to the difference of movement seen in those years; however, the difference in percent growth shown on the plot is still quite small.
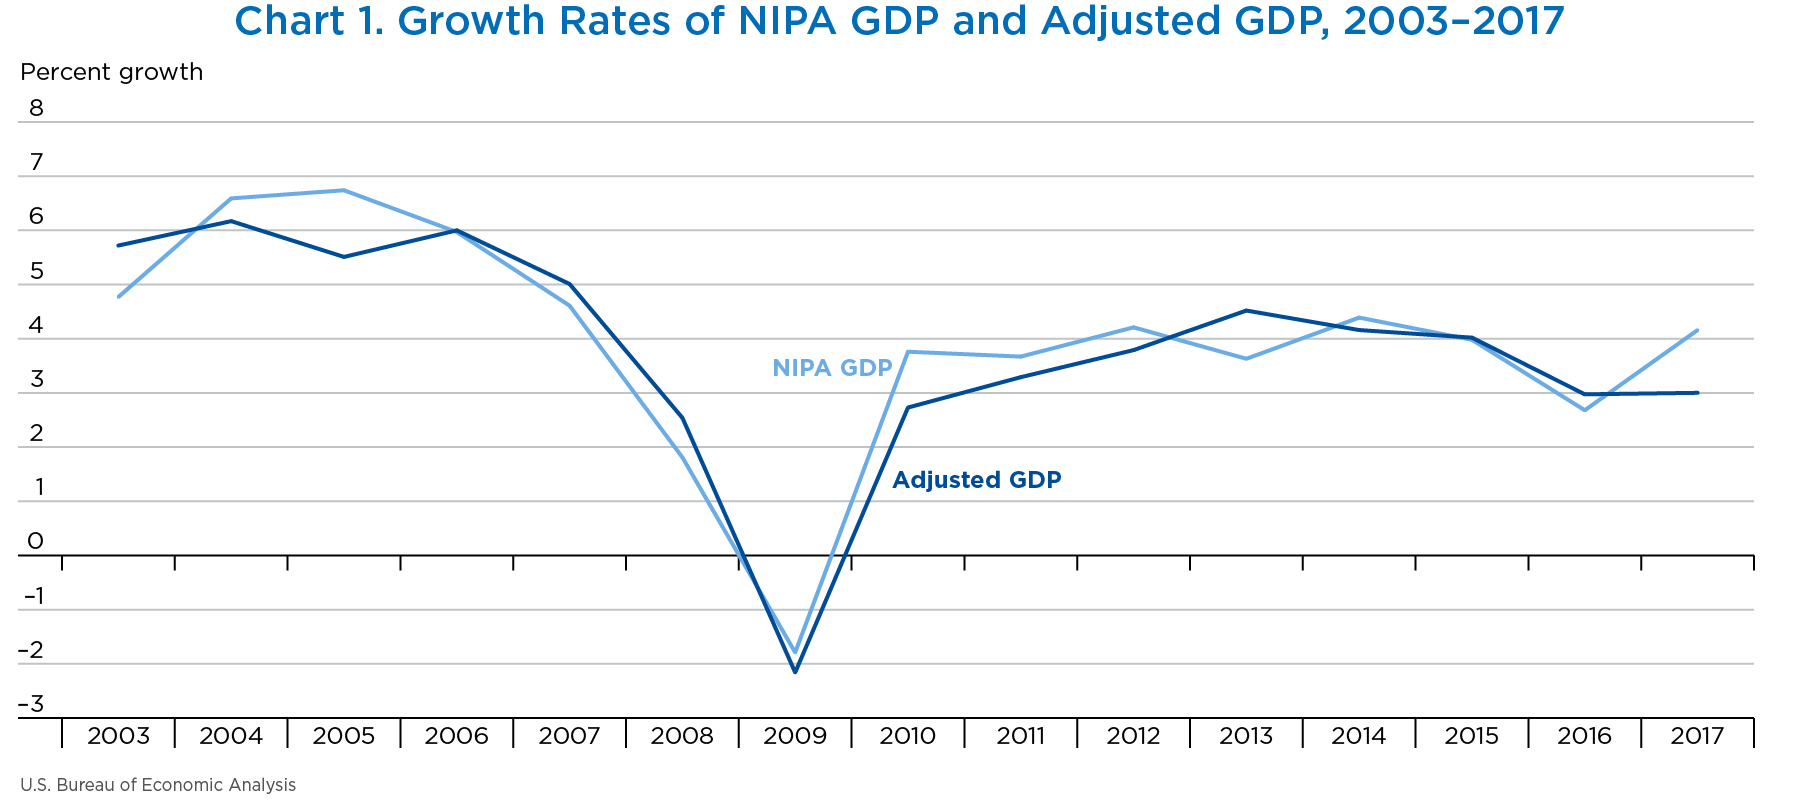
[Click chart to expand]
The largest impact when including household production in GDP stems from the inclusion of nonmarket services. Nonmarket services measure the value of time spent on home production tasks. Household production (table 1) is the value of these hours worked plus the consumer durables used.
To compute household production, we first aggregated household production hours across seven categories: housework, cooking, odd jobs, gardening, shopping, child care, and domestic travel. The value of nonmarket services is the product of the wage rate of general-purpose domestic workers and the number of hours worked. This method assumes a market-cost approach to valuing nonmarket household services. For further explanation regarding this and other approaches, see Bridgman (2016).
BEA's current GDP measure treats consumer purchases of durable goods as consumption. In contrast, this satellite account treats such purchases as investment and adds the services of consumer durables to personal consumption expenditures. These services are measured by applying the return on personal interest income and personal dividend income to stocks of consumer durables.
At the margin, households should be indifferent between investing in consumer durables and financial assets, in other words, the rate of return must be the same. Therefore, we set the rate of return on durables equal to that of the household sector's financial assets.
Tables 1 and 2 break out the adjustments into categories for the years 1965 and 2017. Table 1 is separated into two sections, both containing new data for 2017 and rates of growth based on this new data. One uses NIPA measures, while the other uses measures from the Household Production Satellite Account. Under NIPA measures, the categories under services of consumer durables and nonmarket services are zero because they are not included in NIPA GDP. The estimates of these categories, which are part of our satellite account, are shown under the heading “Household Production Satellite Account measures.” These estimates lead to an increase in personal consumption expenditures.
Table 2 contains data on the percentage share of GDP as defined by NIPA or household satellite account measures for various aggregate categories in both years. The first column contains the percentage growth of aggregate measures in the same year household production is included in GDP. The second column shows the relative impact on NIPA GDP when household production is included in the same year, where “impact” is defined as the increase in the aggregate measure upon the inclusion of household production divided by NIPA GDP. The third and fourth columns simply measure the aggregate share of GDP as defined by NIPA measures and household satellite account measures, respectively.
Personal investment is a new category that is created from adding investment in consumer durables from personal consumption expenditures and residential investment. Residential investment is categorized under gross business investment in the NIPAs. Reclassifying consumer durables as personal investment raises GDP because of the inclusion of a return on consumer investment. Moving residential investment under personal investment simply shifts it into a new category, but it doesn't actually change the measure. These figures are not adjusted for inflation since there is no clear price index to deflate household production.
Including the household sector in GDP slows the growth rate of output. From 1965 to 2017, the average annual growth rate of nominal GDP was 6.5 percent. When household production is included, this growth rate drops to 6.3 percent. Household production has declined in significance over time as more women engage in market work. This sector accounted for 37 percent of the satellite account's output in 1965, but that declined to 23 percent in 2017 (table 2).
| NIPA measures | Household Production Satelite Account measures | |||||||
|---|---|---|---|---|---|---|---|---|
| 1965 | 2017 | Average annual rate of change (percent) | Contribution to GDP Growth | 1965 | 2017 | Average annual rate of change (percent) | Contribution to GDP Growth | |
| Billions of dollars | Percent | Billions of dollars | Percent | |||||
| Gross domestic product | 742.3 | 19,485.4 | 6.5 | 100.0 | 1,019.7 | 24,001.5 | 6.3 | 100.0 |
| Personal consumption expenditures and investment | 443.0 | 13,321.4 | 6.8 | 68.7 | 755.6 | 18,592.1 | 6.4 | 77.6 |
| Personal consumption expenditures | 443.0 | 13,321.4 | 6.8 | 68.7 | 658.7 | 16,528.7 | 6.4 | 69.1 |
| Nondurables | 163.3 | 2,749.6 | 5.6 | 13.8 | 163.3 | 2,749.6 | 5.6 | 11.3 |
| Services | 213.3 | 9,165.3 | 7.5 | 47.8 | 490.7 | 13,681.4 | 6.6 | 57.4 |
| Housing | 76.6 | 2,447.8 | 6.9 | 12.7 | 76.6 | 2,447.8 | 6.9 | 10.3 |
| Services of consumer durables | 0.0 | 0.0 | n.a. | n.a. | 55.0 | 1,258.9 | 6.2 | 5.2 |
| Depreciation of consumer durables | 0.0 | 0.0 | n.a. | n.a. | 45.8 | 1,067.3 | 6.2 | 4.4 |
| Return to consumer durables | 0.0 | 0.0 | n.a. | n.a. | 9.2 | 191.6 | 6.0 | 0.8 |
| Nonmarket services | 0.0 | 0.0 | n.a. | n.a. | 222.4 | 3,257.2 | 5.3 | 13.2 |
| Other | 136.7 | 6,717.5 | 7.8 | 35.1 | 136.7 | 6,717.5 | 7.8 | 28.6 |
| Consumer durables1 | 66.4 | 1,406.5 | 6.0 | 7.1 | 4.7 | 97.7 | 6.0 | 0.4 |
| Investment | 0.0 | 0.0 | n.a. | n.a. | 96.9 | 2,063.4 | 6.1 | 8.6 |
| Residential | 0.0 | 0.0 | n.a. | n.a. | 35.2 | 754.6 | 6.1 | 3.1 |
| Consumer durables1 | 0.0 | 0.0 | n.a. | n.a. | 61.7 | 1,308.8 | 6.1 | 5.4 |
| Gross business investment | 129.6 | 3,368.0 | 6.5 | 17.3 | 94.4 | 2,613.4 | 6.6 | 11.0 |
| Nonresidential fixed investment | 85.2 | 2,587.9 | 6.8 | 13.4 | 85.2 | 2,587.9 | 6.8 | 10.9 |
| Change in business inventories | 9.2 | 25.5 | 2.0 | 0.1 | 9.2 | 25.5 | 2.0 | 0.1 |
| Residential | 35.2 | 754.6 | 6.1 | 3.8 | n.a. | n.a. | n.a. | n.a. |
| Net exports | 5.6 | −578.4 | −209.3 | −3.1 | 5.6 | −578.4 | −209.3 | −2.5 |
| Government consumption and investment | 164.1 | 3,374.4 | 6.0 | 17.1 | 164.1 | 3,374.4 | 6.0 | 14.0 |
| Other aggregates | ||||||||
| Labor income | 405.4 | 10,407.2 | 6.4 | 53.4 | 627.8 | 13,664.4 | 6.1 | 56.7 |
| Personal income | 570.7 | 16,830.9 | 6.7 | 86.8 | 848.1 | 21,347.0 | 6.4 | 89.2 |
| Personal savings | 58.8 | 986.8 | 5.6 | 5.0 | 74.7 | 1,228.3 | 5.5 | 5.0 |
| Private investment | 129.6 | 3,368.0 | 6.5 | 17.3 | 191.3 | 4,676.8 | 6.3 | 19.5 |
| Gross savings | 182.9 | 3,681.8 | 5.9 | 18.7 | 244.6 | 4,990.6 | 6.0 | 20.7 |
- Under current NIPA methodology, a portion of expenditures on “other motor vehicles and parts” are allocated as maintenance expenditures and are not capitalized in the fixed assets accounts.
| Impact of adjustment on National Income and Product Accounts (NIPA) GDP (percent) | Component shares of NIPA GDP (percent) | Satellite components share of satellite GDP (percent) | ||||
|---|---|---|---|---|---|---|
| 1965 | 2017 | 1965 | 2017 | 1965 | 2017 | |
| Gross domestic product | 37 | 23 | 100 | 100 | 100 | 100 |
| Personal consumption expenditures and investment | 42 | 27 | n.a. | n.a. | 74 | 77 |
| Personal consumption expenditures | 29 | 16 | 60 | 68 | 65 | 69 |
| Nondurables | 0 | 0 | 22 | 14 | 16 | 11 |
| Services | 37 | 23 | 29 | 47 | 48 | 57 |
| Housing | 0 | 0 | 10 | 13 | 8 | 10 |
| Services of consumer durables | 7 | 6 | n.a. | n.a. | 5 | 5 |
| Depreciation of consumer durables | 6 | 5 | n.a. | n.a. | 4 | 4 |
| Return to consumer durables | 1 | 1 | n.a. | n.a. | 1 | 1 |
| Nonmarket services | 30 | 17 | n.a. | n.a. | 22 | 14 |
| Other | 0 | 0 | 18 | 34 | 13 | 28 |
| Consumer durables1 | −8 | −7 | 9 | 7 | 0 | 0 |
| Investment | 13 | 11 | n.a. | n.a. | 10 | 9 |
| Residential | 5 | 4 | n.a. | n.a. | 3 | 3 |
| Consumer durables | 8 | 7 | n.a. | n.a. | 6 | 5 |
| Gross business investment1 | −5 | −4 | 17 | 17 | 9 | 11 |
| Nonresidential fixed investment | 0 | 0 | 11 | 13 | 8 | 11 |
| Change in business inventories | 0 | 0 | 1 | 0 | 1 | 0 |
| Residential1 | −5 | −4 | 5 | 4 | n.a. | n.a. |
| Net exports | 0 | 0 | 1 | −3 | 1 | −2 |
| Government consumption and investment | 0 | 0 | 22 | 17 | 16 | 14 |
| Other aggregates | ||||||
| Household Personal Consumption Expenditures (PCE) and investment share of GDP | n.a. | n.a. | 60 | 68 | 74 | 77 |
| Private investment share of GDP | n.a. | n.a. | 17 | 17 | 19 | 19 |
| Household investment share of private investment | n.a. | n.a. | 0 | 0 | 51 | 44 |
| Nonmarket services and services of consumer durables share of PCE | n.a. | n.a. | 0 | 0 | 42 | 27 |
| Labor income share of national income (GDP) | n.a. | n.a. | 55 | 53 | 62 | 57 |
| Personal saving rate (percent of personal income) | n.a. | n.a. | 10 | 6 | 9 | 6 |
| Personal saving rate (percent of personal disposable income) | n.a. | n.a. | 11 | 7 | 14 | 9 |
| Personal saving as percent of GDP | n.a. | n.a. | 8 | 5 | 7 | 5 |
| National saving rate (savings percent of GDP) | n.a. | n.a. | 25 | 19 | 24 | 21 |
- n.a.
- Not available
- The apparent negative impacts of the adjustments are solely a result of the reclassification of residential and consumer durables.
One of the most significant pieces of underlying data used in this account is household production hours. In this section, we will discuss the methodology behind this data and follow some interesting trends.
The source of household production hours data is the Multinational Time Use Survey (MTUS) and the American Time Use Survey (ATUS). The ATUS series begins in 2003 and tracks the number of hours per day American households spend on tasks such as cooking, housework, or gardening. The ATUS survey is large scale, having response sizes of 15,000 to 20,000 diary days, and is conducted on a yearly basis. Prior to 2003, there were a number of smaller scale surveys of household activities undertaken by the University of Michigan and the University of Maryland. These surveys were taken more sporadically than the ATUS survey and cover 1965–66, 1975–76, 1985, 1992–93 and 1998–99.
We combined the ATUS and MTUS data sets into a single data set that tracks household production between 1965 and 2017, following the previous methodology. The MTUS surveys split household time use into 41 different categories, seven of which are household production categories: housework, cooking, odd jobs, gardening, shopping, child care, and domestic travel. The MTUS data do not include hours for these seven categories outside the survey years. The ATUS survey contains a much more detailed accounting of household activities. To retain comparability between the two data sets, we reclassified each ATUS category into one of the seven aforementioned MTUS categories.
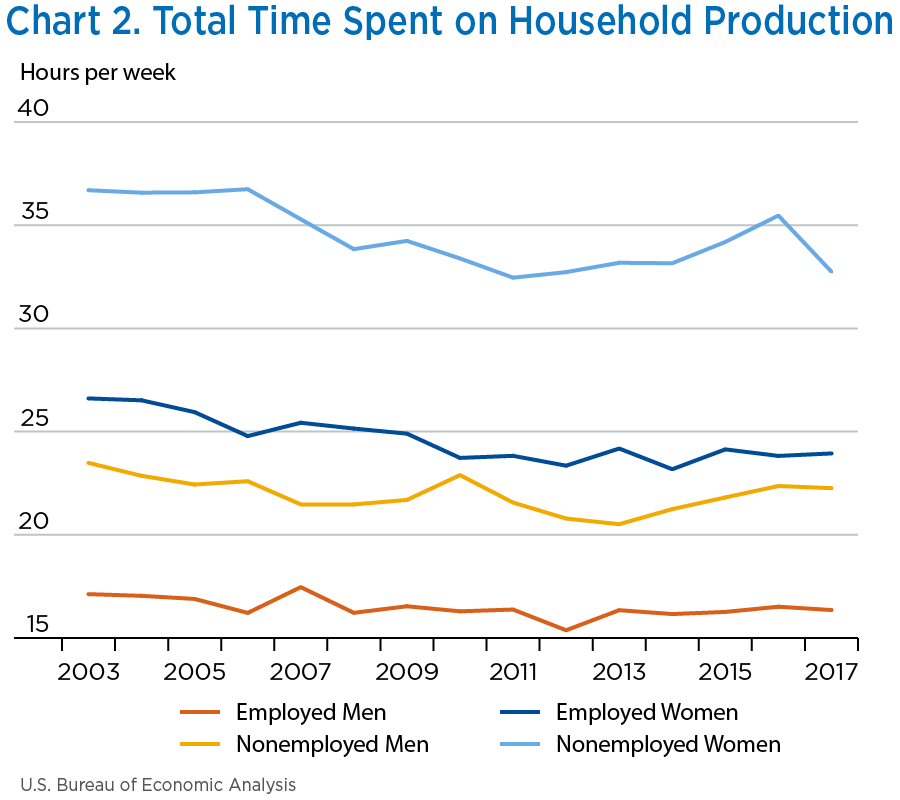
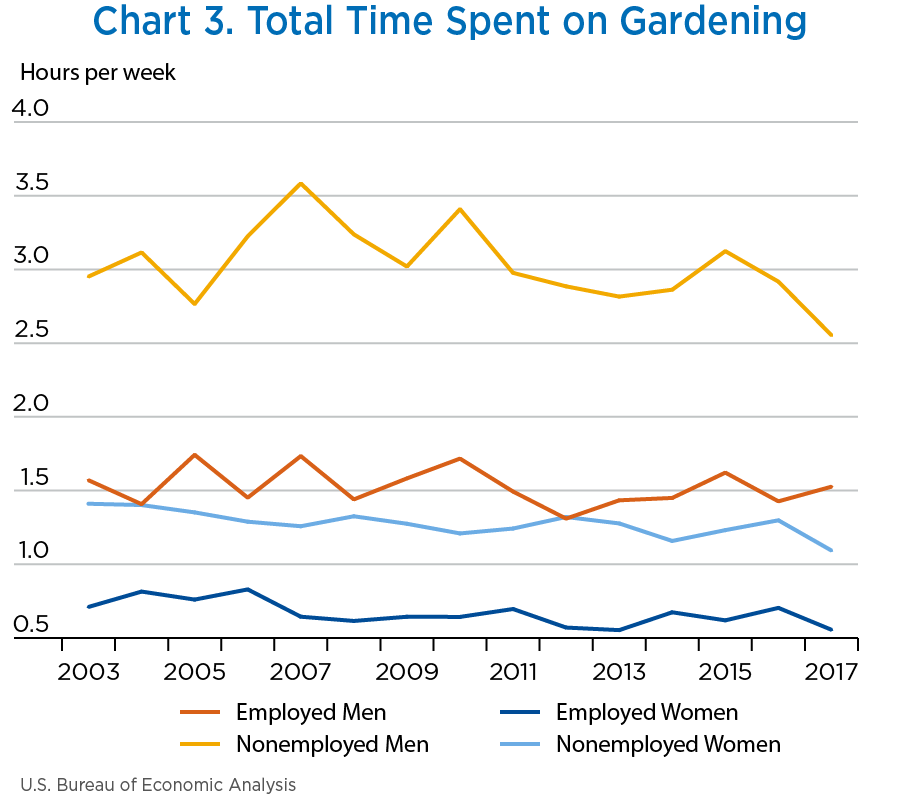
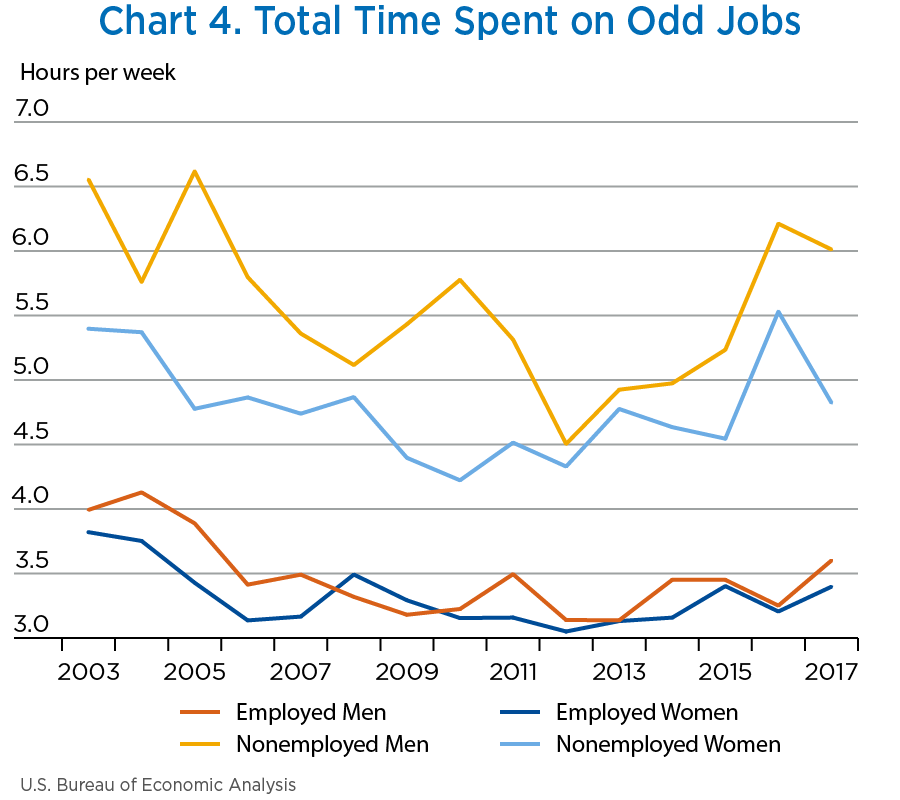
The time-series plots show relatively intuitive patterns of time use in the household. Broadly speaking, there exist consistent trends that are largely separated by gender, with women, particularly nonemployed women, spending more time on household activities than men (chart 2). However, two activities break this trend: gardening is primarily the domain of men, nonemployed men in particular, and the principal difference in time spent performing odd jobs is attributable to employment status, not gender (charts 3 and 4).
[Click chart to expand]
[Click chart to expand]
[Click chart to expand]
The aggregate shows the overall trend for both employed women and nonemployed women is decreasing, leading to the aforementioned decline in the size of household production. Because nonemployed women perform more household production hours, the decline in these hours has a bigger impact on the aggregate and is the main contributor to the decline in the overall size of household production.
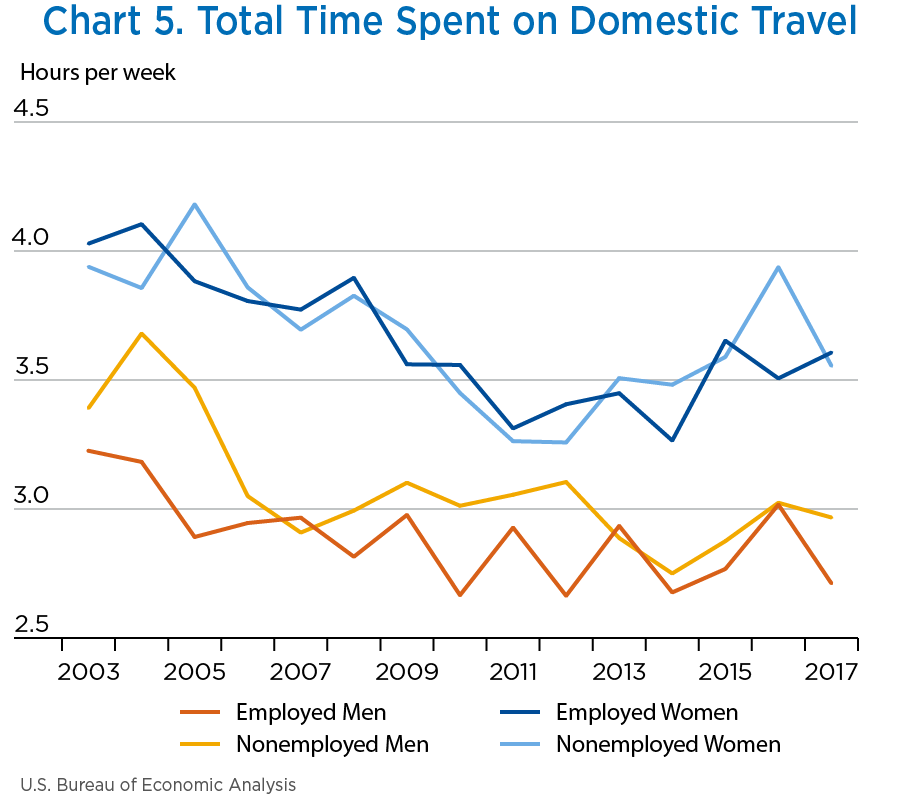
The domestic travel category captures the amount of time spent traveling in support of the other time-use categories (not time spent going on vacations) (chart 5). For example, time spent driving to a day care center (child care), time spent riding on a bus to a grocery store (cooking), and so forth. This category is not as volatile as it appears. The time-use plot of this category only appears volatile because the scale of hours per week is smaller than the scale on the other plots. If one looks at the starting and final values of each series, one would find that the time spent per week declines by less than an hour.
[Click chart to expand]
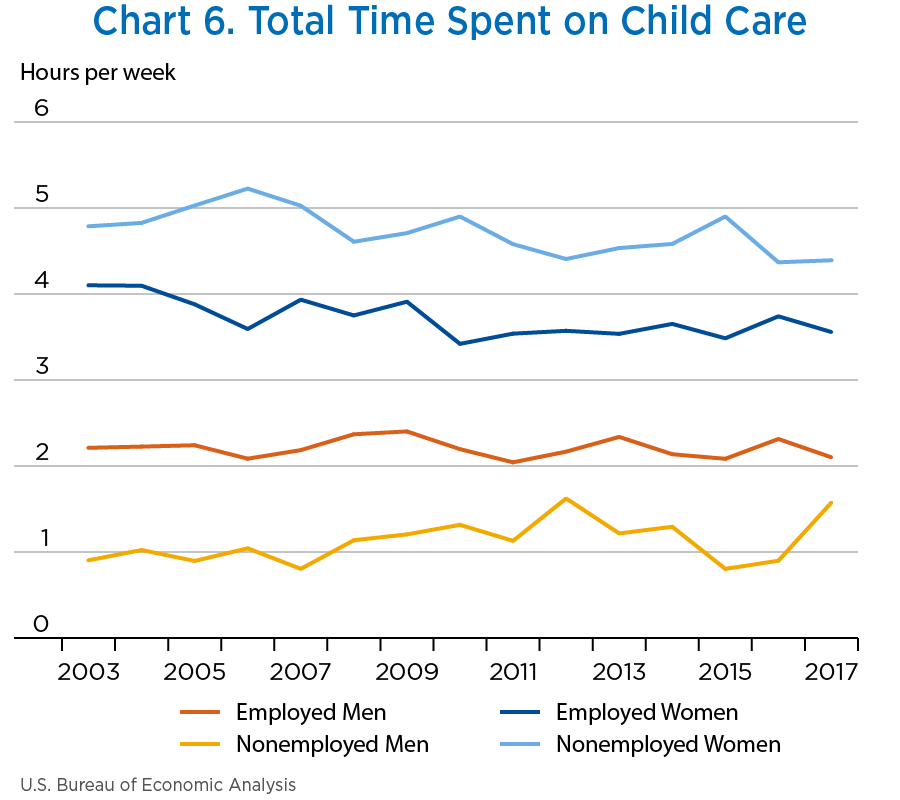
Regarding hours per week spent on child care, we see that women spend more time caring for children than men (whether each gender is employed or not) (chart 6). However, in recent years, nonemployed men have been performing more hours of child care, while employed women are performing fewer hours of child care.
[Click chart to expand]
[Click chart to expand]
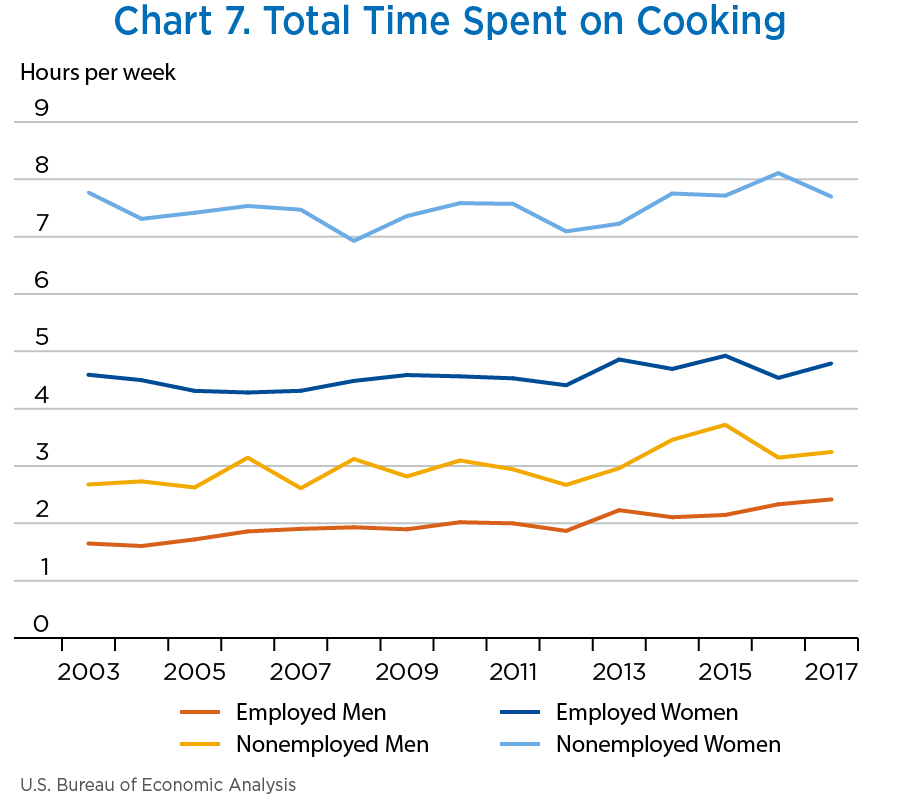
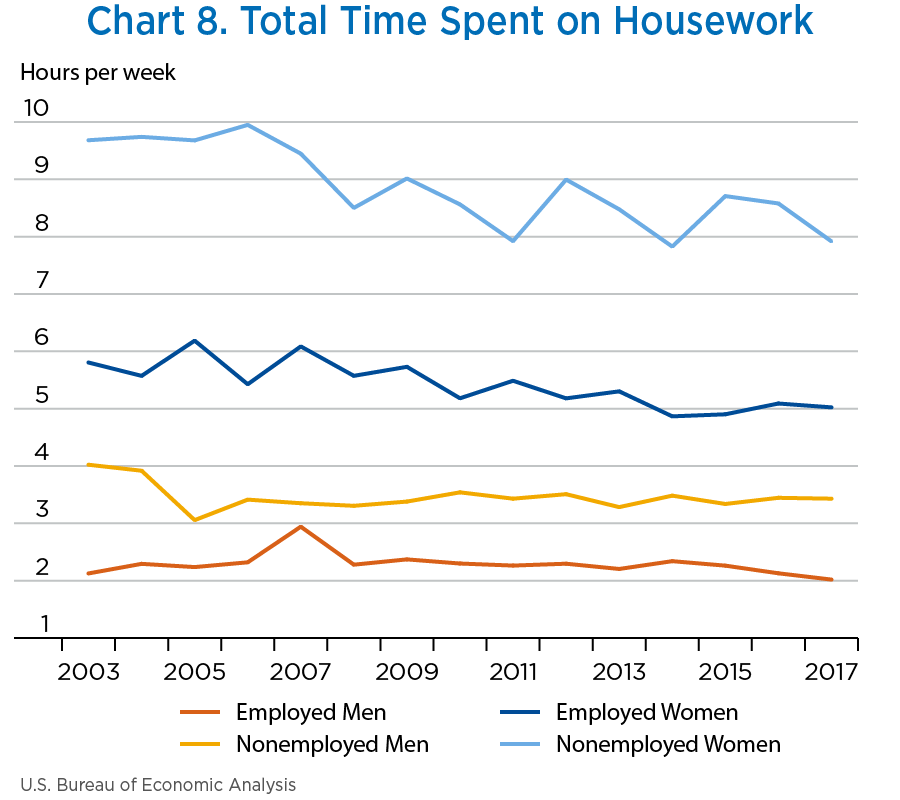
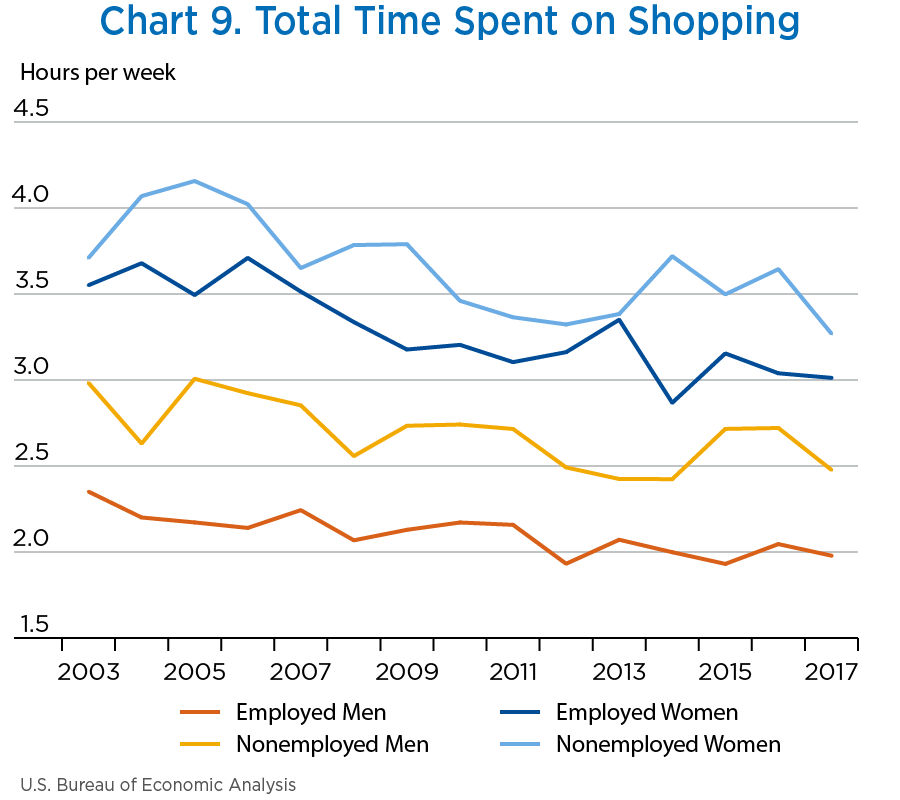
With regards to cooking (chart 7), housework (chart 8), and shopping (chart 9), we see a clear distinction between the four series, delineated by employment status and gender. In an absolute sense, nonemployed women spend more hours per week on these categories than employed women. However, employed women spend more hours per week than nonemployed men, with employed men spending the fewest hours per week on household work.
[Click chart to expand]
[Click chart to expand]
This paper presents updates of BEA's Household Production Satellite Account from 1965 to 2017. Household production is a significant and important economic measure that adds value to BEA's GDP estimates. By tracking household production hours, we can see consistent trends that are largely separated by gender and monitor these trends over time, giving us insight into the activities of men and women and the effects on the economy over time. Significant historic changes have occurred over the decades analyzed here, and while most trends have been consistent, nonemployed women in particular are shown to have performed fewer hours of household work, leading to a decline in the size of household production.
Bridgman, Benjamin. 2016. “Accounting for Household Production in the National Accounts, 1965–2014.” Survey of Current Business 96 (February): 1–5.
Bridgman, Benjamin, Andrew Dugan, Mikhail Lal, Matthew Osborne, and Shaunda Villones. 2012. “Accounting for Household Production in the National Accounts, 1965–2010.” Survey of Current Business 92 (May): 23–36.
Landefeld, J. Steven, and Stephanie H. McCulla. 2000. “Accounting for Nonmarket Household Pro- duction Within a National Accounts Framework.” Review of Income and Wealth 46, No. 3 (September): 289–307.
Landefeld, J. Steven, Barbara M. Fraumeni, and Cindy M. Vojtech. 2009. “Accounting for Household Production: A Prototype Satellite Account Using the American Time Use Survey.” Review of Income and Wealth 55, No. 2 (June): 205–225.