
U.S. International Transactions
Third Quarter 2019
The U.S. current-account deficit, which reflects the combined balances on trade in goods and services and income flows between U.S. residents and residents of other countries, narrowed by $1.1 billion, or 0.9 percent, to $124.1 billion in the third quarter of 2019 (chart 1 and table A). The revised second-quarter deficit was $125.2 billion.
The deficit was 2.3 percent of current-dollar gross domestic product, down less than 0.1 percent from the second quarter.
The $1.1 billion narrowing of the current-account deficit in the third quarter mainly reflected a reduced deficit on goods and an expanded surplus on primary income.

[Click chart to expand]
| 2018 | 2019 | Change 2019:II to 2019:III | |||
|---|---|---|---|---|---|
| IV | I | II r | II p | ||
| Current account | |||||
| Exports of goods and services and income receipts (credits) | 938,689 | 940,922 | 948,676 | 944,386 | −4,290 |
| Exports of goods and services | 623,761 | 626,970 | 626,953 | 625,795 | −1,158 |
| Goods | 416,964 | 419,100 | 414,694 | 413,812 | −882 |
| Services | 206,797 | 207,870 | 212,259 | 211,983 | −276 |
| Primary income receipts | 276,483 | 278,138 | 286,142 | 282,007 | −4,135 |
| Secondary income (current transfer) receipts | 38,445 | 35,814 | 35,581 | 36,584 | 1,003 |
| Imports of goods and services and income payments (debits) | 1,082,616 | 1,077,116 | 1,073,886 | 1,068,480 | −5,406 |
| Imports of goods and services | 794,907 | 783,443 | 786,061 | 783,153 | −2,908 |
| Goods | 649,288 | 635,844 | 637,911 | 633,370 | −4,541 |
| Services | 145,620 | 147,599 | 148,150 | 149,784 | 1,634 |
| Primary income payments | 216,424 | 221,275 | 219,517 | 213,288 | −6,229 |
| Secondary income (current transfer) payments | 71,285 | 72,399 | 68,307 | 72,039 | 3,732 |
| Capital account | |||||
| Capital transfer receipts and other credits | 2,723 | 0 | 0 | 0 | 0 |
| Capital transfer payments and other debits | 2 | 0 | 0 | 10 | 10 |
| Financial account | |||||
| Net U.S. acquisition of financial assets excluding financial derivatives (net increase in assets / financial outflow (+)) | 147,259 | 110,967 | 142,153 | 123,516 | −18,637 |
| Direct investment assets | 25,696 | 7,878 | 111,272 | 33,320 | −77,952 |
| Portfolio investment assets | −22,210 | −41,876 | 26,706 | 18,461 | −8,245 |
| Other investment assets | 141,668 | 144,757 | 1,815 | 69,852 | 68,037 |
| Reserve assets | 2,105 | 208 | 2,359 | 1,882 | −477 |
| Net U.S. incurrence of liabilities excluding financial derivatives (net increase in liabilities / financial inflow (+)) | 286,247 | 126,280 | 345,893 | 164,922 | −180,971 |
| Direct investment liabilities | 52,720 | 110,079 | 93,251 | 37,642 | −55,609 |
| Portfolio investment liabilities | 14,884 | −42,822 | 181,016 | 86,479 | −94,537 |
| Other investment liabilities | 218,644 | 59,023 | 71,626 | 40,801 | −30,825 |
| Financial derivatives other than reserves, net transactions | −22,632 | −21,421 | −9,642 | −6,456 | 3,186 |
| Statistical discrepancy | |||||
| Statistical discrepancy1 | −20,414 | 99,461 | −88,173 | 76,242 | 164,415 |
| Balances | |||||
| Balance on current account | −143,927 | −136,194 | −125,210 | −124,094 | 1,116 |
| Balance on goods and services | −171,146 | −156,473 | −159,108 | −157,358 | 1,750 |
| Balance on goods | −232,323 | −216,744 | −223,218 | −219,558 | 3,660 |
| Balance on services | 61,177 | 60,271 | 64,109 | 62,199 | −1,910 |
| Balance on primary income | 60,059 | 56,864 | 66,625 | 68,719 | 2,094 |
| Balance on secondary income | −32,841 | −36,585 | −32,726 | −35,454 | −2,728 |
| Balance on capital account | 2,721 | 0 | 0 | −10 | −10 |
| Net lending (+) or net borrowing (−) from current- and capital-account transactions2 | −141,206 | −136,194 | −125,210 | −124,105 | 1,105 |
| Net lending (+) or net borrowing (−) from financial-account transactions3 | −161,621 | −36,734 | −213,382 | −47,862 | 165,520 |
- p
- Preliminary
- r
- Revised
- The statistical discrepancy is the difference between net acquisition of financial assets and net incurrence of liabilities in the financial account (including financial derivatives) less the difference between total credits and total debits recorded in the current and capital accounts.
- Sum of current- and capital-account balances.
- Sum of net U.S. acquisition of financial assets and net transactions in financial derivatives less net U.S. incurrence of liabilities.
Note. The statistics are presented in table 1.2 on BEA's website.
Exports of goods and services to, and income received from, foreign residents decreased $4.3 billion to $944.4 billion in the third quarter (charts 2 and 3 and table B). Imports of goods and services from, and income paid to, foreign residents decreased $5.4 billion to $1.07 trillion (charts 2 and 4 and table C).

[Click chart to expand]
Trade in goods
Exports of goods decreased $0.9 billion to $413.8 billion, and imports of goods decreased $4.5 billion to $633.4 billion. The decreases in both exports and imports mainly reflected decreases in industrial supplies and materials, primarily petroleum and products.
Trade in services
Exports of services decreased $0.3 billion to $212.0 billion, reflecting partly offsetting changes across major categories. Decreases were led by travel, mainly other personal travel, and increases were led by other business services, mainly professional and management consulting services. Imports of services increased $1.6 billion to $149.8 billion, reflecting increases in nearly all major categories. Increases were led by insurance services, mainly reinsurance.
Primary income
Receipts of primary income decreased $4.1 billion to $282.0 billion, and payments of primary income decreased $6.2 billion to $213.3 billion. The decreases in both receipts and payments mainly reflected decreases in direct investment income and in other investment income. Within direct investment income receipts, dividends increased $24.9 billion to $95.3 billion in the third quarter and remain elevated since the passage of the 2017 Tax Cuts and Jobs Act, which generally eliminated taxes on repatriated earnings beginning in 2018. For more information, see “How do the effects of the 2017 Tax Cuts and Jobs Act appear in BEA's direct investment statistics?” The decreases in other investment income receipts and payments mainly reflected decreases in interest on loans and deposits.
Secondary income
Receipts of secondary income increased $1.0 billion to $36.6 billion, mainly reflecting an increase in private sector fines and penalties, a component of private transfer receipts. Payments of secondary income increased $3.7 billion to $72.0 billion, mainly reflecting increases in U.S. government grants and in insurance-related transfers, a component of private transfer payments.

[Click chart to expand]

[Click chart to expand]
| 2018 | 2019 | Change 2019:II to 2019:III | |||
|---|---|---|---|---|---|
| IV | I | II r | III p | ||
| Exports of goods and services and income receipts | 938,689 | 940,922 | 948,676 | 944,386 | −4,290 |
| Exports of goods | 416,964 | 419,100 | 414,694 | 413,812 | −882 |
| General merchandise | 412,683 | 414,383 | 410,444 | 408,782 | −1,662 |
| Foods, feeds, and beverages | 29,988 | 32,737 | 35,206 | 34,829 | −377 |
| Industrial supplies and materials | 136,077 | 130,689 | 132,934 | 129,810 | −3,124 |
| Energy products | 57,659 | 53,445 | 56,953 | 54,851 | −2,102 |
| Of which: Petroleum and products | 50,018 | 46,006 | 49,472 | 47,590 | −1,882 |
| Nonenergy products | 78,418 | 77,244 | 75,981 | 74,959 | −1,022 |
| Capital goods except automotive | 142,219 | 142,068 | 135,685 | 135,118 | −567 |
| Automotive vehicles, parts, and engines | 37,827 | 41,274 | 40,255 | 41,460 | 1,205 |
| Consumer goods except food and automotive | 51,917 | 52,963 | 51,465 | 51,812 | 347 |
| Other general merchandise | 14,655 | 14,651 | 14,899 | 15,753 | 854 |
| Net exports of goods under merchanting | 68 | 92 | 85 | 87 | 2 |
| Nonmonetary gold | 4,214 | 4,625 | 4,165 | 4,943 | 778 |
| Exports of services1 | 206,797 | 207,870 | 212,259 | 211,983 | −276 |
| Maintenance and repair services n.i.e. | 8,225 | 8,062 | 7,743 | 8,060 | 317 |
| Transport | 22,882 | 23,029 | 23,260 | 22,769 | −491 |
| Travel (for all purposes including education) | 53,297 | 54,256 | 53,436 | 52,803 | −633 |
| Business | 9,504 | 9,527 | 9,570 | 9,446 | −124 |
| Personal | 43,793 | 44,729 | 43,867 | 43,357 | −510 |
| Insurance services | 4,417 | 4,404 | 4,359 | 4,388 | 29 |
| Financial services | 27,854 | 27,319 | 28,714 | 28,915 | 201 |
| Charges for the use of intellectual property n.i.e. | 31,467 | 31,571 | 32,745 | 32,308 | −437 |
| Telecommunications, computer, and information services | 11,230 | 11,407 | 11,887 | 12,122 | 235 |
| Other business services | 42,074 | 42,931 | 44,838 | 45,403 | 565 |
| Government goods and services n.i.e. | 5,350 | 4,890 | 5,276 | 5,215 | −61 |
| Primary income receipts | 276,483 | 278,138 | 286,142 | 282,007 | −4,135 |
| Investment income | 274,786 | 276,434 | 284,432 | 280,293 | −4,139 |
| Direct investment income | 141,248 | 143,545 | 147,653 | 144,559 | −3,094 |
| Portfolio investment income | 107,568 | 103,721 | 107,619 | 108,693 | 1,074 |
| Income on equity and investment fund shares | 71,983 | 68,621 | 72,181 | 72,820 | 639 |
| Interest on debt securities | 35,586 | 35,100 | 35,438 | 35,874 | 436 |
| Other investment income | 25,783 | 28,935 | 28,912 | 26,798 | −2,114 |
| Reserve asset income | 187 | 231 | 248 | 243 | −5 |
| Compensation of employees | 1,697 | 1,704 | 1,710 | 1,714 | 4 |
| Secondary income (current transfer) receipts2 | 38,445 | 35,814 | 35,581 | 36,584 | 1,003 |
- p
- Preliminary
- r
- Revised
- n.i.e.
- Not included elsewhere
- See also Shari A. Allen, Thomas Anderson, and Alexis N. Grimm, “Trade in Services in 2018 and Services Supplied Through Affiliates in 2017,” Survey of Current Business 99 (October 2019).
- Secondary income receipts include U.S. government and private transfers, such as fines and penalties, withholding taxes, insurance-related transfers, and other current transfers.
| 2018 | 2019 | Change 2019:II to 2019:III | |||
|---|---|---|---|---|---|
| IV | I | II r | III p | ||
| Imports of goods and services and income payments | 1,082,616 | 1,077,116 | 1,073,886 | 1,068,480 | −5,406 |
| Imports of goods | 649,288 | 635,844 | 637,911 | 633,370 | −4,541 |
| General merchandise | 646,669 | 633,933 | 636,136 | 630,446 | −5,690 |
| Foods, feeds, and beverages | 37,358 | 37,488 | 38,609 | 38,383 | −226 |
| Industrial supplies and materials | 144,308 | 134,257 | 136,596 | 129,948 | −6,648 |
| Energy products | 60,804 | 54,733 | 60,771 | 53,835 | −6,936 |
| Of which: Petroleum and products | 56,190 | 50,398 | 57,327 | 50,510 | −6,817 |
| Nonenergy products | 83,504 | 79,524 | 75,825 | 76,113 | 288 |
| Capital goods except automotive | 175,102 | 172,328 | 170,702 | 169,820 | −882 |
| Automotive vehicles, parts, and engines | 96,013 | 95,529 | 97,000 | 95,768 | −1,232 |
| Consumer goods except food and automotive | 166,557 | 167,657 | 165,328 | 167,930 | 2,602 |
| Other general merchandise | 27,331 | 26,674 | 27,902 | 28,596 | 694 |
| Nonmonetary gold | 2,619 | 1,911 | 1,775 | 2,924 | 1,149 |
| Imports of services1 | 145,620 | 147,599 | 148,150 | 149,784 | 1,634 |
| Maintenance and repair services n.i.e. | 2,287 | 2,163 | 2,276 | 2,302 | 26 |
| Transport | 28,119 | 27,925 | 27,449 | 27,309 | −140 |
| Travel (for all purposes including education) | 37,364 | 37,799 | 37,797 | 37,901 | 104 |
| Business | 4,082 | 4,039 | 3,968 | 4,133 | 165 |
| Personal | 33,282 | 33,759 | 33,829 | 33,768 | −61 |
| Insurance services | 11,369 | 11,680 | 12,131 | 12,790 | 659 |
| Financial services | 7,932 | 8,451 | 8,388 | 8,621 | 233 |
| Charges for the use of intellectual property n.i.e. | 14,445 | 14,256 | 14,242 | 14,526 | 284 |
| Telecommunications, computer, and information services | 10,690 | 10,309 | 10,761 | 10,863 | 102 |
| Other business services | 27,635 | 29,114 | 29,143 | 29,410 | 267 |
| Government goods and services n.i.e. | 5,779 | 5,903 | 5,961 | 6,062 | 101 |
| Primary income payments | 216,424 | 221,275 | 219,517 | 213,288 | −6,229 |
| Investment income | 211,467 | 216,322 | 214,522 | 208,166 | −6,356 |
| Direct investment income | 62,648 | 65,318 | 61,767 | 57,489 | −4,278 |
| Portfolio investment income | 119,879 | 119,776 | 121,649 | 122,234 | 585 |
| Income on equity and investment fund shares | 40,874 | 40,849 | 42,723 | 42,573 | −150 |
| Interest on debt securities | 79,004 | 78,927 | 78,926 | 79,661 | 735 |
| Other investment income | 28,941 | 31,228 | 31,106 | 28,443 | −2,663 |
| Compensation of employees | 4,956 | 4,953 | 4,995 | 5,122 | 127 |
| Secondary income (current transfer) payments2 | 71,285 | 72,399 | 68,307 | 72,039 | 3,732 |
- p
- Preliminary
- r
- Revised
- n.i.e.
- Not included elsewhere
- See also Shari A. Allen, Thomas Anderson, and Alexis N. Grimm, “Trade in Services in 2018 and Services Supplied Through Affiliates in 2017,” Survey of Current Business 99 (October 2019).
- Secondary income payments include U.S. government and private transfers, such as U.S. government grants and pensions, fines and penalties, withholding taxes, personal transfers (remittances), insurance-related transfers, and other current transfers.
Net financial-account transactions were −$47.9 billion in the third quarter, reflecting net U.S. borrowing from foreign residents.
Financial assets
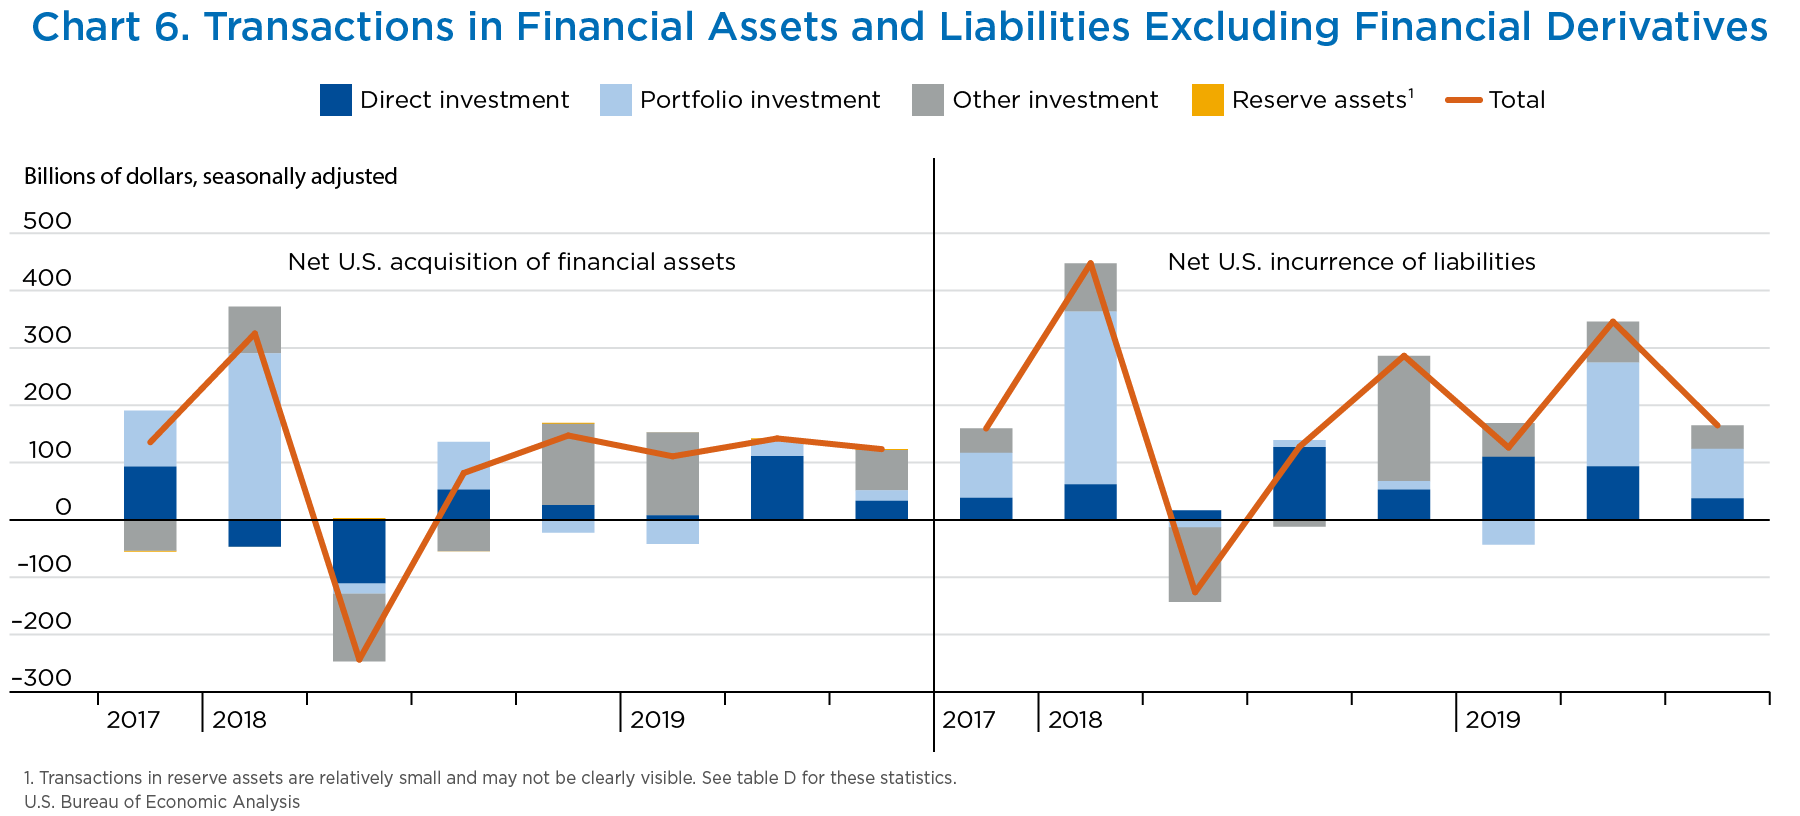
Third-quarter transactions increased U.S. residents' foreign financial assets by $123.5 billion (charts 5 and 6 and table D). Transactions increased direct investment assets, primarily equity, by $33.3 billion; portfolio investment assets, mainly debt securities, by $18.5 billion; other investment assets, primarily loans, by $69.9 billion; and reserve assets by $1.9 billion.
Liabilities
Third-quarter transactions increased U.S. liabilities to foreign residents by $164.9 billion. Transactions increased direct investment liabilities, mainly equity, by $37.6 billion; portfolio investment liabilities, mainly debt securities, by $86.5 billion; and other investment liabilities, mainly bank deposits, by $40.8 billion.
Financial derivatives
Net transactions in financial derivatives were −$6.5 billion in the third quarter, reflecting net borrowing from foreign residents.

[Click chart to expand]
[Click chart to expand]
| 2018 | 2019 | Change 2019:II to 2019:III | |||
|---|---|---|---|---|---|
| IV | I | II r | III p | ||
| Net U.S. acquisition of financial assets excluding financial derivatives (net increase in assets / financial outflow (+)) | 147,259 | 110,967 | 142,153 | 123,516 | −18,637 |
| Direct investment assets | 25,696 | 7,878 | 111,272 | 33,320 | −77,952 |
| Equity | 19,875 | 45,969 | 78,940 | 43,316 | −35,624 |
| Equity other than reinvestment of earnings | 32,514 | 4,905 | 8,171 | 528 | −7,643 |
| Reinvestment of earnings | −12,639 | 41,065 | 70,769 | 42,788 | −27,981 |
| Debt instruments | 5,821 | −38,091 | 32,332 | −9,996 | −42,328 |
| Portfolio investment assets | −22,210 | −41,876 | 26,706 | 18,461 | −8,245 |
| Equity and investment fund shares | 31,754 | −50,488 | −30,446 | −61,109 | −30,663 |
| Debt securities | −53,964 | 8,612 | 57,152 | 79,570 | 22,418 |
| Short-term securities | −33,155 | 16,591 | 23,109 | 43,554 | 20,445 |
| Long-term corporate securities | −14,190 | −8,415 | 23,801 | 22,895 | −906 |
| Other long-term securities | −6,619 | 436 | 10,242 | 13,121 | 2,879 |
| Other investment assets | 141,668 | 144,757 | 1,815 | 69,852 | 68,037 |
| Currency and deposits | 68,005 | 12,962 | 37,392 | −6,516 | −43,908 |
| Loans | 71,630 | 133,716 | −34,814 | 71,837 | 106,651 |
| Trade credit and advances | 2,033 | −1,921 | −762 | 4,531 | 5,293 |
| Reserve assets | 2,105 | 208 | 2,359 | 1,882 | −477 |
| Monetary gold | 0 | 0 | 0 | 0 | 0 |
| Special drawing rights | 47 | 57 | 60 | 63 | 3 |
| Reserve position in the International Monetary Fund | 2,049 | 114 | 2,248 | 1,754 | −494 |
| Other reserve assets | 9 | 38 | 51 | 64 | 13 |
| Net U.S. incurrence of liabilities excluding financial derivatives (net increase in liabilities / financial inflow (+)) | 286,247 | 126,280 | 345,893 | 164,922 | −180,971 |
| Direct investment liabilities | 52,720 | 110,079 | 93,251 | 37,642 | −55,609 |
| Equity | 117,667 | 87,529 | 71,597 | 41,272 | −30,325 |
| Equity other than reinvestment of earnings | 80,200 | 45,889 | 33,316 | 9,907 | −23,409 |
| Reinvestment of earnings | 37,468 | 41,641 | 38,281 | 31,365 | −6,916 |
| Debt instruments | −64,948 | 22,549 | 21,654 | −3,630 | −25,284 |
| Portfolio investment liabilities | 14,884 | −42,822 | 181,016 | 86,479 | −94,537 |
| Equity and investment fund shares | 117,758 | −214,949 | 96,780 | −64,803 | −161,583 |
| Debt securities | −102,874 | 172,127 | 84,236 | 151,283 | 67,047 |
| Short term | 13,045 | 22,022 | −78,972 | 62,280 | 141,252 |
| Treasury bills and certificates | 30,182 | 18,041 | −57,630 | 42,275 | 99,905 |
| Federally sponsored agency securities | −2,082 | 3,901 | 47 | −868 | −915 |
| Other short-term securities | −15,055 | 80 | −21,389 | 20,873 | 42,262 |
| Long term | −115,919 | 150,105 | 163,209 | 89,003 | −74,206 |
| Treasury bonds and notes | −83,006 | 121,286 | 112,919 | 33,844 | −79,075 |
| Federally sponsored agency securities | 16,295 | 10,670 | 19,732 | 11,237 | −8,495 |
| Corporate bonds and notes | −47,683 | 17,366 | 31,959 | 43,087 | 11,128 |
| Other | −1,525 | 783 | −1,401 | 835 | 2,236 |
| Other investment liabilities | 218,644 | 59,023 | 71,626 | 40,801 | −30,825 |
| Currency (short term) | 9,364 | 5,249 | 9,356 | 19,110 | 9,754 |
| Deposits | 95,229 | −36,613 | 104,297 | 74,020 | −30,277 |
| Loans | 114,887 | 83,326 | −42,876 | −51,388 | −8,512 |
| Trade credit and advances | −836 | 7,061 | 849 | −942 | −1,791 |
| Special drawing rights allocations | 0 | 0 | 0 | 0 | 0 |
- p
- Preliminary
- r
- Revised
The U.S. international transactions statistics for the second quarter have been updated to incorporate newly available and revised source data (table E).
| Preliminary Estimates | Revised Estimates | |
|---|---|---|
| Balance on current account | −128,188 | −125,210 |
| Balance on goods | −223,328 | −223,218 |
| Balance on services | 59,994 | 64,109 |
| Balance on primary income | 67,616 | 66,625 |
| Balance on secondary income (current transfers) | −32,470 | −32,726 |
| Balance on capital account | 0 | 0 |
| Net lending or borrowing from financial-account transactions | −155,140 | −213,382 |
| Net U.S. acquisition of financial assets | 208,217 | 142,153 |
| Net U.S. incurrence of liabilities | 354,137 | 345,893 |
| Financial derivatives other than reserves, net transactions | −9,220 | −9,642 |