
GDP and Beyond
Priorities and Plans
Gross domestic product (GDP) and the broader system of national accounts are the world’s most comprehensive measures of economic activity. They are used to guide monetary, fiscal, trade, tax, and regulatory policies; allocate federal and state and local funds; provide the baseline for budgeting at all levels of government; inform business and investment decisions; and provide households and voters with objective measures of the state of the economy. Virtually all nations around the globe produce and rely upon estimates of GDP and GDP per capita.
Despite the importance of GDP and the national accounts, throughout their history, concerns have been raised that they do not offer broad enough measures of nonmarket production, economic well-being, or the sustainability of economic growth. In the 1930s, Simon Kuznets, one of the architects of the U.S. national accounts, pointed to the limitations of emphasizing market aggregates, like GDP and national income, and excluding nonmarket activities that have productive value or that enhance economic and social welfare. This criticism is still applicable today. Key inputs into economic growth, such as investments in higher education, are not counted. Unpaid work done inside the home is not included. Investment in intangible assets, such as research and development (R&D), were, until recently, not measured, and a broad range of such assets are still not adequately captured.
In addition, national accounts do not typically include distributions of income across households. Nor do they accurately portray the use, or depletion, of natural resources in production. Furthermore, many of the headline economic statistics, such as GDP, are not indicators of sustainable growth—they do not deduct capital used up in production. Statistics like net domestic product or net investment do provide measures of sustainable growth, but they are not regularly featured or widely used.
Over the last several decades, these economic measurement concerns have been driven to the forefront by a wide range of issues. Recently, for example, questions have emerged regarding income inequality. Despite record low unemployment and steady economic growth, did all individuals, industries, and regions of the country benefit from the longest economic expansion on record? Other questions have been raised about areas that are not well covered by the accounts, including costs of and access to health care, the impact of the economy on the environment, and education. Much recent economic research also has focused on the role of “free” goods and services often provided via digital platforms.
The Bureau of Economic Analysis (BEA) recently embarked on an initiative—“GDP and Beyond”—to identify ways to use its data resources and statistical knowledge to inform the discussion of well-being. These efforts build on decades of research and improvements aimed at developing better measures of GDP and leveraging extended, or what are sometimes called “satellite,” accounts to highlight specific sectors of the economy or to quantify activities that may not be reflected directly in BEA’s core sets of statistics.1 This initiative encompasses a wide range of topics related to economic well-being—covering everything from income distribution to health care to macroeconomic sustainability. Providing new viewpoints on the economic well-being of Americans will increase the public’s understanding of economic trends and will improve the relevance of BEA’s data for policymaking.
This paper discusses the evolution of efforts to extend the national accounts, recent interest in expanded measures of economic well-being, the issues associated with the various approaches for better measuring well-being and sustainability, and BEA’s plans for its GDP and Beyond initiative.
Providing better measures of economic well-being, production, and sustainability is a long-standing issue, with roots tracing back to the early history of modern economic theory. Since the inception of the national accounts in the 1930s, these concerns have generated volumes of research on extending economic accounts beyond traditional measures like GDP. During the last several decades, attention has once again shifted to the broader deficiencies of GDP as a measure of economic well-being and sustainability. Since the early 2000s, several prominent organizations have commissioned broad studies of these inadequacies and approaches for addressing these gaps. More recently, researchers have taken an in-depth look at a variety of methods for measuring well-being. This long history of research provides a rich foundation from which to cultivate and produce supplemental statistics on economic well-being (table 1).
| Time period | Research |
|---|---|
| 1700s | Many of the forerunners of today’s national accounts examined the distribution of income. Early examples include the work of Boisguilbert (1707), Cantillon (1755), and Quesnay (1766). |
| 1800s | Spahr’s (1896) estimates reflected continued interest in the distribution of income. |
| 1930s | Kuznets (1934), who led the development of the U.S. national accounts (a major milestone in the measurement of economic well-being), pointed to the importance of the distribution of income. He also noted the significance of nonmarket and near-market activities that impact economic welfare and growth—such as household services, the depletion of natural resources, services of household durable goods, and the loss of leisure time. |
| 1940s | Friedman and others (1943) led NBER efforts to measure the distribution of income. |
| 1950s and 1960s | Abramovitz (1956), Fabricant (1954), Kendrick (1956 and 1961), Solow (1957), Jorgenson and Griliches (1967), and Denison (1962 and 1967) developed theoretical and empirical tools to extend the accounts in order to gain a better understanding of the sources of economic growth and hence welfare. In addition, the Department of Commerce OBE (1953) (BEA’s predecessor) and Fitzwilliams and Hargreaves (1964) produced distribution of income estimates until resource constraints—and the need to update the estimates—led to their discontinuation. Other researchers, such as Gordon (1968), indicated the need for improved measures of prices and inflation to more accurately reflect real output. |
| 1970s | Nordhaus and Tobin (1973), Eisner (1978), and Ruggles and Ruggles (1973) developed extended accounts to better track economic well-being and sustainability, such as the measure of economic welfare. Work by Gordon (1971 and 1978) highlighted the need for improved statistics on capital inputs and prices. |
| 1980s to present | BEA (as described in Landefeld, Moulton, Platt, and Villones 2010) published a collection of general and specialized research studies and developed prototype supplemental statistics on topics such as household production, human capital, travel and tourism, natural capital and the environment, oceans, arts and culture, outdoor recreation, health care, and international trade and investment. |
| 1980s and 1990s | Berndt and Triplett (1990), Hulten and Wykoff (1981), and researchers at BEA developed methods for improving statistics on capital inputs, prices, inflation, innovation, and real output to more accurately gauge productivity, growth, and standards of living. |
| 1999 | Nordhaus and Kokkelenberg (1999) reviewed and made recommendations on better ways to evaluate natural resources' contribution to economic production and welfare within a set of national accounts. |
| 2004 | Bosworth and Triplett (2004) assessed the role of the services sector in productivity growth in the mid-1990s, called out key productivity measurement issues, and emphasized the importance of improving national accounts measures of the services sector, productivity, and economic growth. |
| 2005 | Abraham and Mackie (2005) examined and made recommendations for preparing more robust indicators of the impacts of home production, human capital, education, health, the environment, and government and nonprofits within a set of national accounts. Corrado, Hulten, and Sichel (2005) presented an expanded national accounts framework for measuring intangible capital. |
| 2006 | Jorgenson, Landefeld, and Nordhaus (2006) presented a comprehensive framework and trial estimates for extending the national accounts to better reflect economic growth, well-being, and sustainability. |
| 2009 | Stiglitz, Sen, and Fitoussi (2009) discussed several measures of economic well-being, ranging from subjective well-being measures to means of adjusting conventional GDP statistics, including adding the distribution of income. Krueger and others (2009) discussed the pros and cons of subjective well-being measures and presented survey-based indicators of well-being. These measures were weighted by time use to produce a set of national well-being accounts. |
| 2014 | Jorgenson, Landefeld, and Schreyer (2014) expanded on past national accounts research to provide a better understanding of the distribution of economic growth and its effect on well-being, including evaluating the impacts of health care, human capital, and the environment. |
| 2016 | Jones and Klenow (2016) proposed an aggregate measure of economic well-being based on consumption, leisure, mortality, and inequality to address enduring criticisms of GDP as an indicator of welfare. Coyle (2016) renewed the long-standing debate on GDP as a measure of well-being. |
| 2017 | Jorgenson and Schreyer (2017) demonstrated how dimensions of individual and social well-being can be folded into the framework of the national accounts. |
| 2018 | Jorgenson (2018) laid out an integrated framework for improving the national accounts measures of both production and well-being. |
- BEA
- Bureau of Economic Analysis
- GDP
- Gross domestic product
- NBER
- National Bureau of Economic Research
- OBE
- Office of Business Economics
Despite this extensive body of research, countries generally have not included measures of economic well-being, like distribution of income statistics, as a standard part of their national accounts. But why is this the case? Perhaps it was because, for much of the post-World War II era, robust growth raised standards of living across the board and reduced inequality. As a result, the public’s interest in such measures was limited. The lack of progress may also reflect the problems associated with choosing appropriate well-being concepts and methods or with harmonizing alternate sources of data—for example, the difficulties in reconciling household survey data with tax and administrative data. Policymaking, therefore, has tended to focus on GDP per capita as a proxy for standards of living. For example, GDP per capita has become widely used in the allocation of development aid and loans around the world. And in the United States, GDP per capita is used to distribute federal funds to state and local governments.
More recently, however, economic developments have sparked renewed interest in better measures of economic well-being and the distribution and sustainability of economic growth.2 Major considerations include the following:
- The U.S. housing and financial crisis prompted questions on whether an expanded and more integrated set of national income and wealth accounts could have done a better job of informing policymakers of emerging risks.
- The resulting “Great Recession” and slow recovery triggered a review of the measured and unmeasured sources of economic growth.
- Rising health care costs have called into question the robustness of existing measures of medical care inflation and productivity used to guide public policy.
- Increasing globalization has highlighted the need for improved indicators of international trade for use in developing and monitoring trade and investment policies.
- Advancements in high-tech goods and services have intensified demands for more information on the importance of technology in today’s economy.
- Slow growth in middle-class incomes and the increasing concentration of income and wealth have heightened the need for more comprehensive statistics on the distribution of income. In addition, the COVID-19 crisis—poised to be one of the worst economic downturns since the Great Depression—has amplified the calls for distributional measures consistent with GDP to assess the impacts of economic changes at more granular household income levels.
- Growing concerns about the sustainability of economic growth are driving questions related to the following:
- The adequacy of overall saving and investment and the long-run impacts of investments in R&D, innovation, and human capital.
- The effects of budget and trade deficits on growth and employment.
- The consequences of the depletion of natural resources on the economy.
Over the last decade, researchers around the world have explored many avenues for providing answers about the well-being of everyday citizens. The most widely used measurement approaches fall into five broad categories: (1) updates to make the national accounts a better measure of economic well-being, (2) satellite accounts, (3) aggregate welfare measures, (4) subjective well-being measures, and (5) indexes of well-being indicators (table 2).
| Approach | Description | Examples |
|---|---|---|
| Updates to make the national accounts a better measure of economic well-being | Improved or repackaged statistics |
|
| Satellite accounts | Supplemental datasets that extend the scope of the national accounts without changing the official statistics |
|
| Aggregate welfare measures | Measures that combine components of the national accounts with other variables to derive summary statistics for a country’s overall well-being, following the principles of good economic measurement |
|
| Subjective well-being measures | Assessments of welfare that rely on self-reported evaluations of happiness or satisfaction |
|
| Indexes of well-being indicators | Indexes of economic and noneconomic variables that are judgmentally weighted as well as “dashboards” that do not attempt to weight the various dimensions or that leave the weighting to the users of the data |
|
- OECD
- Organisation for Economic Co-operation and Development
BEA, the government agency tasked with compiling the U.S. national accounts, has its own perspective to offer on well-being. As the noted welfare economist Pigou (1920) once commented:
National accounts should include elements that reflect economic welfare that can be brought directly or indirectly into relation with the measuring rod of money.
But he emphasized that “can” might mean anything from “can easily” to “can with violent straining.”
In 2018, BEA began to craft a formal plan for improving its data on economic well-being, growth, and sustainability. After reviewing U.S. and international efforts to measure well-being and consulting with its Advisory Committee, the Bureau established a set of criteria for targeting its efforts. These criteria seek to address Pigou’s admonition to fold well-being measures into the national accounts, while steering away from methods that require “violent straining,” and they include the following:
- How closely do possible new sets of statistics align with BEA’s mission and expertise? Why should BEA, rather than others, produce this information?
- How relevant and useful are these supplemental estimates to policymaking and the public’s understanding of key issues? What is their importance to customers, experts, business users, and decisionmakers at all levels of government?
- Are the available source data, methods, and theory consistent with those used in BEA’s core economic accounts? Do the supplemental estimates meet BEA’s standards for accuracy, timeliness, relevance, objectivity, and use of economic methods?
- What are the resource costs to begin regular production? What are benefits relative to other types of research?
- How successfully can BEA vet and roll out the alternative datasets? How often should these supplemental accounts be produced? What is the “low-hanging fruit” for which BEA can get the biggest “bang for the buck”?
In other words, any information that BEA provides on well-being should be consistent with the Bureau’s mission and expertise. Based on these criteria, the Bureau evaluated the various well-being measurement approaches and compiled an inventory of potential projects. In the end, BEA identified three methods that seem to be the best fits for the Bureau: (1) updates to make the national accounts a better measure of well-being, (2) satellite accounts, and (3) aggregate welfare measures. The next section first walks through all five broad approaches and then explains why each one is or is not appropriate for BEA.
Updates to make the national accounts a better measure of economic well-being
While GDP and GDP per capita were never designed to be comprehensive indicators of economic well-being, they are the best available measures of the market economy and are critical for informing policies meant to spur economic growth. Such growth is key to raising standards of living directly and indirectly, by making possible investments in health, education, and public infrastructure and by supporting aid to the disadvantaged. Over time, these investments and transfers have helped increase life expectancy, lower childhood mortality, provide universal education through primary and secondary school, reduce poverty, expand the provision of public services, like water and sanitation, and improve the U.S. housing supply.
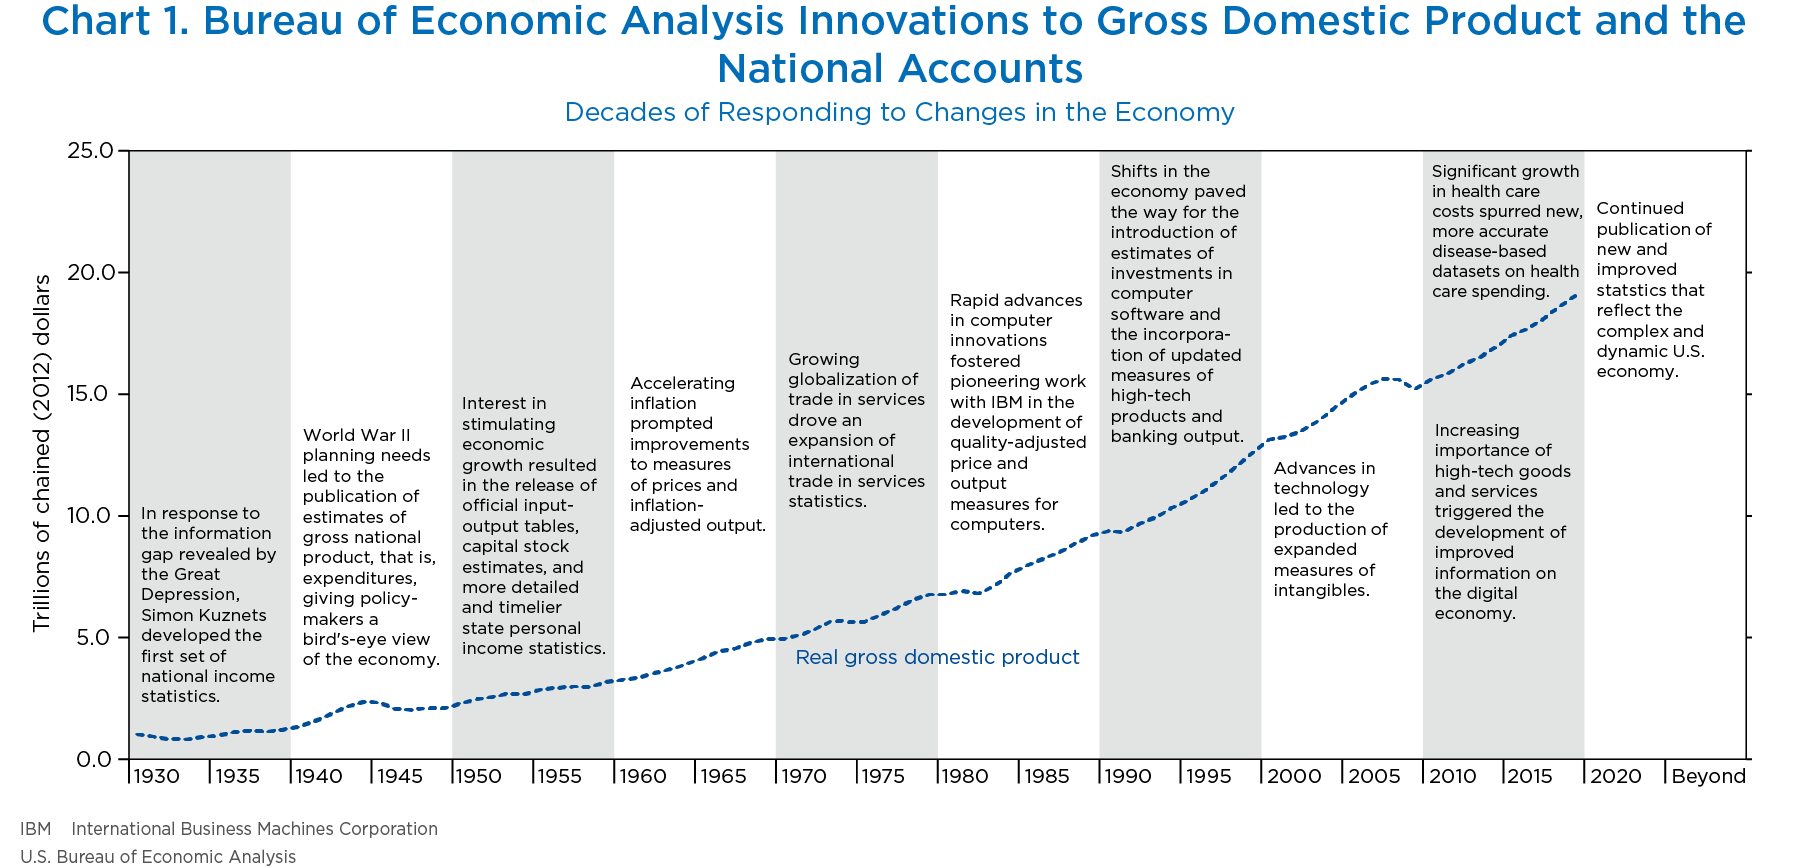
BEA’s core mission is to provide timely, accurate data needed to understand the U.S. economy. As such, the Bureau’s highest priority is updating the core GDP statistics to reflect shifts in the economy, including technological advancements, emerging production schemes, and rapidly evolving financial relationships. BEA has a long-standing record of instituting these types of improvements (chart 1).
[Click chart to expand]
The first two goals in BEA’s strategic plan are structured to ensure that the Bureau continues to fulfill its mission by (1) improving the accuracy of existing statistics and (2) developing new and expanded products to measure a dynamic economy.3 Efforts that both refine core account measures of production and make the national accounts a better measure of economic well-being align closely with these goals. Projects that fall under this approach include improving measures of prices and real output, better capturing the impacts of “free” goods and services (like Facebook posts and Google searches), and repackaging existing statistics to highlight economic well-being and growth.
Satellite accounts
One roadblock to making the national accounts a better measure of well-being is that many of the variables to be measured, such as human capital, household production, and natural resources, are likely very large in magnitude. In addition, there is significant uncertainty regarding the concepts and methods for producing such estimates. Incorporating these types of statistics into the core national accounts could moderate or swamp business cycle movements and obscure trends in the market sector of the economy. This could significantly reduce the national accounts’ usefulness for informing fiscal, monetary, and growth policies.
For example, adding in Christian’s (2010) measures of human capital would expand the capital stock in 2006 by more than sixteenfold (chart 2). Including estimates of household production would boost the value of measured GDP by 25 to 40 percent, depending on the time period and methods used. (See, for example, Landefeld, Fraumeni, and Vojtech (2009) and Kanal and Kornegay (2019) (chart 3).) And incorporating Landefeld, Carson, and others (1994b) estimates of the value of mineral resources would add between 3–7 percent to the productive stock, depending on the chosen measurement approach (chart 4).

[Click chart to expand]

[Click chart to expand]

[Click chart to expand]
Many of the problems associated with valuing near-market and nonmarket goods and services can be addressed by developing what are sometimes called “satellite” accounts. Such accounts provide supplemental datasets that are consistent with the core GDP statistics, without reducing the usefulness of those measures. For example, satellite accounts can provide more information on the distribution of production and income, or they can present estimates based on alternative concepts or with an expanded scope. Because these supplemental estimates are consistent with the existing accounts, researchers can still take advantage of the extensive analytical toolkit developed around the national accounts. These tools range from macroeconomic statistical techniques to industry, regional, and international impact analyses.
BEA has a long history of using satellite accounts to introduce supplemental data products. Over the years, the Bureau has released satellite accounts for arts and culture, travel and tourism, R&D, health care, household production, and outdoor recreation. The Bureau is well positioned to leverage this framework to introduce, update, and extend statistics on various dimensions of economic well-being.
Aggregate welfare measures
One of the most useful aspects of the national accounts is that they provide summary statistics of economic activity (like GDP or gross national income). These measures show the combined impacts of economic and social policies and demonstrate the effects of external shocks, like pandemics and natural disasters, on GDP and its components.
As noted above, many studies evaluate the relationship between national accounts aggregates and economic well-being. Much of this literature has focused on bridging gaps in the existing national accounts, such as incorporating measures of the distribution of income or adding the value of human capital or government services. What has not been so thoroughly explored by national accounts agencies is how to merge information from an expanded set of economic accounts into a measure of aggregate welfare.
Fortunately, to guide the way, there is another rich body of research on estimating aggregate social welfare.4 These measures combine components of the national accounts with other variables to derive estimates for a country’s overall economic well-being, following the principles of microeconomic and macroeconomic welfare theory. Researchers have studied how to combine well-being, or utility, across individuals and how to measure the utility derived from different market baskets of goods and services—or from work and leisure—in a world of changing prices, quantities, and distributions of income. For example, Jorgenson and Slesnick (2014) use a model of a representative consumer, the distribution of income, and consumer spending to aggregate welfare across individuals and provide a theoretically founded, market-based measure of the standard of living.
Because these statistics are compiled using the comprehensive economic theory and consistent accounting practices underpinning the national accounts, producing alternative measures of aggregate welfare fits within BEA’s mission and expertise.
Subjective well-being measures
Some researchers have proposed measuring households’ subjective well-being, or happiness, through direct surveys by asking questions like “How satisfied are you right now?” Conceptually, this approach goes beyond economic well-being and attempts to assess overall welfare, which is a function of both economic and noneconomic factors.
There are several problems with this approach. First, subjective well-being measures do not seem to vary much over time; instead, they tend to trend toward some common level of happiness or well-being. For example, happiness indexes show little change since World War II, especially compared with the growth in real GDP per capita (chart 5).

[Click chart to expand]
This phenomenon exists despite major steps forward in standards of living, like indoor plumbing, electricity, better health care, longer life expectancy, shorter work weeks and more leisure time, higher levels of homeownership, and modern conveniences (such as household appliances and air conditioning).
In addition, levels of happiness seem to adapt quickly to negative events. For instance, around the time of the U.S. financial crisis in 2008, happiness as measured by the Gallup Well-Being Index dropped precipitously, but 1 year later, it was back to its precrisis level. In comparison, the U.S. unemployment rate doubled during the Great Recession and did not recover until 2016 (chart 6). Household wealth, including the value of homes, stocks, and other assets, took years to recover.

[Click chart to expand]
For more information on the effects of changes in income on happiness, see “Does Having More Money Make You Happier: A Look at the Research.”
Measures of subjective well-being also seem to vary from nation to nation because of cultural and attitudinal differences, which makes cross-country comparisons difficult.
Perhaps most importantly for BEA, subjective well-being measures do not fit into the framework of the national accounts. One of the greatest strengths of BEA’s economic accounts is that they are grounded in economic theory and provide comprehensive and consistent datasets across geographies, industries, and factors of production. Subjective measures of well-being lack the structure of the national accounts, reminiscent of Koopman’s (1947) much cited 1940s critique of business cycle indicators and aggregates that qualify as “measurement without theory.” Subjective well-being measures also seem to fall into Pigou’s “violent straining” category—they stretch beyond BEA’s scope and mission.
Indexes of well-being indicators
Several recent studies have recommended that countries develop indexes of well-being indicators (such as the Organisation for Economic Co-operation and Development (OECD) Better Life Index or the United Nations Human Development Indexes) to better measure various components of welfare.5
These indicators are sometimes called “dashboards”—the notion being that no single measure can adequately capture the many different aspects of well-being. (Just as a car not only has a speedometer, it has a dashboard of other necessary meters, such as a fuel gauge, battery charge alert, and engine temperature warning light.) The difficulty is that these dashboards tend to use a mix of physical measures (such as life expectancy and childhood mortality) and economic indicators and are often aggregated with simple averages or subjectively determined weights. For an example of the types of indicators included in these dashboards, see “Details of the United Nations Human Development Indexes.”
Compiling these types of dashboards presents significant problems for BEA. Nonmarket variables like those often featured in indexes of well-being indicators do not fall in line with BEA’s mission. BEA economists use market prices and volumes to measure GDP and other economic aggregates and have no special expertise in deciding the appropriate weights to combine indicators such as education and life expectancy with gross national income per capita. In some sense, such indexes can be best described as measurement without theory, as noted above.
Through discussions with BEA staff, its Advisory Committee, and outside experts, the Bureau has laid out an ambitious, but achievable, plan to provide new insights into economic well-being. For more information on the process of developing this initiative, see “BEA’s GDP and Beyond Initiative: Setting the Agenda.” 6
- Short-term priorities. The short-term priorities include (1) compiling a set of measures of economic well-being and growth based on existing statistics from BEA’s core accounts and data from statistical agency partners and (2) publishing estimates of the distribution of personal income on a regular basis.
- Ongoing work. BEA will continue to place high priority on providing better measures of economic well-being by enhancing its core accounts, including improving the prices of high-tech goods and services. In addition, the Bureau will update, improve, and expand its catalog of supplemental statistics, including integrated accounts for wealth, productivity, and industry-level production; satellite accounts for health care, household production, arts and culture, and outdoor recreation; and trade in value-added statistics used to compile global value chains.
- Longer term projects. BEA will evaluate its role in the broader discussion of well-being. Longer term priorities for which further research is required include researching the impact of “free” digital goods and services, measures of aggregate economic welfare, human capital statistics, and natural resource and environmental capital accounts.
The next section provides details on specific projects that are a part of BEA’s GDP and Beyond initiative.
Short-term priorities
Measures of economic well-being and growth
As part of the first phase of its GDP and Beyond initiative, BEA is repackaging statistics from its core accounts along with selected data from statistical agency partners in ways that provide new perspectives on economic well-being and the distribution and long-term growth of the economy. These measures include the following:
- Economic well-being measures, like GDP per capita and employment trends.
- Distribution statistics, such as real GDP growth by industry, real personal income per capita by state, and the distribution of personal income across households.
- Long-term growth indicators, including trade balances, U.S. budget deficits over time, and trends in U.S. business cycles.
This list touches on some of Americans’ biggest concerns. According to Gallup, over the years, economic issues have made the top of the list of the most important problems confronting U.S. households. While opinions vary throughout the business cycle, Americans tend to be most worried about the economy in general, the federal budget deficit, unemployment/jobs, the gap between rich and poor, taxes, wage issues, high cost of living/inflation, foreign trade/trade deficit, corporate corruption, and fuel/oil prices.
Most of the data for the measures of economic well-being and growth come from BEA’s GDP and related international, industry, and regional accounts. Because these measures are components of the national accounts, they can be understood in the context of the powerful set of macroeconomic tools that have been developed and refined over the last century. The national accounts framework and analytical tools are used in the United States and around the world to better understand, benchmark, and manage economic growth.
The measures of economic well-being and growth are presented in a consistent framework to make them more relevant and easier to understand:
- The measures are mainly shown relative to other indicators. For example, converting data to a per capita basis or presenting saving and growth rates, rather than the total levels of saving or GDP, helps users to see the relative importance of the variables and the underlying trends more clearly.
- The longest available time series are used, except where the scale needed for long-term comparisons would obscure important, more recent developments.
- The business cycle dates are based on turning points designated by the National Bureau of Economic Research.
- For consistency, growth rates are calculated from business cycle peak to peak or to the most recent period, except as noted. For example, the use of 1973 as the beginning of the productivity slowdown is consistent with the period used by the Bureau of Labor Statistics (BLS) and BEA, the official statistical agencies that produce the data.
Spotlighting data that are already included in BEA’s datasets or that can easily be derived from existing statistics provides an expanded look at trends in economic well-being and the drivers of economic growth. For more information, see “BEA’s Prototype Measures of Economic Well-Being and Growth.”
Distribution of income
Headline national accounts measures—like GDP, gross domestic income, and personal income—provide a consistent and accurate high-level view of the state of the economy; however, these aggregates do not give an indication of how different households share in overall economic growth. Breakdowns of income, consumption, and wealth among households are some of the most important supplements to existing national accounts, as they shine a light on issues related to well-being and inequality. While an assortment of distributional measures exists for the United States, they differ considerably in terms of income concepts, compilation methods, and units of measurement (see chart 7 for a comparison of three sets of median income statistics).7 In addition, these datasets are not fully consistent with a national accounting framework.
To begin filling this gap, BEA is compiling a new dataset that takes one of its primary economic indicators—total U.S. personal income—and measures how it is distributed across households in different income groups. Personal income provides a comprehensive, accurate, and relevant measure from which to develop distributional estimates. In addition to cash incomes received by households, personal income includes noncash components that are important to economic well-being—things like pension and health benefits, unemployment insurance disbursements, and social security payments—but excludes capital gains. Furthermore, personal income is based on a variety of high-quality data sources, including business, nonprofit, and government accounting records.

[Click chart to expand]
This effort builds on over a decade of BEA research and innovation to develop a consistent time series by bringing in new sources of information, including demographic surveys, aggregated income tax filings, and administrative records. These data are controlled to the national accounts’ personal income totals and tested to ensure that they conform to BEA’s standards for accuracy, timeliness, and relevance.
BEA recently released prototype estimates for the distribution of personal income and its components and other inequality metrics for 2007–2016. According to an analysis of these statistics by Fixler, Gindelsky, and Johnson (2020), overall, real personal income grew about 18 percent from 2007 to 2016, with growth in every income quintile. Over the period, the income share of the top 20 percent of households grew slightly (by about 1 percentage point), with offsetting decreases spread across the shares of the bottom 80 percent; however, inequality—as measured by Gini coefficients and top income shares—increased very little.8 For more information, see table 3 and charts 8 and 9.
| 2007 | 2016 | 2007–2016 | |||
|---|---|---|---|---|---|
| Levels | Changes | Percent changes | Average percent changes | ||
| Distribution of real personal income by quintile | |||||
| Trillions of chained (2012) dollars: | |||||
| Personal income | 13.1 | 15.5 | 2.4 | 17.9 | 1.8 |
| 0–20% | 0.8 | 0.9 | 0.1 | 15.5 | 1.6 |
| 20%–40% | 1.3 | 1.5 | 0.2 | 14.0 | 1.5 |
| 40%–60% | 1.8 | 2.1 | 0.3 | 15.2 | 1.6 |
| 60%–80% | 2.6 | 3.0 | 0.4 | 16.4 | 1.7 |
| 80%–100% | 6.7 | 8.1 | 1.4 | 20.3 | 2.1 |
| 80%–99% | 5.0 | 6.1 | 1.1 | 21.3 | 2.2 |
| Top 1% | 1.7 | 2.0 | 0.3 | 17.4 | 1.8 |
| Top 5% | 3.4 | 4.2 | 0.7 | 21.2 | 2.2 |
| Percentage shares: | |||||
| Personal income | 100.0% | 100.0% | … | … | … |
| 0–20% | 5.7% | 5.6% | −0.1% | … | … |
| 20%–40% | 10.0% | 9.6% | −0.3% | … | … |
| 40%–60% | 13.6% | 13.3% | −0.3% | … | … |
| 60%–80% | 19.5% | 19.3% | −0.3% | … | … |
| 80%–100% | 51.2% | 52.2% | 1.0% | … | … |
| 80%–99% | 38.5% | 39.5% | 1.1% | … | … |
| Top 1% | 12.7% | 12.6% | −0.1% | … | … |
| Top 5% | 26.2% | 27.0% | 0.7% | … | … |
| Other inequality metrics | |||||
| Chained (2012) dollars: | |||||
| Equivalized median personal income | 50,467 | 53,586 | 3,119 | 6.2 | 0.7 |
| GDP per capita | 51,794 | 54,733 | 2,939 | 5.7 | 0.6 |
| 90/10 share | 5.762 | 5.559 | −0.203 | … | … |
| Gini index | 0.442 | 0.445 | 0.002 | … | … |
Source. Fixler, Gindelsky, and Johnson (2020)

[Click chart to expand]

[Click chart to expand]
An important feature of this new data product is that it provides measures of real median equivalized personal income—that is, the inflation-adjusted total income received by the “middle” income household (adjusted for household size using the square root of the number of people per household), whose income is below 50 percent of households and above the other 50 percent of households.
Real GDP per capita and real median equivalized personal income provide two different points of view on the impact of economic growth. Real GDP per capita spreads total production across the entire population equally. So, in times of rising inequality—when an increasing share of income is going to upper income groups—estimates of GDP per capita tend to overstate the income and economic well-being of the average household. Real median equivalized personal income provides a more accurate gauge of how most households are faring economically. In addition, real median personal income is a better measure of how the economic “pie” is divided up because it focuses on how income accrues to households rather than focusing on GDP, which is a measure of production.
While a longer time span may be necessary to draw broader conclusions about long-run shifts in inequality, for 2007–2016, real median personal income grew 0.7 percent per year, similar to the growth in real GDP per capita of 0.6 percent per year (chart 10).
After gathering feedback on the prototype measures and refining the underlying source data and estimation methods, BEA will begin publishing income distribution statistics regularly, starting in December 2020. Looking to the future, BEA will expand on this work, including exploring possibilities for producing other distributional statistics—like for consumption.
Providing distributional information is probably the most important means of closing the gap between the performance of GDP and most households’ perceptions of their own economic well-being—addressing one of the main critiques of GDP. By ensuring the ongoing availability of these data, this project also helps meet public and private demands for better tools to target resources and steer economic development.

[Click chart to expand]
Ongoing work
Prices of high-tech goods and services
The information technology (IT) sector is a significant and dynamic part of the economy. In 2013, the value added of industries that produce information and communication technologies crossed the $1 trillion mark for the first time, accounting for about 6 percent of GDP (see BEA industry table “Value Added by Industry”). The continuous introduction of new products (like cloud services) and the rapid improvement of existing devices (like cell phones) complicate price measurement for the IT sector. Accurate price measures should reflect the changes in the quality of goods and services over time, a task that is made more difficult when these products are rapidly evolving.
Over the last few years, BEA has launched several projects aimed at improving the prices of high-tech goods and services—an important part of the Bureau’s plan to make the national accounts a better measure of economic well-being. In 2018 and 2019, BEA partnered with colleagues from BLS and the Federal Reserve Board (FRB) to introduce new quality-adjusted prices for software, medical equipment, and cell phones. Moving forward, BEA will study new price indexes for cloud computing, ridesharing services, and telecommunications.
Information gained from this research will help BEA identify potential improvements for the Bureau’s official estimates of prices and overall technology spending and will provide fresh insights into the well-being of consumers.
Integrated accounts for wealth, productivity, and industry-level production
In the United States, the statistical system is highly decentralized, so components of the national accounts and other key economic indicators are produced by various agencies across the government. For example, FRB estimates the nation’s stock of wealth, while BEA publishes the related statistics on investment and international financial flows. Similarly, BLS provides information on productivity, and BEA produces the associated data for industry production, investment, and stocks of tangible capital.
Over time, as U.S. statistical agencies developed their data products independently, inconsistencies in concepts, methods, and classifications arose. Because of these differences, data users face a more difficult task when trying to synthesize information from separate sets of statistics. For example, FRB and BEA datasets offered differing conclusions about the sources of the pickup in U.S. productivity in the early 2000s, so the “early warnings” of the financial and real estate crises—and the role these sectors played in the Great Recession—were not generally understood until after the downturn in the economy.
In recognition of the need to integrate U.S. economic statistics, BEA joined forces with FRB, BLS, and the broader research community to develop several sets of integrated accounts. The BEA-FRB integrated macroeconomic accounts combine data on production, income, financial transactions, and net worth to present a comprehensive picture of the U.S. economy. The integrated BEA GDP-BLS productivity account harmonizes GDP and productivity data to provide a better understanding of the sources of economic growth. The integrated industry-level production account traces aggregate GDP growth from its industry origins to changes in factors of production, including capital, labor, intermediate inputs, and multifactor productivity. BEA will continue working with other statistical agencies to improve and extend these accounts and to find new ways of integrating their datasets to call out the drivers of economic growth and well-being.
Health care statistics
Health care spending has more than doubled in the United States over the last 15 years and, as of 2017, accounted for more than 14 percent of GDP (chart 11). Issues surrounding medical care have also emerged as one of today’s most pressing public policy challenges. In 2015, BEA began publishing a Health Care Satellite Account to better track spending trends and treatment prices. These supplemental statistics measure U.S. health care spending by the diseases being treated (for example, cancer or diabetes) instead of by the types of goods and services purchased (such as doctors’ office visits or prescription drugs). The satellite account, expanded in 2019, combines multiple data sources—including health survey data and microdata covering millions of enrollees and billions of medical claims—to provide an in-depth look at spending for over 250 specific medical conditions. These supplemental datasets give policymakers, researchers, and the public another way of understanding the economics of health care.

[Click chart to expand]
Over the next few years, BEA will continue to improve its data offerings on the health care sector by (1) accelerating the release of annual statistics for the Health Care Satellite Account, (2) closing coverage gaps for the Medicaid population and nursing home spending, (3) producing estimates that link spending by type of disease to spending by type of health care product, (4) improving regional prices, and (5) laying groundwork for developing quality-adjusted medical care price indexes. These improvements mark the next steps toward BEA’s goal of developing comprehensive health care spending estimates.
Household Production Satellite Account
BEA’s Household Production Satellite Account measures the value of unpaid work done in the home—things like cooking, cleaning, and caring for children. Such activities are not included in BEA’s core statistics, because they are not tracked through marketplace transactions. This satellite account provides valuable insights into the impact of household production and the size and growth of total market and nonmarket production. These estimates, along with BLS time use data and BEA extended input-output tables, can be used to answer key questions about childcare and other public policy issues. This project is part of BEA’s ongoing efforts to measure economic value outside of the market economy.
Other satellite accounts
BEA plans to develop, update, and expand satellite accounts for several other sectors, including the following:
- Arts and culture. BEA will continue to release statistics that show the role of arts and culture at the national level and break out those impacts on a state-by-state basis.
- Outdoor recreation. BEA will continue to publish Outdoor Recreation Satellite Account data for the nation as a whole—and parsed out by state—and will investigate the feasibility of estimating outdoor recreation activities prior to 2012, the current start year for the account.
- Digital economy. BEA will expand the information it provides on the digital economy—including measuring the peer-to-peer services of the sharing economy, tracing the flows of digital goods and services around the globe, and preparing prototype estimates for data as an asset—with the goal of developing a comprehensive Digital Economy Satellite Account.
- Oceans. BEA will coordinate with the National Oceanic and Atmospheric Administration (NOAA) to develop new tools for understanding the economic importance of ocean-related activities to the U.S. economy.
Satellite accounts like these provide public and private decisionmakers with additional information on specific activities or sectors of the economy and highlight different facets of economic well-being and growth.
Global value chains
Over the last 50 years, total international trade (that is, exports plus imports) has increased significantly, rising from about 10 percent of GDP in 1969 to over 25 percent in 2019 (see National Income and Product Accounts table 1.1.5). The world’s economies are becoming increasingly interconnected, as more and more companies utilize highly complex global networks to produce and distribute their products. The goods and services that consumers and businesses purchase are often composed of intellectual property, labor, materials, and other inputs from various countries around the world. The value that is created at each step in these global value chains, however, is not always apparent from conventional measures of international trade that capture the gross flows of goods and services as they move around the globe. For example, the costs of intermediate goods and services are often recorded multiple times as these products cross over borders in the global production process.
These problems do not distort the macroeconomic picture of trade balances, since any double counting cancels out in the aggregates; however, they can misdirect public opinion and reduce the usefulness of bilateral data for tax, regulatory, and international trade and investment policies. For a look at specific issues associated with traditional trade measures and how trade in value-added statistics could address these concerns, see “Issues in Trade Statistics: A Tale of Two Case Studies.”
To address concerns associated with existing trade statistics, BEA has begun developing a set of supplemental accounts that tracks the value added at each stage of the global production process. Over the last few years, BEA has made notable progress in this area. The Bureau now publishes tables using the framework recommended by international guidelines to provide an integrated presentation of the total supply of goods and services from both domestic and foreign producers and the use of that supply across the U.S. economy. These “supply-use” tables are an essential building block in analyzing global value chains.
Moving forward, BEA will continue to collaborate with statistical agencies around the world to improve data on international trade relationships. The Bureau will also work toward publishing “extended” supply-use tables that show how the activities of multinational and nonmultinational firms differ and how these differences impact the economies in which they operate. Finally, BEA will develop more detailed statistics by linking interrelated datasets from trading partners to track the flows of goods and services between countries.
These improved datasets will provide users with a more complete, accurate, and nuanced picture of the impacts of globalization on the U.S. economy and will open new pathways for exploring the relationships between international trade and economic well-being.
Longer term projects
“Free” digital media and internet services
The internet has fundamentally changed the way households consume entertainment and acquire information. Over the last two decades, consumers have downloaded increasing amounts of “free” content (such as Facebook apps, Google searches, and internet games), which are largely supported by advertising revenue or provided in exchange for personal data.
Currently, the value consumers derive from posting on social media or playing games online is not directly included in GDP. Instead, such content may be treated as an input to the advertising industry, and advertising, in turn, is treated as an input to the production of other types of goods and services. This method assumes that the costs of these inputs are embedded in the market prices of the goods and services being advertised; however, the additional value to consumers of the entertainment and other internet services is not captured.
BEA will continue to research ways to measure “free” digital media and Internet services. Estimating the value of this content will pave the way for alternative measures of GDP, productivity, and well-being, allowing government officials, business executives, and consumers to track the growth and importance of the digital economy better and to identify shifting business models more quickly.
Aggregate welfare measures
BEA will investigate the possibilities for producing a supplemental measure of aggregate economic well-being.
Since the earliest days of the national accounts, many noted economists, from Simon Kuznets (1934) to Kenneth Arrow (1951), decided that such issues were either too difficult, or theoretically impossible, to resolve (hence Arrow’s “impossibility theorem” for aggregating individual preferences into social preferences). Other researchers have shown, however, that under certain relatively reasonable assumptions, one can produce a measure of aggregate economic welfare from existing national accounts measures of market goods and services.
BEA will review a variety of measurement approaches based on this research. This may include aggregating the welfare of individuals using the Jorgenson and Slesnick (2014) concept of a representative, utility-maximizing consumer or creating summary statistics for economic well-being based on the Jones and Klenow (2016) welfare model that combines consumption, leisure, mortality, and inequality.
There are pros and cons to these techniques. For instance, most of the methods utilize existing data sources, requiring no new data collection—meaning that BEA can receive a good return on its investment for these efforts. On the flipside, a major obstacle to regularly producing such statistics is the potential lack of timely source data. Certain critical information may only be available with considerable lags, limiting the usefulness of these measures for policymaking.
While there is broad support, especially from the academic community, for BEA to publish measures of aggregate welfare, the Bureau must overcome significant conceptual and source data challenges before moving forward and, once these difficulties are ironed out, must clearly articulate its methods and assumptions to the public.
Human capital statistics
Developing human capital statistics is an important extension to BEA’s core accounts—both to better account for the sources of economic growth and to more accurately measure economic well-being. While considerable research has been conducted in this area, there remain significant uncertainties regarding the assumptions and methods to be used in producing estimates of human capital. This includes questions about how innate ability, technological change, and education relate to differences in compensation, human capital, productivity, and economic growth. As a result of these outstanding issues, BEA has made this a longer term priority in need of further research.
Natural resource and environmental (natural capital) accounts
Natural and environmental resources are important inputs into the production of a vast array of products—things like oil for manufacturing; iron ore for steel production; trees for lumber and construction; and clean water for fishing, agriculture, and electric power generation. Yet, unlike plant and equipment, the national accounts do not record the depletion (that is, the depreciation) of these natural assets as they are used up in production. Nor do the accounts record the value of additions to the stocks of these assets through investments in mineral, oil, and gas exploration and drilling; reforestation; and water quality maintenance or improvement.
Conceptually, nonproduced assets, such as trees and water, should be treated symmetrically to produced assets, such as plant and equipment, with respect to investment, depreciation, and the value of capital stocks. Since transactions associated with these nonproduced assets often are not recorded as market activity, they are more difficult to measure than produced assets. Often, environmental resources are simply regarded as free gifts of nature, despite the obvious economic value of exploration and drilling, reforestation, and pollution abatement and control efforts.
Over time, there has been growing interest in better accounting for natural and environmental resources. In the 1980s, BEA produced a set of Integrated Economic and Environmental Satellite Accounts, which were a modified version of the United Nations’ System of Environmental-Economic Accounts (SEEA).9 These accounts were designed to answer questions such as these: What is the sustainable growth rate for the U.S. economy—considering the depreciation of plant, equipment, and natural resources? How efficient is the use of natural resources in production? How effective are different environmental programs in reducing pollutants?
More recently, attention has turned toward the development of natural capital accounts, which focus on a subset of the SEEA accounts for land, water, and ecosystems. These accounts are being constructed by an interdisciplinary team of scientists and economists, with representatives from BEA, NOAA, the Department of the Interior, and the World Bank.
In addition, a host of more recent developments—from technological innovations that have dramatically reduced natural gas prices, to heightened interest in alternative energy sources like solar power, to fluctuations in petroleum prices—underscore the need for supplemental statistics that better monitor the importance of natural resources to economic growth and sustainability. BEA will continue to examine these developments and to support efforts in the United States and around the world aimed at building natural resource and environmental capital accounts.
Through its GDP and Beyond initiative, BEA will harness the Bureau’s extensive statistical resources and expertise to answer the call for insights into the well-being of the American public. BEA will tackle the challenges of measuring economic well-being in three phases—through short-term priorities, ongoing work, and longer term projects.
BEA has started to achieve early milestones for this initiative. In March 2020, the Bureau released a set of prototype measures of economic well-being and growth and prototype estimates of the distribution of personal income. BEA is continuously exploring ways to improve the core GDP accounts, both as a measure of market production and as an indicator of economic well-being and long-term growth, including researching the prices of high-tech goods and services. In addition, the Bureau is updating and expanding its integrated accounts of wealth, productivity, and industry-level production as well as its satellite accounts for sectors like arts and culture, outdoor recreation, health care, and household production. Looking to the future, BEA will turn its attention to longer term projects that require additional research and resources, including valuing “free” digital services, testing alternative aggregate welfare measures, and estimating human capital.
This initiative will provide new perspectives on well-being over the next few months and in the years to come, equipping government officials, business executives, researchers, and households with a broader toolkit to guide critical policy, investment, and spending decisions.
Abraham, Katherine G. and Christopher Mackie, eds. 2005. Beyond the Market: Designing Nonmarket Accounts for the United States. Washington, DC: National Academies Press, for the National Research Council.
Abramovitz, Moses. 1956. “Resources and Output Trends in the U.S. since 1870.” American Economic Review 46 (May): 5–23.
Arrow, Kenneth J. 1951. Social Choice and Individual Values. New York, NY: John Wiley & Sons, Inc.
Berndt, Ernst R., and Jack E. Triplett, eds. 1990. Fifty Years of Economic Measurement: The Jubilee of the Conference on Research in Income and Wealth. Chicago, IL: University of Chicago Press, for the National Bureau of Economic Research.
Boisguilbert, Pierre le Pesant, sieur de. 1707. Dissertation sur la Nature des Richesses.
Canadian Index of Wellbeing. 2016. How Are Canadians Really Doing? The 2016 CIW National Report. Waterloo, ON: Canadian Index of Wellbeing and University of Waterloo.
Cantillon, Richard. 1755. Essai sur la Nature du Commerce en General.
Carson, Carol S. 1975. “The History of the United States National Income and Product Accounts: The Development of an Analytical Tool.” Review of Income and Wealth 21 (June): 153–181.
Christian, Michael S. 2010. “Human Capital Accounting in the United States, 1994–2006.” Survey of Current Business 90 (June).
Congressional Budget Office (CBO). 2019. The Distribution of Household Income, 2016. Washington, DC: CBO, July.
Corrado, Carol, Charles R. Hulten, and Daniel E. Sichel. 2005. “Measuring Capital and Technology: An Expanded Framework.” In Measuring Capital in the New Economy, edited by Carol Corrado, John Haltiwanger, and Daniel E. Sichel, 11–46. Chicago, IL: University of Chicago Press, for the National Bureau of Economic Research.
Corrado, Carol, Kevin Fox, Peter Goodridge, Jonathan Haskel, Cecilia Jona-Lasinio, Daniel Sichel, and Stian Westlake. 2017. “Improving GDP: Demolishing, Repointing, or Extending?” Indigo Prize entry.
Coyle, Diane. 2016. GDP: A Brief but Affectionate History. Princeton, NJ: Princeton University Press.
Deaton, Angus, and Daniel Kahneman. 2010. “High income improves evaluation of life but not emotional well-being.” Proceedings of the National Academy of Sciences of the United States of America 107 (September): 16489–16493.
Dedrick, Jason, Greg Linden, and Kenneth L. Kraemer. 2018. “We estimate China only makes $8.46 from an iPhone—and that’s why Trump’s trade war is futile.” The Conversation (July 6).
Denison, Edward F. 1962. “The Sources of Economic Growth in the United States and the Alternatives Before Us.” The Economic Journal 72 (December): 935–938.
Denison, Edward F. 1967. Why Growth Rates Differ. Washington, DC: The Brookings Institution.
Easterlin, Richard. 1974. “Does Economic Growth Improve the Human Lot? Some Empirical Evidence.” In Nations and Households in Economic Growth: Essays in Honor of Moses Abramovitz, edited by Paul A. David and Melvin W. Reder, 89–125. New York, NY: Academic Press.
Eisner, Robert. 1978. “Total Incomes in the United States, 1959 and 1969.” Review of Income and Wealth 24: 41–70.
Fabricant, Solomon. 1954. “Economic Progress and Economic Change.” In 34th Annual Report, National Bureau of Economic Research, edited by Solomon Fabricant, 1–97. New York, NY: National Bureau of Economic Research.
Feenstra, Robert C., and Akira Sasahara. 2017. “The ’China Shock,’ Exports, and U.S. Employment: A Global Input-Output Analysis.” Working paper no. 24022. Cambridge, MA: National Bureau of Economic Research, November 2017.
Fixler, Dennis, Marina Gindelsky, and David Johnson. 2020. “Measuring Inequality in the National Accounts.” Working paper no. WP2020-3. Suitland, MD: Bureau of Economic Analysis, March.
Fitzwilliams, Jeannette M., and May V. Hargreaves. 1964. “Size Distribution of Income in 1963.” Survey of Current Business 44 (April): 3–11.
Friedman, Milton S., Dorothy Brady, Clark Warburton, and C. Lowell Harris. 1943. Income Size Distributions: Part I and Part II. Studies in Income and Wealth. Conference on Research in Income and Wealth, vol 5. New York, NY: National Bureau of Economic Research.
Gallup, Inc. “In Depth: Topics A to Z—Most Important Problem”; https://news.gallup.com/poll/1675/Most-Important-Problem.aspx (April 17, 2020).
Gordon, Robert J. 1968. “$45 Billion of U.S. Private Investment Has Been Mislaid.” American Economic Review 59 (November): 221–238.
Gordon, Robert J. 1971. “Measurement Bias in Price Indexes for Capital Goods.” Review of Income and Wealth 17 (June).
Gordon, Robert J. 1978. “The Use of Unit Values to Measure Deviations of Transaction Prices from List Prices.” Review of Income and Wealth 19 (September).
Hulten, Charles R., and Frank C. Wykoff. 1981. “The Estimation of Economic Depreciation Using Vintage Asset Prices: An Application of the Box-Cox Power Transformation.” Journal of Econometrics 15 (April): 367–396.
Jones, Charles I., and Peter J. Klenow. 2016. “Beyond GDP? Welfare Across Countries and Time.” American Economic Review 106 (September): 2426–457.
Jorgenson, Dale W. 1997. Welfare Volume 2: Measuring Social Welfare: xi–xxvii. Cambridge, MA: MIT Press.
Jorgenson, Dale W. 2018. “Production and Welfare: Progress in Economic Measurement,” Journal of Economic Literature 56 (September): 867–919.
Jorgenson, Dale W., and Zvi Griliches. 1967. “The Explanation of Productivity Change.” Review of Economic Studies 99: 249–280.
Jorgenson, Dale W., and Zvi Griliches. 1972. “Issues in Growth Accounting: A Reply to Edward F. Dennison.” Survey of Current Business 52 (May): 65–94.
Jorgenson, Dale W., J. Steven Landefeld, and William D. Nordhaus, eds. 2006. A New Architecture for the U.S. National Accounts. Chicago, IL: University of Chicago Press, for the National Bureau of Economic Research.
Jorgenson, Dale W., J. Steven Landefeld, and Paul Schreyer. 2014. Measuring Economic Sustainability and Progress. Chicago, IL: University of Chicago Press, for the National Bureau of Economic Research.
Jorgenson, Dale W., and Paul Schreyer. 2017. “Measuring Individual Economic Well-Being and Social Welfare within the Framework of the System of National Accounts.” Review of Income and Wealth 63 (November): S460–S477.
Jorgenson, Dale W., and Daniel T. Slesnick. 2014. “Measuring Social Welfare in the National Accounts.” Eurostat Review on National Accounts and Macroeconomic Indicators (EURONA) 2 (1): 39–58.
Kanal, Danit, and Joseph Ted Kornegay. 2019. “Accounting for Household Production in the National Accounts: An Update, 1965–2017,” Survey of Current Business 99 (June).
Kendrick, John W. 1956. “Productivity Trends: Capital and Labor.” Review of Economics and Statistics 3: 248–257.
Kendrick, John W. 1961. Productivity Trends in the United States. New York, NY: National Bureau of Economic Research.
Kommerskollegium. 2007. “Adding Value to the European Economy. How Anti-Dumping Can Damage the Supply of Globalised European Companies: Five Case Studies from the Shoe Industry.” National Board of Trade, Stockholm.
Koopman, Tjalling C. 1947. “Measurement Without Theory.” The Review of Economics and Statistics 39 (3): 161–172. Cambridge, MA: MIT Press.
Krueger, Alan B., Daniel Kahneman, David Schkade, Norbert Schwarz, and Arthur A. Stone. 2009. Measuring the Subjective Well-Being of Nations: National Accounts of Time Use and Well Being, edited by Alan B. Krueger: 113–123. Chicago, IL: University of Chicago Press, for the National Bureau of Economic Research.
Kuznets, Simon. 1934. National Income, 1929–1932. Transmitted to Congress in Response to Resolution no. 220.
Kuznets, Simon. 1941. National Income and Its Composition, 1919–1938. New York, NY: National Bureau of Economic Research.
Kuznets, Simon. 1953. Shares of Upper Income Groups in Income and Savings. New York, NY: National Bureau of Economic Research.
Kuznets, Simon. 1955 “Economic Growth and Income Inequality.” The American Economic Review 45 (1) (March): 1–28.
Landefeld, J. Steven, Barbara M. Fraumeni, and Cindy M. Vojtech. 2009. “Accounting for Household Production: A Prototype Satellite Account Using the American Time Use Survey.” Review of Income and Wealth 55 (2): 205–225.
Landefeld, J. Steven, Carol S. Carson, and others. 1994a. “Integrated Economic and Environmental Satellite Accounts.” Survey of Current Business 74 (April): 33–49.
Landefeld, J. Steven, Carol S. Carson, and others. 1994b. “Accounting for Mineral Resources: Issues and BEA’s Initial Estimates.” Survey of Current Business 74 (April): 50–72.
Landefeld, J. Steven, Brent R. Moulton, Joel D. Platt, and Shaunda M. Villones. 2010. “GDP and Beyond: Measuring Economic Progress and Sustainability,” Survey of Current Business 90 (April): 12–25.
Nordhaus, William D., and Edward C. Kokkelenberg, eds. 1999. Nature’s Numbers: Expanding the National Accounts to Include the Environment. Washington, DC: National Academy Press.
Nordhaus, William D., and James Tobin. 1973. “Is Growth Obsolete?” The Measurement of Economic and Social Performance, edited by Milton Moss: 509–564. New York, NY: Columbia University Press.
Office of Business Economics (OBE), U.S. Department of Commerce. 1953. “Income Distribution in the United States by Size, 1944–1950.” Survey of Current Business 33 (supplement).
Organisation for Economic Co-operation and Development (OECD). 2020. How’s Life? 2020: Measuring Well-being. Paris: OECD Publishing.
Organisation for Economic Co-operation and Development (OECD). Households’ Economic Well-Being: the OECD Dashboard; www.oecd.org/std/na/household-dashboard.htm.
Organisation for Economic Co-operation and Development (OECD) and World Trade Organization (WTO). 2015. “Trade in Value Added: China.” OECD-WTO: Trade in Value Added (October).
Piketty, Thomas, Emmanuel Saez, and Gabriel Zuman. 2018. “Distributional National Accounts: Methods and Estimates for the United States.” Quarterly Journal of Economics 133(2) (May): 553–609.
Pigou, Alfred C. 1920. The Economics of Welfare. London: Macmillan and Company.
Quesnay, Francois. 1766. Analyse de la Formule Artihmetique du Tableau Economique.
Ruggles, Richard, and Nancy Ruggles. 1973. “A Proposal for a System of Economic and Social Accounts.” The Measurement of Social and Economic Performance, edited by Milton Moss: 111–146. New York, NY: Columbia University Press.
Ruggles, Richard, and Nancy Ruggles. 1982. “Integrated Economic Accounts for the United States, 1947–1980.” Survey of Current Business 62 (May): 1–52.
Samuels, John D. 2018. “Aggregate Productivity and the Level of Living.” 35th IARIW General Conference. Copenhagen, Denmark: IARIW, August 20–25, 2018.
Semega, Jessica, Melissa Kollar, John Creamer, and Abinash Mohanty. 2019. “Income and Poverty in the United States: 2018.” United States Census Bureau, Current Population Reports P60-266 (September).
Solow, Robert. 1957. “Technical Change and the Aggregate Production Function.” Review of Economics and Statistics 3: 312–320.
Spahr, Charles B. 1896. “An Essay on the Present Distribution of Wealth in the United States.” New York, NY: Thomas Y. Cromwell Company.
Stevenson, Betsey, and Justin Wolfers. 2008. “Economic Growth and Subjective Well-Being: Reassessing the Easterlin Paradox.” Brookings Papers on Economic Activity 39(Spring): 1–102. Economic Studies Program, The Brookings Institution.
Stiglitz, Joseph E., Amartya Sen, and Jean-Paul Fitoussi. 2009. Report to the Commission on the Measurement of Economic Performance and Social Progress; www.stiglitz-sen-fitoussi.fr/en/index.htm.
Talberth, John, Clifford Cobb, and Noah Slattery. 2007. “The Genuine Progress Indicator 2006: A Tool for Sustainable Development.” Redefining Progress (February 2007).
Triplett, Jack E., and Barry P. Bosworth. 2004. Productivity in the U.S. Services Sector: New Sources of Growth. The Brookings Institution.
United Nations Development Programme (UNDP). 2019. Human Development Report 2019: Beyond Income, Beyond Averages, Beyond Today: Inequalities in Human Development in the 21st Century. New York, NY: AGS for UNDP.
University of Michigan. Index of Consumer Sentiment. 2020; www.sca.isr.umich.edu/tables.html.
Veenhoven, Ruut. 2020. “Overview of Happiness Surveys Using Measure Type: 111B/3-step Verbal Happiness.” World Database of Happiness, Collection: Happiness in Nations; www.worlddatabaseofhappiness.eur.nl/hap_nat/worlddatabaseofhappiness.eur.nl (April 17, 2020).
- Since the 1980s, BEA has produced many articles and prototype supplemental accounts. See “GDP and Beyond: Measuring Economic Progress and Sustainability” (Landefeld, Moulton, Platt, and Villones 2010) for a description of BEA’s work to address gaps in GDP through an extended system of satellite accounts.
- See Landefeld, Moulton, Platt, and Villones (2010), A New Architecture for the U.S. National Accounts (Jorgenson, Landefeld, and Nordhaus 2006), and Measuring Economic Sustainability and Progress (Jorgenson, Landefeld, and Schreyer 2014).
- BEA is currently updating its strategic plan—although, its primary mission goals will not change. The Bureau expects to release a revised version of the plan in the summer of 2020.
- For an overview of this welfare literature, see Welfare Volume 2: Measuring Social Welfare (Jorgenson 1997).
- See Report to the Commission on the Measurement of Economic Performance and Social Progress (Stiglitz, Sen, and Fitoussi 2009).
- BEA’s planned projects under the “GDP and Beyond” initiative do not cover the multitude of suggestions for improving and extending the national accounts to better measure economic well-being. For a more comprehensive list of possible extensions, see “Table 1. Timeline of Research on Economic Well-Being and Extensions to the National Accounts,” including Nordhaus and Kokkelenberg (1999); Abraham and Mackie (2005); Stiglitz, Sen, and Fitoussi (2009); and Jorgenson (2018).
- For a comparison of the concepts and methods underlying several prominent income distribution measures for the United States, see “Measuring Inequality in the National Accounts” (Fixler, Gindelsky, and Johnson 2020).
- The Gini coefficient is a commonly used inequality metric that illustrates how an actual distribution of income differs from one that has an equal distribution. Gini coefficients can have values between 0 and 1, where a value of 0 indicates that all individuals receive the same income, and a value of 1 means that all income accumulates to a single person. So, a larger Gini coefficient suggests that there is more inequality in the distribution of income.
- For a summary of this work, see “Integrated Economic and Environmental Satellite Accounts” (Landefeld, Carson, and others 1994a).