
U.S. International Services
Trade in Services in 2019 and Services Supplied Through Affiliates in 2018
This article highlights statistics on international services that the Bureau of Economic Analysis (BEA) releases annually. These statistics cover both U.S. international trade in services and services supplied by majority-owned U.S. and foreign affiliates of multinational enterprises (MNEs). For the basics on how international services are supplied to foreign and U.S. persons, including diagrams with examples, see the supplement to this article.1
Trade in services refers to exports and imports of services—that is, services traded between U.S. residents and nonresidents—that are included in the broader set of U.S. International Transactions Accounts (ITAs) released by BEA. The trade in services statistics in the international services tables provide more geographic, affiliation, and service-type detail than those in the ITAs, along with a supplementary classification into whether services can be delivered through digital means. This year, the trade in services portion of the international services statistics was released in stages in June and July, an acceleration of several months from previous years.
Services supplied through affiliates refers to services supplied by MNEs through the channel of direct investment. This set of statistics covers services supplied by majority-owned foreign affiliates of U.S. companies to foreign residents, both in the host country and in other foreign markets, and services supplied by majority-owned U.S. affiliates of foreign companies to U.S. residents.2 Because of the importance of physical proximity to customers in the delivery of certain types of services, many MNEs serve foreign markets partly or wholly through their affiliates located in, or close to, the markets they serve rather than through trade.
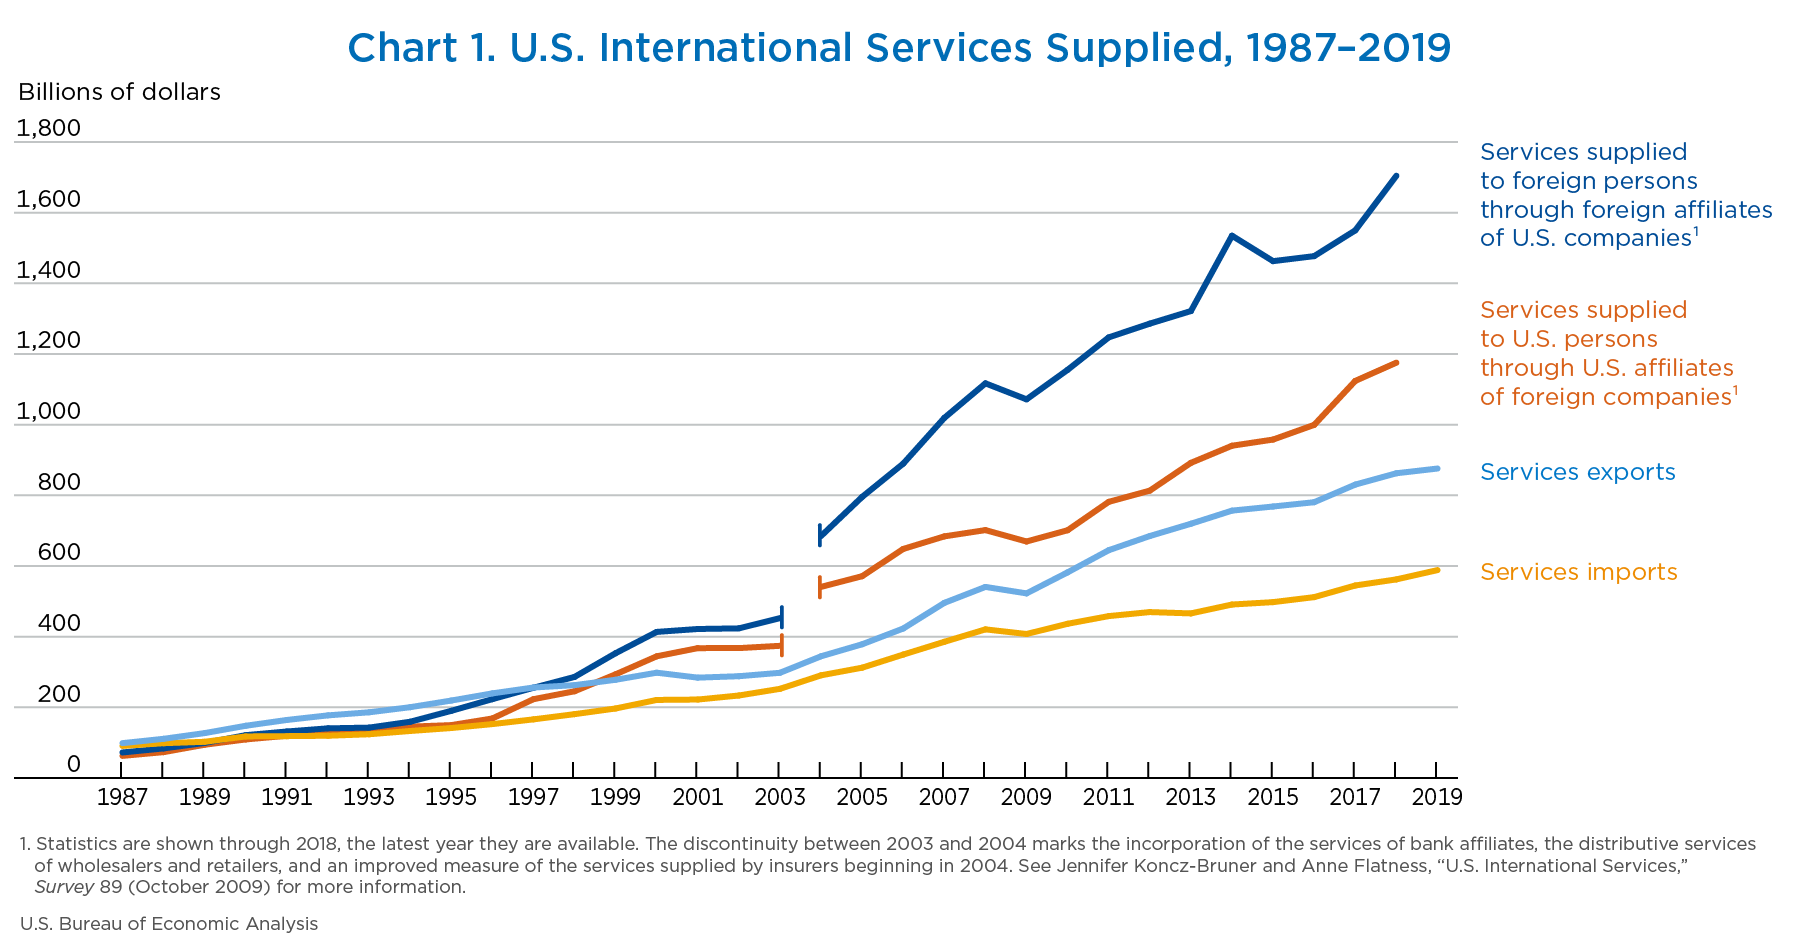
As in recent years, about two-thirds of the services provided internationally both by and to the United States in 2018—the latest year for which statistics on services supplied through affiliates are available—were through affiliates (table A and chart 1).3
[Click chart to expand]
| Year | Services supplied to foreign persons | Services supplied to U.S. persons | ||||
|---|---|---|---|---|---|---|
| Total | Through trade (U.S. exports) | Through foreign affiliates of U.S. companies | Total | Through trade (U.S. imports) | Through U.S. affiliates of foreign companies | |
| Billions of dollars | ||||||
| 2017 | 2,380.2 | 830.4 | 1,549.9 | 1,668.7 | 544.8 | 1,123.8 |
| 2018 | 2,566.7 | 862.4 | 1,704.3 | 1,737.5 | 562.1 | 1,175.4 |
| 2019 | n.a. | 875.8 | n.a. | n.a. | 588.4 | n.a. |
| Year | Percent change from preceding year | |||||
| 2017 | 5.4 | 6.4 | 4.9 | 10.4 | 6.4 | 12.5 |
| 2018 | 7.8 | 3.9 | 10.0 | 4.1 | 3.2 | 4.6 |
| 2019 | n.a. | 1.6 | n.a. | n.a. | 4.7 | n.a. |
- n.a.
- Not available
In 2018, total services supplied by the United States to foreign persons through both trade and sales by foreign affiliates of U.S. companies was $2.57 trillion, and total services supplied to the United States from foreign persons through both trade and sales by U.S. affiliates of foreign companies was $1.74 trillion. The difference between total services supplied to foreign persons and supplied to U.S. persons was $829.2 billion. Total services supplied to foreign persons increased $186.5 billion, or 8 percent, in 2018 after increasing $122.7 billion, or 5 percent, in 2017. Total services supplied to U.S. persons increased $68.8 billion, or 4 percent, in 2018 after increasing $157.4 billion, or 10 percent, in 2017.
In 2019, U.S. exports of services were $875.8 billion, and U.S. imports of services were $588.4 billion, resulting in a services trade surplus of $287.5 billion. The United States accounted for 14 percent of the world’s services exports and for 10 percent of the world’s services imports in 2019.4 In comparison, in 2019, the United States accounted for 16 percent of world gross domestic product (GDP).5
Exports of services increased $13.4 billion, or 2 percent, in 2019 after increasing $32.0 billion, or 4 percent, in 2018. By major service type, the largest increase in exports in 2019 was in other business services, primarily professional and management consulting services. The U.S. share of worldwide exports was little changed in 2019.
Imports of services increased $26.3 billion, or 5 percent, in 2019 after increasing $17.2 billion, or 3 percent, in 2018. The largest increases in imports in 2019 were in travel (for all purposes including education) (henceforth “travel”), primarily personal travel, and in insurance services, mainly reinsurance services.6 The increase in travel abroad by U.S. residents continued the upward trend in this category that started in 2010 after the Great Recession, coinciding with expanding U.S. economic activity over this period. The U.S. share of worldwide services imports increased in 2019.
Services supplied to foreign persons through foreign affiliates of U.S. MNEs were $1.70 trillion in 2018, an increase of $154.4 billion, or 10 percent, from 2017. This increase reflected increases in every major industry category and was led by increases in other industries, particularly in transportation and warehousing.
Services supplied to U.S. persons through U.S. affiliates of foreign MNEs were $1.18 trillion in 2018, an increase of $51.6 billion, or 5 percent, from 2017. This increase reflected increases in every major industry category except manufacturing.
The remainder of this article includes a “Services Spotlight” highlighting updates introduced in 2020 to BEA U.S. trade in services statistics and discussions of U.S. trade in services in 2019, U.S. trade in information and communications technology (ICT) and potentially ICT-enabled services (presenting an alternate aggregation of part of the trade in services statistics) in 2019, and services supplied through affiliates in 2018.
Trade in services statistics are measures of transactions between U.S. residents and nonresidents arising from productive activities that change the condition of the consumer or that facilitate the exchange of products and financial assets. The trade in services statistics in this article are consistent with trade in services statistics published in table 3.1 of the ITAs.
In 2019, U.S. exports of services were $875.8 billion, and U.S. imports of services were $588.4 billion, resulting in a services trade surplus of $287.5 billion (chart 2). Historically, the United States has recorded a surplus on trade in services, as the value of exports has exceeded the value of imports. The surplus decreased $12.9 billion in 2019 after increasing $14.8 billion in 2018. The decrease in 2019 reflected a $13.4 billion, or 2 percent, increase in exports of services and a $26.3 billion, or 5 percent, increase in imports of services.
The remainder of this section discusses trade in services in 2019 by service type, by trading partner, and by affiliation.

[Click chart to expand]
Trade by service type
BEA classifies services trade transactions into 11 major service-type categories.7 See the “Services Spotlight” in this article for more information. In 2019, travel accounted for the largest share of both exports and imports (table B). Eight of the major service types recorded surpluses, while three recorded deficits (chart 3).

[Click chart to expand]
| Country | Total services | Maintenance and repair services n.i.e. | Transport | Travel (for all purposes including education)2 | Construction | Insurance services | Financial services | Charges for the use of intellectual property n.i.e. | Telecommunications, computer, and information services | Other business services | Personal, cultural, and recreational services | Government goods and services n.i.e. |
|---|---|---|---|---|---|---|---|---|---|---|---|---|
| Exports | ||||||||||||
| All countries | 875,825 | 27,868 | 91,092 | 193,315 | 3,189 | 16,238 | 135,698 | 117,401 | 55,657 | 189,441 | 23,372 | 22,555 |
| Total for the top 10 countries1 | 490,940 | 10,021 | 44,495 | 99,690 | (D) | 9,842 | 87,646 | 74,666 | 31,243 | 115,834 | (D) | 3,405 |
| United Kingdom | 78,329 | 2,361 | 7,770 | 12,151 | (D) | 2,641 | 18,859 | 6,260 | 5,326 | 16,792 | 5,530 | (D) |
| Canada | 67,748 | 1,073 | 8,373 | 16,909 | 241 | 1,817 | 8,470 | 7,478 | 5,983 | 15,186 | 1,741 | 477 |
| Ireland | 57,544 | 517 | 564 | 1,437 | (*) | 306 | 4,689 | 17,814 | 3,428 | 28,649 | 123 | 17 |
| China | 56,537 | 1,405 | 5,546 | 29,047 | 52 | 223 | 4,781 | 8,144 | 1,524 | 4,087 | 1,229 | 500 |
| Japan | 50,052 | 1,233 | 8,485 | 8,794 | (D) | 3,407 | 4,951 | 6,866 | 4,008 | 10,107 | 1,044 | (D) |
| Switzerland | 46,838 | 217 | 2,245 | 1,772 | 7 | 222 | 1,706 | 17,188 | 3,019 | 19,964 | 438 | 63 |
| United Kingdom Islands, Caribbean3 | 39,765 | (*) | 209 | 263 | (D) | 220 | 34,593 | 333 | 262 | 3,839 | (D) | 2 |
| Germany | 36,637 | 1,723 | 5,382 | 5,773 | (D) | 306 | 3,459 | 5,191 | 2,254 | 10,801 | 1,371 | (D) |
| Mexico | 32,928 | 821 | 3,189 | 15,286 | 35 | 469 | 3,195 | 3,326 | 2,068 | 3,355 | 721 | 462 |
| Brazil | 24,562 | 670 | 2,730 | 8,258 | (*) | 232 | 2,945 | 2,068 | 3,372 | 3,055 | 1,030 | 203 |
| Other countries | 384,885 | 17,847 | 46,597 | 93,625 | (D) | 6,396 | 48,052 | 42,735 | 24,414 | 73,607 | (D) | 19,149 |
| Imports | ||||||||||||
| All countries | 588,359 | 7,823 | 107,458 | 134,594 | 1,327 | 51,547 | 40,350 | 42,733 | 43,720 | 113,584 | 21,140 | 24,083 |
| Total for the top 10 countries1 | 328,257 | (D) | 48,075 | 56,088 | 579 | 43,331 | 22,208 | (D) | 33,796 | 64,237 | 9,162 | 10,350 |
| United Kingdom | 62,345 | 2,184 | 8,135 | 9,062 | 38 | 3,639 | 12,309 | 4,262 | 3,284 | 15,333 | 3,342 | 758 |
| Canada | 38,550 | 1,725 | 5,851 | 9,244 | 421 | 777 | 2,967 | 2,020 | 4,883 | 8,514 | 1,824 | 325 |
| Japan | 35,825 | 138 | 9,499 | 3,619 | 9 | 395 | 2,102 | 9,702 | 532 | 3,815 | 1,317 | 4,696 |
| Germany | 34,918 | (D) | 8,282 | 3,314 | 8 | 2,669 | 870 | 7,030 | 841 | 7,230 | 570 | (D) |
| Mexico | 29,813 | 235 | 4,850 | 18,947 | 52 | 19 | 481 | 806 | 860 | 2,864 | 562 | 136 |
| India | 29,738 | 36 | 405 | 2,633 | 41 | 88 | 511 | 1,235 | 15,569 | 8,868 | 306 | 44 |
| Bermuda | 28,372 | (*) | 175 | 387 | 2 | 27,081 | 198 | (D) | 185 | 316 | 2 | (D) |
| Switzerland | 25,042 | 17 | 3,512 | 1,254 | 2 | 6,101 | 738 | 5,330 | 726 | 6,773 | 398 | 192 |
| Ireland | 23,215 | 29 | 1,097 | 2,249 | 3 | 1,894 | 534 | 2,322 | 6,587 | 8,047 | 441 | 13 |
| France | 20,440 | 424 | 6,270 | 5,380 | 2 | 669 | 1,498 | 2,763 | 329 | 2,478 | 399 | 228 |
| Other countries | 260,102 | (D) | 59,383 | 78,506 | 749 | 8,216 | 18,141 | (D) | 9,924 | 49,347 | 11,978 | 13,733 |
- (*)
- Transactions between zero and $500,000.
- n.i.e.
- Not included elsewhere
- D
- Suppressed to avoid disclosure of data of individual companies.
- The rank is based on the total value of services exports or imports in 2019.
- All travel purposes include (1) business travel, including expenditures by border, seasonal, and other short-term workers and (2) personal travel, including health-related and education-related travel.
- United Kingdom Islands, Caribbean comprises the British Virgin Islands, the Cayman Islands, Montserrat, and the Turks and Caicos Islands.
Note. Manufacturing services on physical inputs owned by others has been excluded as BEA does not yet provide values for this series.
Surpluses were largest in financial services, in other business services, and in charges for the use of intellectual property; 2019 was the third consecutive year in which the surplus in financial services, $95.3 billion in 2019, was the largest. The surplus in financial services partly reflects the fact that the United States is a major hub for global securities trading. In 2019, U.S. stock exchanges accounted for 45 percent of the value of equities traded on all the world’s exchanges.8 In 2019, the surplus in other business services overtook those in travel and in charges for the use of intellectual property as the second largest surplus; previously, other business services had not ranked among the top three contributors to the services surplus since 2009. The surplus in charges for the use of intellectual property partly reflects the high level of R&D performed in the United States. In 2017 (the most recent year for which statistics are available), the United States accounted for 25 percent of R&D performed worldwide.9
U.S. exports of services were $875.8 billion in 2019. The top four major service types—travel (22 percent of the total), other business services (22 percent), financial services (15 percent), and charges for the use of intellectual property (13 percent)—accounted for nearly three-fourths of total exports of services. U.S. imports of services were $588.4 billion. The top three major service types—travel (23 percent of the total), other business services (19 percent), and transport (18 percent)—accounted for three-fifths of total imports of services.
Exports increased for five of the major service types and decreased for the other six in 2019. The largest increase was in other business services and the largest decrease was in travel.
- Other business services. Exports of other business services have increased every year since 2000. Exports increased $12.2 billion, or 7 percent, to $189.4 billion, led by an increase in professional and management consulting services, mainly business and management consulting and public relations services. Increases in exports to Ireland, South Korea, and Switzerland together accounted for nearly three-fifths of the increase in total other business services exports.
- Telecommunications, computer, and information services. Exports of telecommunications, computer, and information services increased $6.0 billion, or 12 percent, to $55.7 billion. The increase was almost entirely accounted for by an increase in computer services. Geographically, the increase in total telecommunications, computer, and information services exports was widespread.
- Financial services. Exports of financial services increased $3.3 billion, or 2 percent, to $135.7 billion. The increase largely reflected an increase in credit card and other credit-related services. Increases in exports to Spain and to the United Kingdom Islands, Caribbean together accounted for over half of the increase in total financial services exports.
- Travel. Exports of travel services decreased $3.1 billion, or 2 percent, to $193.3 billion, led by a decrease in other personal travel.10 Decreases in exports to Canada, Brazil, and Mexico together accounted for most of the decrease in total travel exports.
Imports increased in nine of the major service types in 2019. The largest increase was in travel, followed by insurance services and other business services; these three categories accounted for 84 percent of the $26.3 billion increase in imports.
- Travel. Imports of travel services increased $8.6 billion, or 7 percent, to $134.6 billion. The increase reflected an increase in other personal travel. Geographically, the increase in imports of total travel services was widespread.
- Insurance services. Imports of insurance services increased $7.8 billion, or 18 percent, to $51.5 billion, mainly reflecting an increase in reinsurance services. Imports from Bermuda accounted for nearly two-thirds of the increase in total insurance imports.
- Other business services. Imports of other business services increased $5.7 billion, or 5 percent, to $113.6 billion. The increase in other business services was led by an increase in technical, trade-related, and other business services. Imports from Ireland, China, and Germany together accounted for most of the increase in total other business services imports.
Trade by partner country
The top 10 trading partners of the United States based on total trade (exports plus imports) for 2019 are shown in chart 4. The top 10 trading partners accounted for 56 percent of services exports and 53 percent of services imports. The United Kingdom remained the largest trading partner for services in 2019; it was both the largest market for U.S. exports and the largest source for U.S. imports (table B). The top categories of exports to the United Kingdom were financial services (led by securities lending, electronic funds transfer, and other services) and other business services (mainly professional and management consulting services). The top categories for imports were other business services (mainly professional and management consulting services) and financial services (led by financial management services). Canada was the second-largest trading partner; it was both the second-largest market for U.S. exports and the second-largest source for U.S. imports for the third year in a row. The top export and import categories for Canada were travel, primarily other personal travel, and other business services, primarily professional and management consulting services.

[Click chart to expand]
Increases in exports to the top 10 trading partners (the countries shown in chart 4) accounted for $13.7 billion, or 102 percent, of the $13.4 billion increase in total services exports in 2019. Exports to Ireland and Switzerland increased the most. Among the notable increases in exports were the following:
- Ireland. Exports to Ireland increased $6.0 billion, or 12 percent, to $57.5 billion, largely reflecting an increase of $4.0 billion in other business services. The increase in other business services was more than accounted for by an increase in professional and management consulting services, led by an increase in business and management consulting and public relations services.
- Switzerland. Exports to Switzerland increased $5.0 billion, or 12 percent, to $46.8 billion, largely reflecting a $2.9 billion increase in charges for the use of intellectual property, mainly charges associated with licenses for the use of outcomes of R&D.
Increases in imports from the top 10 trading partners accounted for $13.8 billion, or 53 percent, of the $26.3 billion increase in total services imports in 2019 (chart 4). Imports from Ireland, Bermuda (not shown in chart 4), and Switzerland increased the most. Among the notable increases in imports were the following:
- Ireland. Imports from Ireland increased $5.1 billion, or 28 percent, to $23.2 billion, largely reflecting a $3.2 billion increase in telecommunications, computer, and information services, mainly computer services.
- Bermuda. Imports from Bermuda increased $5.0 billion, or 22 percent, to $28.4 billion, reflecting an increase of $4.9 billion in insurance services, mostly reinsurance services.
- Switzerland. Imports from Switzerland increased $1.9 billion, or 8 percent, to $25.0 billion after decreasing $6.5 billion in 2018. The increase was more than accounted for by an increase in insurance services, mostly reinsurance services.
Trade by affiliation
U.S. services trade includes trade between unaffiliated parties and trade within MNEs (affiliated trade). Affiliated trade accounted for 32 percent of U.S. services exports and 29 percent of U.S. services imports in 2019 (table C). Affiliated services exports grew more rapidly than unaffiliated services exports in 2019. In contrast, unaffiliated services imports grew much more rapidly than affiliated services imports.
| Affiliation type | Billions of dollars | Percent change from preceding year |
Percent of total trade in services |
|
|---|---|---|---|---|
| 2018 | 2019 | 2019 | 2019 | |
| Exports of services | ||||
| Total exports of services | 862.4 | 875.8 | 1.6 | ….. |
| Unaffiliated | 593.3 | 595.0 | 0.3 | 67.9 |
| Affiliated | 269.1 | 280.8 | 4.4 | 32.1 |
| U.S. parents' exports to their foreign affiliates | 215.1 | 224.2 | 4.3 | 25.6 |
| U.S. affiliates' exports to their foreign parent groups | 54.1 | 56.6 | 4.7 | 6.5 |
| Imports of services | ||||
| Total imports of services | 562.1 | 588.4 | 4.7 | ….. |
| Unaffiliated | 393.1 | 418.8 | 6.5 | 71.2 |
| Affiliated | 169.0 | 169.6 | 0.4 | 28.8 |
| U.S. parents' imports from their foreign affiliates | 116.0 | 116.6 | 0.5 | 19.8 |
| U.S. affiliates' imports from their foreign parent groups | 53.0 | 53.0 | 0.1 | 9.0 |
- .....
- Not applicable
BEA statistics on trade in information and communications technology (ICT) and potentially ICT-enabled services complement BEA’s standard presentation of international trade in services statistics by providing insight into the extent to which ICT may be used to facilitate trade in services. ICT services facilitate information processing and communication; ICT-enabled services are services delivered over ICT networks. BEA’s statistics on ICT services include three categories of services from BEA’s published statistics on international trade in services: telecommunications services, computer services, and charges for the use of licenses to reproduce and/or distribute computer software.
It is not possible to precisely identify services trade that is ICT enabled, because BEA collects data on trade in services by category based on the Extended Balance of Payments Services classification (EBOPS 2010), which is based on the type of service traded and not on the mode of delivery.11 BEA, therefore, measures a related but more broadly defined concept of potentially ICT-enabled services, which includes services that can predominantly be delivered remotely over ICT networks, without identifying the services that are delivered over ICT networks. See “Updating Potentially ICT-Enabled Services for the 2020 Annual Update” for a description of the service types included in ICT and potentially ICT-enabled services as well as changes BEA adopted to its definition of potentially ICT-enabled services in June 2020, beginning with statistics for 1999.
Trade in ICT Services and Potentially ICT-Enabled Services in 2019
In 2019, U.S. exports of ICT services were $82.6 billion, and U.S. imports of ICT services were $51.6 billion, resulting in an ICT services trade surplus of $31.0 billion (chart 5). The surplus increased $2.5 billion from 2018, as exports of ICT services increased $2.9 billion, and imports of ICT services increased $0.4 billion.
U.S. exports of potentially ICT-enabled services were $517.5 billion, and U.S. imports of potentially ICT-enabled services were $297.6 billion, resulting in a potentially ICT-enabled services trade surplus of $219.9 billion. The surplus increased $3.1 billion from 2018, as exports increased $17.7 billion, and imports increased $14.6 billion. Potentially ICT-enabled services accounted for 59 percent of total services exports and 51 percent of imports in 2019. Both shares increased slightly from their 2018 values of 58 and 50 percent, respectively. The remainder of this section discusses trade in potentially ICT-enabled services in 2019 by service type, by trading partner, and by affiliation. Tables available on BEA's website provide additional detail on trade in ICT and potentially ICT-enabled services.

[Click chart to expand]
Potentially ICT-enabled trade by service type
In 2019, potentially ICT-enabled services in other business services, primarily professional and management consulting services and research and development services, accounted for the largest shares of exports (33 percent) and imports (33 percent) (chart 6). Exports in five of the six major categories exceeded imports, with the largest surplus occurring in financial services. The combined surpluses in these five categories more than offset a deficit in insurance services.
Exports increased in three of the six major categories in 2019. The largest increases for exports were in potentially ICT-enabled services in other business services, primarily professional and management consulting services, and in telecommunications, computer, and information services. Imports increased in five of the six major categories in 2019. The largest increases for imports were in insurance services and in potentially ICT-enabled services in other business services, led by an increase in professional and management consulting services.

[Click chart to expand]

[Click chart to expand]
Potentially ICT-enabled trade by partner country
Exports and imports in potentially ICT-enabled services for the top 10 trading-partner countries by total 2019 trade (exports plus imports) are shown in chart 7.
In 2019, the United Kingdom was the United States’ top trading partner in potentially ICT-enabled services. Exports to the United Kingdom were $53.9 billion, led by exports of financial services and potentially ICT-enabled services in other business services. Imports from the United Kingdom were between $39.9 and $40.2 billion (see “Calculating Ranges for Suppressed Values”), led by potentially ICT-enabled services in other business services and financial services. In 2019, Ireland overtook the United Kingdom as the top recipient country for exports, reflecting a significant increase in exports of potentially ICT-enabled services in other business services, particularly in professional and management consulting services. The United Kingdom was the top source of imports in 2019, followed by Bermuda; the vast majority of imports from Bermuda were in insurance services.
The largest increases in 2019 in exports were in exports to Ireland and to Switzerland; for Ireland, the largest increase was in potentially ICT-enabled services in other business services, mostly in professional and management consulting services. The largest increases in 2019 in imports were in imports from Bermuda and Ireland; almost all of the increase for Bermuda was in insurance services, particularly reinsurance services.
Potentially ICT-enabled trade by affiliation
Affiliated trade accounted for 52 percent of exports and between 53 and 54 percent of imports of potentially ICT-enabled services in 2019 (table D). These shares are much higher than the affiliated shares of total services exports and imports, highlighting the importance of providing services over ICT networks for intrafirm trade. Affiliated exports increased 5 percent in 2019, and unaffiliated exports increased 2 percent. Precise changes cannot be calculated for either unaffiliated or affiliated imports, because import levels were suppressed in both 2018 and 2019. However, feasible growth rates range between 8 and 13 percent for unaffiliated imports and between −1 percent and 3 percent for affiliated imports.
| Affiliation type | Billions of dollars | Percent change from preceding year | Percent of total trade in potentially ICT-enabled services | |||||
|---|---|---|---|---|---|---|---|---|
| 2018 | 2019 | 2019 | 2019 | |||||
| Point value or lower bound | Upper bound | Point value or lower bound | Upper bound | Point value or lower bound | Upper bound | Point value or lower bound | Upper bound | |
| Exports of potentially ICT-enabled services | ||||||||
| Total exports of potentially ICT-enabled services | 499.8 | ….. | 517.5 | ….. | 3.5 | ….. | ….. | ….. |
| Unaffiliated | 240.2 | ….. | 245.9 | ….. | 2.4 | ….. | 47.5 | ….. |
| Affiliated | 259.6 | ….. | 271.6 | ….. | 4.6 | ….. | 52.5 | ….. |
| U.S. parents’ exports to their foreign affiliates | 208.2 | 208.4 | 217.4 | ….. | 4.3 | 4.4 | 42.0 | ….. |
| U.S. affiliates’ exports to their foreign parent groups | 51.2 | 51.4 | 54.2 | ….. | 5.3 | 5.7 | 10.5 | ….. |
| Imports of potentially ICT-enabled services | ||||||||
| Total imports of potentially ICT-enabled services | 283.1 | ….. | 297.6 | ….. | 5.1 | ….. | ….. | ….. |
| Unaffiliated | 123.8 | 128.1 | 138.3 | 139.7 | 7.9 | 12.9 | 46.5 | 46.9 |
| Affiliated | 155.0 | 159.3 | 157.8 | 159.3 | −0.9 | 2.8 | 53.0 | 53.5 |
| U.S. parents’ imports from their foreign affiliates | 104.5 | 108.9 | 106.9 | 108.6 | −1.8 | 3.9 | 35.9 | 36.5 |
| U.S. affiliates’ imports from their foreign parent groups | 50.3 | 50.4 | 50.6 | 50.9 | 0.4 | 1.2 | 17.0 | 17.1 |
- .....
- Not applicable
- ICT
- Information and communications technology
- For affiliation types where the value of potentially ICT-enabled services is published, a point value is given. For affiliation types where the value of potentially ICT-enabled services is suppressed to avoid the disclosure of data of individual companies, a range of possible values is given in the lower bound and upper bound columns. For more information on how the lower and upper bounds were calculated, see “Calculating Ranges for Suppressed Values.”
U.S. international services delivered via the channel of direct investment consist of (1) services supplied to foreign residents by foreign affiliates of U.S. MNEs and (2) services supplied to U.S. residents by U.S. affiliates of foreign MNEs. The statistics in this article are consistent with services supplied statistics published in BEA’s statistics on the activities of multinational enterprises (“AMNE statistics”), except that the AMNE statistics primarily focus on services supplied to all customers regardless of the residency of the customer. While the statistics on trade in services discussed above are presented by service type, by trading partner, and by affiliation, statistics on services supplied through affiliates are presented by industry of the foreign affiliate, by country of affiliate or country of ultimate beneficial owner (UBO), and by destination.12
In 2018, the latest year for which statistics are available, services supplied by U.S. MNEs to foreign markets through their foreign affiliates increased $154.5 billion, or 10 percent, to $1.70 trillion (chart 8). Services supplied by foreign MNEs to the U.S. market through their U.S. affiliates increased $51.6 billion, or 5 percent, to $1.18 trillion. The difference between international services supplied through affiliates to foreign markets and the services supplied to the U.S. market was $528.9 billion in 2018, compared with $426.0 billion in 2017.

[Click chart to expand]
The remainder of this section discusses services supplied through affiliates in 2018. Tables available on BEA’s website provide additional detail on services supplied through affiliates of MNEs, along with detail cross classified by country and industry.
| Country | All industries | Mining | Manufac- turing | Wholesale trade | Retail trade | Information | Finance and insurance | Real estate and rental and leasing | Professional, scientific, and technical services | Other industries |
|---|---|---|---|---|---|---|---|---|---|---|
| Services supplied to foreign persons by U.S. MNEs through their majority-owned foreign affiliates by country of the foreign affiliate | ||||||||||
| All countries | 1,704,310 | 39,101 | 35,325 | 256,879 | 121,674 | 289,629 | 262,716 | 82,426 | 277,637 | 338,924 |
| Total for the top 10 countries1 | 1,105,607 | 14,427 | 24,794 | 179,861 | 83,087 | 208,187 | 154,085 | 61,740 | 174,275 | 205,151 |
| United Kingdom | 267,260 | 4,954 | 6,276 | 22,823 | 27,271 | 38,268 | 65,338 | 7,790 | 45,455 | 49,084 |
| Ireland | 164,896 | (D) | (D) | 8,299 | 282 | 84,259 | 12,763 | 18,387 | 31,630 | (D) |
| Canada | 132,657 | 5,784 | 2,891 | 20,100 | 26,244 | 9,454 | 13,546 | 5,050 | 14,087 | 35,499 |
| Singapore | 88,120 | (D) | (D) | 27,090 | 3,052 | 15,327 | 17,206 | (D) | 8,397 | 12,237 |
| Netherlands | 87,353 | 1,546 | 3,835 | 15,126 | 2,217 | 19,667 | 9,633 | 3,286 | 9,790 | 22,254 |
| Switzerland | 86,384 | 92 | 370 | 31,490 | 4,784 | 5,728 | 2,066 | (D) | 18,728 | (D) |
| Germany | 84,014 | 827 | 2,866 | 16,834 | 6,256 | 13,517 | 5,760 | 2,541 | 14,959 | 20,455 |
| Japan | 77,411 | 0 | 266 | 15,155 | 4,619 | 11,378 | 20,254 | 1,183 | 14,715 | 9,840 |
| China | 59,614 | 426 | 1,981 | 13,502 | 5,793 | 3,599 | 3,455 | 2,290 | 6,595 | 21,971 |
| France | 57,899 | 109 | 3,046 | 9,441 | 2,567 | 6,989 | 4,063 | 1,865 | 9,919 | 19,901 |
| Other countries | 598,703 | 24,674 | 10,531 | 77,018 | 38,586 | 81,441 | 108,632 | 20,686 | 103,361 | 133,773 |
| Services supplied to U.S. persons by foreign MNEs through their majority-owned U.S. affiliates by country of the UBO | ||||||||||
| All countries | 1,175,440 | 42,636 | 92,758 | 218,604 | 79,775 | 145,993 | 190,890 | 33,884 | 141,329 | 229,570 |
| Total for the top 10 countries2 | 939,786 | 10,310 | 83,852 | 160,765 | 72,086 | 124,725 | 161,732 | 25,253 | 114,456 | 186,606 |
| Japan | 173,170 | (D) | 19,733 | 64,204 | (D) | (D) | 25,312 | 2,512 | 7,811 | (D) |
| United Kingdom | 161,022 | (D) | 10,844 | 10,623 | 13,234 | 26,136 | 19,783 | 8,539 | (D) | (D) |
| Germany | 151,281 | (D) | 28,037 | 12,900 | 10,077 | (D) | 17,613 | 2,114 | 10,443 | (D) |
| Canada | 133,261 | 1,326 | 4,228 | 15,594 | 18,883 | 8,928 | 31,569 | (D) | 11,544 | (D) |
| France | 106,039 | (D) | 2,837 | 9,951 | (D) | (D) | 22,744 | (D) | 39,699 | (D) |
| Switzerland | 61,019 | (D) | 7,839 | 3,859 | 1,111 | (D) | 16,899 | 829 | 996 | (D) |
| Netherlands | 55,501 | (D) | 5,053 | 9,365 | 16,811 | (D) | (D) | 2,382 | (D) | (D) |
| South Korea | 35,855 | (D) | 537 | 30,957 | (D) | (D) | 221 | 68 | 724 | (D) |
| United States | 33,899 | 0 | 170 | 1,467 | 2,098 | 1,583 | (D) | 65 | 3,574 | (D) |
| Ireland | 28,739 | (D) | 4,575 | 1,846 | 6 | 214 | (D) | 23 | (D) | (D) |
| Other countries | 235,654 | 32,326 | 8,906 | 57,839 | 7,690 | 21,267 | 29,158 | 8,631 | 26,873 | 42,964 |
- (D)
- Suppressed to avoid the disclosure of data of individual companies
- MNEs
- Multinational enterprises
- The rank is based on the total value of services supplied to foreign persons by U.S. MNEs through their majority-owned foreign affiliates.
- The rank is based on the total value of services supplied to U.S. persons by foreign MNEs through their majority-owned U.S. affiliates.
Services supplied through affiliates by industry
In the international services statistics, BEA classifies services supplied through affiliates into nine major industry categories (table E). In 2018, the broad category other industries (primarily transportation and warehousing; administration, support, and waste management; and accommodation and food services) accounted for the largest share (20 percent) of the services supplied by U.S. MNEs to foreign markets through their foreign affiliates. Four additional industries—information; professional, scientific, and technical services; finance and insurance; and wholesale trade—each also accounted for over 15 percent of the total. The remaining four major industry categories each accounted for less than 8 percent.

[Click chart to expand]
In 2018, services supplied to foreign persons by foreign affiliates of U.S. MNEs increased in all nine industry categories (chart 9). The largest contribution to the $154.5 billion aggregate increase was from affiliates in other industries, which accounted for 30 percent of the aggregate increase. Among the notable changes by industry were the following:
- Other industries. Services supplied through foreign affiliates in other industries increased $47.0 billion to $338.9 billion. Affiliates in transportation and warehousing accounted for nearly two-fifths of the increase in other industries, but increases were widespread across subindustries.
- Information. Services supplied through affiliates in information increased $33.9 billion to $289.6 billion. An increase in services supplied through European affiliates in other information services accounted for over half of the increase.
In 2018, services supplied to U.S. persons through U.S. affiliates of foreign MNEs increased in all of the major industry categories except manufacturing (chart 9). The largest industry contribution to the $51.6 billion aggregate increase was in professional, scientific, and technical services. Among the notable changes by industry were the following:
- Professional, scientific, and technical services. Services supplied through affiliates in professional, scientific, and technical services increased $13.1 billion to $141.3 billion, reflecting increases in all subindustries except architectural, engineering, and related services. An increase in services supplied through European affiliates in management, scientific, and technical consulting services accounted for more than half of the increase.
- Finance and insurance. Services supplied through affiliates in finance and insurance increased $12.7 billion to $190.9 billion. The increase was more than accounted for by an increase in services supplied through affiliates that are insurance carriers or involved in related activities. The increase in services supplied through affiliates in insurance was partly offset by a decrease among affiliates in finance.
Services supplied through affiliates by country
In 2018, as in 2017, the top countries for services supplied to foreign persons by U.S. MNEs through their foreign affiliates—ranked by country of the foreign affiliate—were the United Kingdom, Ireland, and Canada (table E). In both years, the top countries for services supplied to U.S. persons by foreign MNEs through their U.S. affiliates—ranked by the country of UBO of the affiliate—were Japan, the United Kingdom, and Germany.
[Click chart to expand]
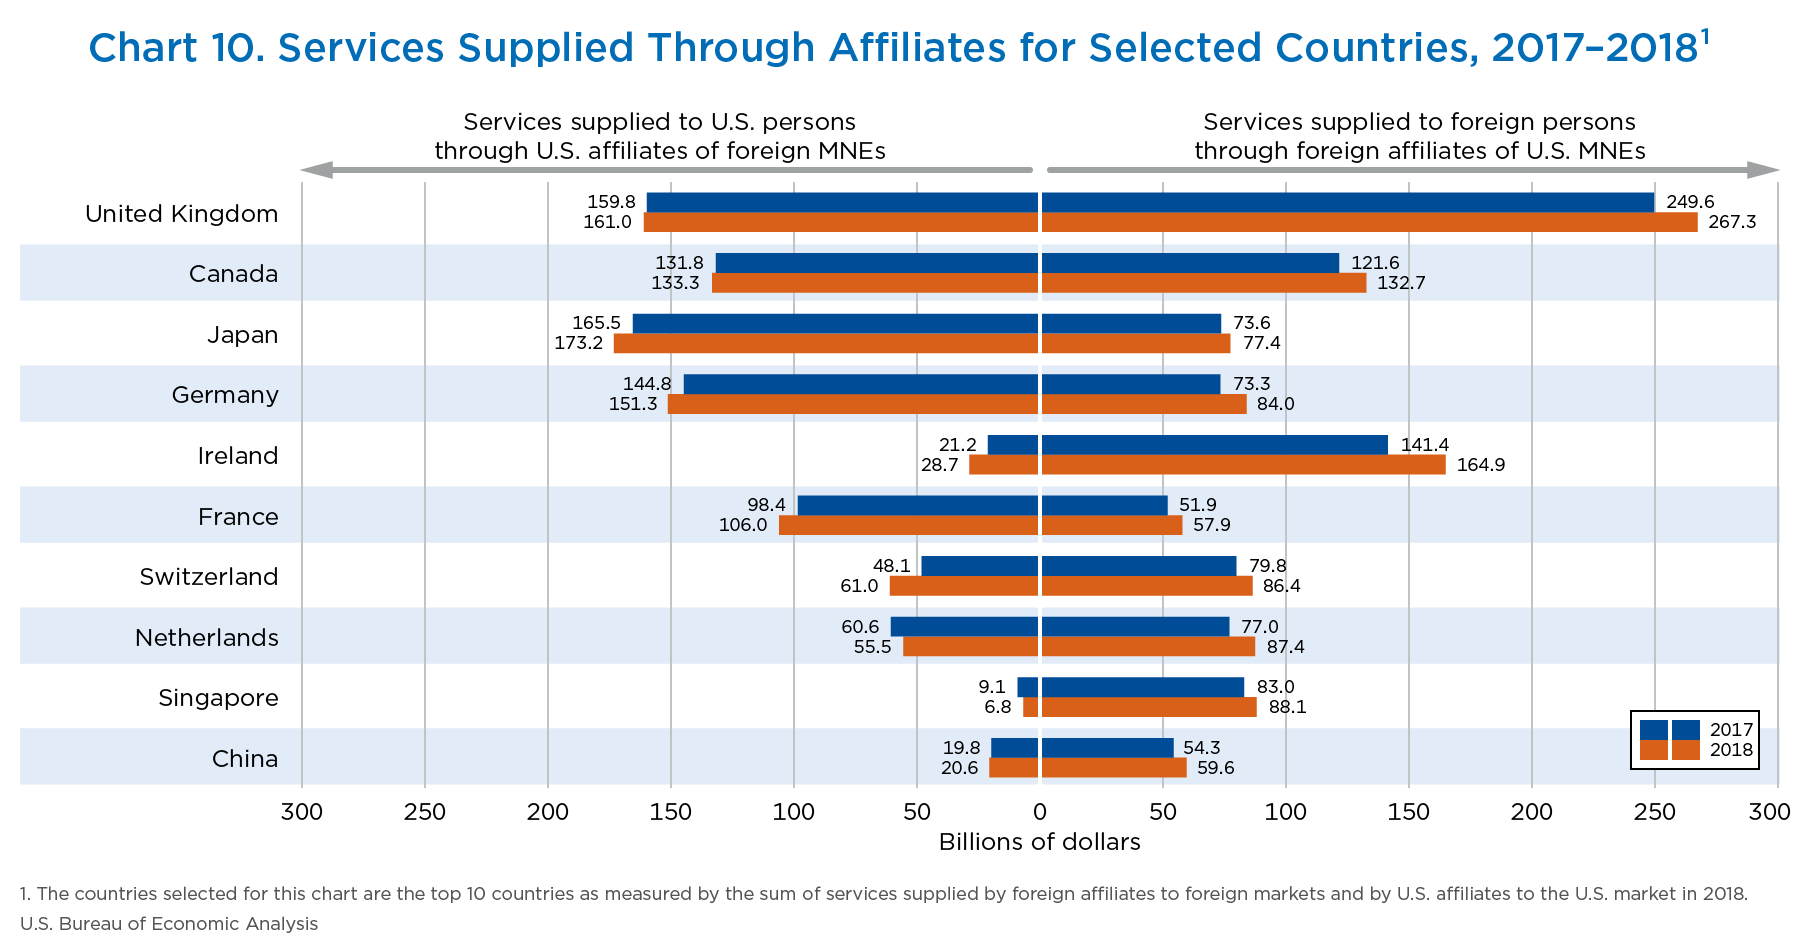
Contributions to the $154.5 billion increase in 2018 in services supplied to foreign persons through foreign affiliates were widespread geographically (chart 10).
The largest increase was for services supplied through affiliates in Ireland. Among the notable 2018 increases were the following:
- Ireland. Services supplied through Irish affiliates increased $23.5 billion to $164.9 billion. Much of the increase was from affiliates in information services. Services supplied through affiliates in professional, scientific, and technical services and through affiliates in finance and insurance also increased substantially.
- United Kingdom. Services supplied through affiliates in the United Kingdom increased $17.7 billion to $267.3 billion. The increase was spread across several major industry categories, including other industries; retail trade; professional, scientific, and technical services; finance and insurance; and wholesale trade.
In 2018, increases by U.S. affiliates with UBOs in several countries contributed to the aggregate increase of $51.6 billion in services supplied to U.S. persons through U.S. affiliates of foreign MNEs. Notable changes included the following:
- Japan. Services supplied through affiliates with Japanese UBOs increased $7.7 billion, partly reflecting an increase in services supplied by affiliates in wholesale trade.
- France. Services supplied through affiliates with French UBOs increased $7.7 billion; the largest increase for French affiliates was in finance and insurance.
Services supplied through affiliates by destination
Foreign affiliates supply services to both foreign markets and the U.S. market.13 Services supplied to foreign persons, the focus of the services supplied through foreign affiliates statistics presented in this article, accounted for 88 percent of the services supplied worldwide through foreign affiliates in 2018; the remainder were supplied to U.S. persons (table F). Most of the services supplied to foreign persons were supplied to the affiliates’ host country, the vast majority of which were supplied to unaffiliated persons. In contrast, for services supplied to other foreign countries, more than half were supplied to unaffiliated persons. Most of the services supplied to U.S. persons were supplied to U.S. parents.14
U.S. affiliates supply services both to the U.S. market and to foreign markets.15 Services supplied to U.S. persons, the focus of the services supplied through U.S. affiliates statistics presented in this article, accounted for 90 percent of the services supplied worldwide by U.S. affiliates in 2018; the remainder were supplied to foreign markets. In 2017, most of the services supplied to U.S. persons were supplied to unaffiliated persons. For services supplied to foreign persons, just over two-thirds were supplied to unaffiliated persons.16
| Destination | Billions of dollars | Percent change from preceding year | Percent of total services supplied |
|
|---|---|---|---|---|
| 2017 | 2018 | 2018 | 2018 | |
| Services supplied by U.S. MNEs through their majority-owned foreign affiliates | ||||
| Total services supplied | 1,756.9 | 1,940.3 | 10.4 | ..... |
| Services supplied to U.S. persons | 207.1 | 236.0 | 14.0 | 12.2 |
| To U.S. parents1 | 175.5 | 201.6 | 14.9 | 10.4 |
| To unaffiliated persons | 31.5 | 34.4 | 9.0 | 1.8 |
| Services supplied to foreign persons | 1,549.9 | 1,704.3 | 10.0 | 87.8 |
| To the host country2 | 1,143.0 | 1,258.5 | 10.1 | 64.9 |
| To other foreign affiliates3 | 82.2 | 93.4 | 13.7 | 4.8 |
| To unaffiliated persons | 1,060.8 | 1,165.1 | 9.8 | 60.0 |
| To other foreign countries | 406.9 | 445.8 | 9.6 | 23.0 |
| To other foreign affiliates3 | 191.7 | 190.5 | −0.6 | 9.8 |
| To unaffiliated persons | 215.1 | 255.3 | 18.7 | 13.2 |
| Services supplied by foreign MNEs through their majority-owned U.S. affiliates | ||||
| Total services supplied | 1,247.1 | 1,299.2 | 4.2 | ..... |
| Services supplied to U.S. persons | 1,123.8 | 1,175.4 | 4.6 | 90.5 |
| To other U.S. affiliates4 | 233.8 | n.a. | n.a. | n.a. |
| To unaffiliated persons | 890.1 | n.a. | n.a. | n.a. |
| Services supplied to foreign persons | 123.2 | 123.8 | 0.4 | 9.5 |
| To the foreign parent group5 | 39.3 | n.a. | n.a. | n.a. |
| To foreign affiliates6 | 1.1 | n.a. | n.a. | n.a. |
| To unaffiliated persons | 82.9 | n.a. | n.a. | n.a. |
- .....
- Not applicable
- n.a.
- Not available
- MNEs
- Multinational Enterprises
- Services supplied to U.S. parents includes only services supplied to the U.S. parent or parents of the supplying foreign affiliate. Services supplied to U.S. parents not affiliated with the supplying foreign affiliate are included in the row for unaffiliated persons.
- Services supplied to the host country include services supplied by an affiliate to persons in the country where the affiliate is located.
- Services supplied to other foreign affiliates includes only services supplied to foreign affiliates of the supplying foreign affiliate's U.S. parent or parents. Services supplied to foreign affiliates of U.S. parents not affiliated with the supplying foreign affiliate are included in the row for unaffiliated persons.
- Services supplied to other U.S. affiliates include only services supplied to U.S. affiliates owned by the same foreign parent group as the supplying U.S. affiliate. Services supplied to U.S. affiliates not owned by the same foreign parent group as the supplying U.S. affiliate are included in the row for unaffiliated U.S. persons.
- Services supplied to the foreign parent group include only services supplied to the foreign parent group of the supplying U.S. affiliate. Services supplied to members of foreign parent groups that do not own the supplying U.S. affiliate are not included.
- Services supplied to foreign affiliates include only services supplied to foreign affiliates owned by the supplying U.S. affiliate. Services supplied to foreign affiliates that are not owned by the supplying U.S. affiliate are not included.
- More information on the definitions, coverage, and methodology of trade in services and services supplied through affiliates is available on the BEA website.
- The term “affiliates” in this article refers to majority-owned affiliates. The statistics on services supplied through affiliates cover the full value of services provided by majority-owned affiliates, irrespective of the percentage of ownership.
- The statistics on trade in services and services supplied through affiliates are not directly comparable because of differences in coverage and classification. For example, wholesale and retail trade distributive services are included in services supplied through affiliates but not in trade in services statistics. Trade in services are collected and published by type of service, but services supplied through affiliates are collected and published by the affiliate's primary industry. For more information, see “Definition of International Services” on BEA's website.
- World Trade Organization, United Nations Conference on Trade and Development, and International Trade Centre Annual Trade in Services Dataset (last updated July 2020).
- World Bank World Development Indicators (series: “GDP, PPP (current international $)”).
- “Travel (for all purposes including education)” is the name used in the trade in services statistics to encompass a broadly defined travel category. This category includes business travel and personal travel. Business travel includes expenditures by border, seasonal, and other short-term workers and other business travel. Personal travel includes health-related travel, education-related travel, and other personal travel. Note that airfares or other expenditures associated with transporting travelers between the United States and foreign countries are not classified in travel; these expenditures are included in transport services.
- In the 2020 annual update of the ITAs, manufacturing services on physical inputs owned by others was added to the presentation of services statistics as a 12th major service category, but BEA does not yet provide values for this series. Instead, n.a. is shown in the tables. BEA will replace the n.a. in this new major category with values when it is able to produce a reliable and comprehensive estimate of manufacturing services on physical inputs owned by others. See “Future Enhancements to the International Services Statistics” in this article for more information on the research BEA is conducting toward developing these estimates.
- Based on data from the World Federation of Exchanges Annual Statistics Guide 2019.
- “Science and Engineering Indicators 2020: The State of U.S. Science and Engineering” (Alexandria, VA: National Science Foundation, 2020 (NSB-2020-1)).
- Other personal travel includes any personal travel undertaken for purposes other than health or education.
- The EBOPS guidelines were established by the Manual on Statistics of International Trade in Services (Geneva: United Nations Department of Economic and Social Affairs, 2010) and Balance of Payments and International Investment Position Manual, Sixth Edition (Washington, DC: International Monetary Fund, 2009).
- The UBO of a U.S. affiliate is that person or entity, proceeding up a chain of majority-ownership (where the entity above owns more than 50 percent of the entity below), beginning with and including the foreign parent of the U.S. affiliate, that is not owned by more than 50 percent by another person. Unlike the foreign parent, the UBO of an affiliate may be located in the United States. The UBO of each affiliate ultimately owns or controls the U.S. affiliate and therefore ultimately derives the benefits and assumes the risks from ownership or control.
- Services supplied through foreign affiliates to the U.S. market are mostly classified as U.S. imports of services. However, data from BEA direct investment surveys on these services supplied are not used to estimate U.S. imports of services; data on these services are collected along with data on other U.S. services imports in BEA's services trade collection program. Of the services supplied through foreign affiliates to U.S. persons, distributive services in wholesale and retail trade are generally not included as U.S. imports of services.
- International services tables 4.2 and 4.3 present the destination by affiliation breakdown for services supplied to foreign persons; BEA AMNE statistics additionally include the affiliation breakdown for services supplied to the United States.
- Services supplied through U.S. affiliates to foreign markets are mostly classified as U.S. exports of services. However, data from BEA direct investment surveys on these services supplied are not used to estimate U.S. exports of services; data on these services are collected along with data on other U.S. services exports in BEA's services trade collection program. Of the services supplied through U.S. affiliates to foreign persons, distributive services in wholesale and retail trade are generally not included as U.S. exports of services.
- Information on the destination of services sales by affiliation is not collected annually, but was collected on BEA's 2017 Benchmark Survey of Foreign Direct Investment in the United States; statistics featuring the affiliation breakdown for services supplied to U.S. persons and services supplied to foreign persons will be available by country and industry in BEA’s forthcoming release of the 2017 AMNE statistics. BEA has in the past collected the affiliation breakdown for services sold to foreign persons, most recently on the 2007 Benchmark Survey of Foreign Direct Investment in the United States, but has never before collected the affiliation breakdown for services sold to U.S. persons.