
A New Understanding of Small Businesses
Wages and Gross Output by Industry and Legal Form of Organization Using Firm Receipts to Classify Business Size, 1998–2003
There is no universal definition for “small business.” While number of employees is a popular metric, many small business statistics also use revenue, income, assets, or a combination of these characteristics to classify businesses by size (U.S. Census Bureau 2020; Organisation for Economic Co-operation and Development (OECD) 2018; Bandhiri and others 2019). In this paper, we use Internal Revenue Service (IRS) data categorized by firm-level receipts to estimate wages and gross output by business size, industry, and legal form of organization for 1998–2003. These statistics provide an alternative for understanding small business statistics compared to the Bureau of Economic Analysis (BEA) previous estimates of wages and gross output that use enterprise-level employment to classify business sizes1 (Highfill and Strassner 2017; Highfill and others 2020). Our break out of estimates by legal form of organization, including corporations, partnerships, and sole proprietors, provides an additional layer of detail to better understand the composition of small businesses.
In this paper, we define small businesses as firms with less than $10 million in receipts. We find most gross output and wages for small firms in 2003 were generated by corporations (64 percent of gross output and 71 percent of wages), followed by sole proprietorships (23 percent of gross output and 17 percent of wages), then partnerships (13 percent of gross output and 12 percent of wages). Gross output and wages for medium firms (between $10 million and $50 million in receipts) and large firms ($50 million and greater in receipts) were dominated by corporations and partnerships, with very little representation from sole proprietorships in any industry for 1998–2003. We also find using firm-level receipts to classify business size shows similar overall results to BEA's previous estimates of wages and gross output that used number of employees in an enterprise to classify business size (Highfill and Strassner 2017). Using both a receipts-based and employment-based definition to classify businesses by size, we find small businesses generated around 30 percent of private wages and gross output in 2002, while large businesses generated around 60 percent.
The following section provides a brief overview of the data and methods used in this report. Next, we summarize our estimates of 1998–2003 wages and gross output by business size, industry, and legal form. We then compare these results to BEA's previous estimates of 2002 wages and gross output by industry and business size that used employment-based size classifications. The final section provides additional context to our results and describes possibilities for future research. The full suite of our 1998–2003 estimates by size, industry, and legal form are available on BEA's small business website.
The main data source used in this paper is Statistics of Income (SOI) Integrated Business Data from IRS (IRS 2007). The “Table 2: Selected financial data on businesses” SOI data represent weighted estimates of various U.S. federal tax values aggregated by legal form, industry sector, and size of business receipts for 1998–2003. Data categorized by business size are only publicly available for this 6-year period. (See “Integrated business data, 2003” by Luttrell, Treubert, and Parisi (2006) for a detailed analysis of these data.) We use the variables “total receipts,” “costs of goods sold,” and “salaries and wages” for our analysis. Although the SOI data are broken into 10 size ranges based on size of business receipts, we collapse the smallest 3 ranges (receipts less than $25,000, $25,000–$99,999, and $100,000–$249,999) into a single category (receipts less than $250,000) because of the negligible and sometimes negative values that are common in these smallest size classes. The resulting eight size classes are firms with receipts less than $250,000, $250,000–$499,999, $500,000–$999,999, $1 million–$2.49 million, $2.5 million–$4.9 million, $5 million–$9.9 million, $10 million–$49.9 million, and $50 million and greater. Following the U.S. Treasury's Office of Tax Analysis (OTA) paper “Methodology to Identify Small Businesses” (2018) we classify businesses with less than $10 million in receipts as “small,” and the two remaining categories are classified as medium (between $10 million and $50 million in receipts) and large (receipts $50 million and greater).
BEA (2017) defines wages as money paid in regular intervals to employees by employers and gross output as receipts plus other operating income and inventory change. Therefore, we use the SOI variable “salaries and wages” as a proxy for wages and “total receipts” as a proxy for gross output. To make the SOI-based estimates consistent with BEA's official statistics, we proportionally distribute (“allocate”) BEA's private sector wages and gross output totals (BEA 2021a; BEA 2021b) to the SOI distribution of salaries and wages and total receipts disaggregated by industry and size of business receipts. Those results are then disaggregated further for each legal form (corporations, partnerships, and sole proprietorships) based on their relative share of salaries and wages and total receipts. For example, the SOI data show 34 percent of total receipts in the construction industry in 2003 were received by corporations with less than $10 million in receipts, so 34 percent of BEA's gross output total for the construction industry for that year is allocated to our “small corporations” category. Formally,
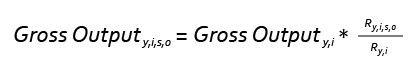
where y = year, i = industry, s = business size, o = legal form of organization, and R = total receipts. In the rare cases in which SOI receipts were negative, we set those values to zero prior to the second allocation by legal form. For margin industries (retail trade and wholesale trade), we subtract SOI “costs of goods sold” from total receipts to align with BEA's methodology for those sectors (BEA 2020) prior to the initial allocation of BEA totals. Gross output and wages are presented in nominal terms and are not adjusted for inflation. Finally, nonemployers receive proprietors' income, a category distinct from wages in BEA's national accounting framework and the SOI data. Therefore, while our gross output estimates include businesses with no employees at any point during the year, our wages estimates inherently exclude those nonemployers.
In the next two sections, we describe our results separately for gross output and wages. We initially focus on the estimates by size, industry, and legal form for 2003, the latest year available, before describing the areas that exhibit changes between 1998 and 2003. Within each subsection, we highlight industries in which the distribution of gross output or wages by size and legal form exhibit notable differences from the associated average distribution.
All businesses
Of overall gross output in 2003, corporations produced 80.7 percent, followed by partnerships with 12.8 percent, and sole proprietorships with 6.6 percent. Disaggregating by both legal form and business size, as illustrated in chart 1, we find the principal producer of private gross output was large corporations (firms with $50 million and greater in receipts), which generated 54.6 percent of overall gross output in 2003. This was followed by small corporations (firms with less than $10 million in receipts) and medium corporations (firms with between $10 million and $50 million in receipts), which generated 17.9 percent and 8.1 percent of total gross output, respectively. The largest noncorporate group in terms of output was large partnerships, generating 6.9 percent of overall output.

[Click chart to expand]
Almost all gross output for sole proprietorships was concentrated in small businesses (97.4 percent), followed distantly by medium businesses (1.7 percent) and large businesses (0.9 percent). For partnerships, 54.3 percent of gross output was attributable to large businesses, followed by small businesses with 29.1 percent and medium businesses with 16.6 percent. For corporations, 67.7 percent of gross output was generated by large businesses, followed by small businesses with 22.2 percent and medium businesses with 10.0 percent.
Small businesses (less than $10 million in receipts)
In 2003, small businesses produced 28.1 percent of overall gross output. Chart 2 shows among all small businesses, corporations produced the greatest share of output (63.9 percent), followed by sole proprietorships (22.8 percent) and partnerships (13.2 percent). Small businesses generated over 50 percent of output for six industries: other services (80.7 percent); real estate, rental, and leasing (59.1 percent); health care and social assistance (56.1 percent); agriculture, forestry, fishing, and hunting (excluding farms) (55.0 percent); educational services (52.0 percent); and construction (50.8 percent). The distribution of gross output by legal form for all industries is illustrated in chart 3. Highlights include the following:
- Unlike most small businesses, in the mining sector, small partnerships produced a relatively significant share of output. Among small mining businesses, 28.2 percent of output was produced by partnerships (more than twice the share compared to overall small businesses) and 51.5 percent was produced by corporations.
- In the manufacturing sector, small businesses skewed heavily toward corporations. Among small manufacturing businesses, 86.0 percent of output was produced by corporations, 22.1 percentage points higher than small businesses overall.
- The other services sector shows the greatest share of small business activity concentrated in sole proprietorships. In this sector, 34.7 percent of small business output was attributable to sole proprietorships. The sector also had one of the smallest shares of small business output going to partnerships (6.4 percent).

[Click chart to expand]

[Click chart to expand]
Medium businesses (between $10 million and $50 million in receipts)
In 2003, medium businesses produced 10.3 percent of overall gross output. Among medium businesses, corporations produced the largest share of output (78.4 percent), followed by partnerships (20.6 percent) and sole proprietorships (1.1 percent). The four industries with the greatest share of output for medium businesses include construction (20.9 percent); agriculture, forestry, fishing, and hunting (excluding farms) (17.3 percent); professional, scientific, and technical services (15.9 percent); and real estate, rental, and leasing (15.0 percent). Highlights include the following:
- Among medium businesses in the other services sector, corporations produced 91.7 percent of output. Similarly, among medium businesses in the educational services sector, corporations produced 91.4 percent of output.
- At the other end of the spectrum is the utilities sector, where only 34.6 percent of medium business output was produced by corporations and 65.4 percent by partnerships. Among medium businesses, it was the only sector in which corporations did not lead production.
- In the arts, entertainment, and recreation sector, sole proprietorships generated 7.5 percent of output—almost seven times the share of medium businesses overall.
Large businesses ($50 million and greater in receipts)
In 2003, large businesses produced 61.6 percent of overall gross output. Large businesses represented more than 80 percent of output for five industries: utilities (97.9 percent), management of companies (91.4 percent), manufacturing (88.0 percent), information (87.4 percent), and finance and insurance (87.2 percent). While corporations dominated production among small and medium businesses, the corporate share of output was greatest among large businesses. Corporations produced 88.6 percent of output, followed by partnerships (11.3 percent) and sole proprietorships (0.1 percent). Highlights include the following:
- In the arts, entertainment, and recreation sector, corporations produced 44.7 percent of output among large businesses—almost half the share compared to large businesses overall. Most of the output for this industry was produced by partnerships (55.3 percent).
- Corporations produced 68.2 percent of output in the professional, scientific, and technical services sector—20.4 percentage points less than large businesses overall. This sector also had the largest share attributed to sole proprietorships (0.5 percent).
- The management of companies sector had the highest concentration of corporate output, where corporations produced 98.3 percent of large business output.
Changes in gross output activity over time
Across the years 1998–2003, the output distribution remains relatively stable across the three size categories. The greatest shift within size categories is in large businesses, where the share of output increased from 60.2 percent in 1998 to 61.6 percent in 2003. We also see a reduction in the share of medium business output from 11.1 percent in 1998 to 10.3 percent in 2003, as well as a decline in small business output from 28.7 percent to 28.1 percent. A more significant shift is seen when we analyze legal form of organization. In 1998, corporations produced 84.8 percent of total gross output, dropping to 80.7 percent in 2003. Meanwhile, we see a rise in the share of partnerships' output over the same period from 8.7 percent in 1998 to 12.8 percent in 2003. The sole proprietorships' share remained stable at 6.5 percent in 1998 and 6.6 percent in 2003. Highlights include the following:
- Utilities. In 1998, large corporations produced 88.6 percent of the utilities sector output. In 2003, this share dropped over 11 percentage points to 77.4 percent. At the same time, large partnerships' share of utilities sector output almost tripled from 7.2 percent in 1998 to 20.5 percent in 2003.
- Educational services. In 1998, small corporations produced 55.6 percent of educational services output, declining to just 33.0 percent in 2003. At the same time, large corporations' share almost doubled from 17.1 percent in 1998 to 32.6 percent in 2003.
- Arts, entertainment, and recreation. In 1998, small corporations produced 30.7 percent of the output for this sector and small partnerships produced 18.9 percent. By 2003, those shares dropped to 25.2 percent for corporations and 7.4 percent for partnerships. Meanwhile, the share attributed to large partnerships more than tripled from 6.0 percent in 1998 to 21.6 percent in 2003.
All businesses
Of overall wages in 2003, corporations accounted for 84.1 percent, followed by partnerships with 10.6 percent and sole proprietorships with 5.3 percent. When we look at business size and legal form, we see large corporations produced the greatest share of overall wages at 52.3 percent (chart 4). The next largest share was attributable to small corporations, which produced 22.3 percent of wages, followed by medium corporations, which produced 9.5 percent. The biggest noncorporate category was small proprietorships, which accounted for 5.2 percent of wages in 2003.

[Click chart to expand]
For sole proprietorships, most wages were concentrated in small businesses (97.3 percent), similar to gross output. This was followed by medium businesses (2.1 percent) and large businesses (0.6 percent). For partnerships, 45.9 percent of wages were attributable to large businesses, followed by small businesses with 35.8 percent and medium businesses with 18.3 percent. For corporations, 62.2 percent of wages were generated by large businesses, followed by small businesses with 26.5 percent and medium businesses with 11.3 percent.
Small businesses (less than $10 million in receipts)
In 2003, small businesses accounted for 31.3 percent of overall wages. Chart 5 shows among small businesses, 71.2 percent of wages came from corporations, followed by 16.6 percent from sole proprietorships and 12.1 percent from partnerships. Small businesses represented over 50 percent of wages for four industries: other services (77.4 percent); construction (71.4 percent); agriculture, forestry, fishing, and hunting (excluding farms) (68.5 percent); and real estate, rental, and leasing (56.3 percent). The distribution of wages by legal form for all industries is illustrated in chart 6. Highlights include the following:
- Among small businesses in the construction sector, only 58.7 percent of wages were attributable to corporations—12.5 percentage points less than small businesses overall. Additionally, 36.5 percent of wages went to sole proprietorships, more than double the share of all small businesses.
- While corporations dominated small business wages, in the utilities sector, that dominance was most pronounced. Among small utilities businesses, corporations accounted for 90.1 percent of wages, followed by partnerships (9.9 percent) and sole proprietorships (0.0 percent).
- The sector in which we see the highest concentration of wages in partnerships was in the accommodation and food services sector, where 22.1 percent of wages was attributed to partnerships.

[Click chart to expand]

[Click chart to expand]
Medium businesses (between $10 million and $50 million in receipts)
In 2003, medium businesses accounted for 11.6 percent of overall wages. The four industries with the greatest share of wages attributable to medium businesses include educational services (19.2 percent); professional, scientific, and technical services (17.7 percent); arts, entertainment, and recreation (17.6 percent); and agriculture, forestry, fishing, and hunting (excluding farms) (16.1 percent). Looking within medium businesses, corporations made up the largest share of wages (82.3 percent), followed by partnerships (16.7 percent) and sole proprietorships (1.0 percent). Highlights include the following:
- Among medium utilities businesses, only 35.3 percent of wages was produced by corporations. The legal form with the greatest wage share was partnerships (64.7 percent). This was the only industry in which corporations did not account for the majority of wages.
- At the other end of the spectrum is the educational services sector, where wages were mostly concentrated within corporations. In this case, corporations made 93.3 percent of wages, with the remaining 6.7 percent going to partnerships and none to sole proprietorships.
- Sole proprietorships made up a tiny portion of medium businesses' wages and that was also true across all industries. The sector with the highest sole proprietorship share was in agriculture, forestry, fishing, and hunting (excluding farms), where sole proprietorships accounted for 3.6 percent of wages.
Large businesses ($50 million and greater in receipts)
In 2003, large businesses made up 57.2 percent of overall wages. Large businesses represented more than 80 percent of wages for four industries: utilities (94.7 percent), management of companies (91.4 percent), information (84.7 percent), and manufacturing (82.9 percent). Among large businesses, corporations accounted for 91.4 percent of wages, followed by partnerships (8.5 percent) and sole proprietorships (0.1 percent). Highlights include the following:
- In the arts, entertainment, and recreation industry, corporations accounted for only 48.6 percent of wages, a drastic difference from large businesses overall, where the share was 91.4 percent. The majority of wages in this sector came from partnerships (51.4 percent).
- Large professional, scientific, and technical services businesses also saw an above-average share of wages attributable to partnerships at 34.9 percent. Additionally, this sector had the largest share of wages attributable to sole proprietorships at 0.5 percent.
- While corporations clearly dominated the large business wage distribution, this disparity was most extreme in the management of companies sector. In this industry, corporations made up 99.2 percent of wages, with the remaining 0.8 percent going to partnerships.
Changes in wages over time
Across the years 1998–2003, the share of wages across business size remained fairly stable. For small businesses, the share of total wages decreased from 32.5 percent in 1998 to 31.3 percent in 2003. For medium businesses, the share decreased from 11.9 percent in 1998 to 11.6 percent in 2003. Finally, for large businesses, the wage share increased from 55.6 percent in 1998 to 57.2 percent in 2003. A more significant shift can be seen when we analyze legal form of organization. In 1998, corporations produced 86.2 percent of total wages. This share dropped to 84.1 percent in 2003. Meanwhile, we saw a rise in the share of partnerships' wages over the same period (7.8 percent in 1998 to 10.6 percent in 2003). The sole proprietorships' share dropped slightly from 6.0 percent in 1998 to 5.3 percent in 2003. Highlights include the following:
- Arts, entertainment, and recreation. One of the more significant shifts occurs in this sector, where we see a decline in wages for small corporations and partnerships and an increase in wages for large partnerships. In 1998, small corporations and small partnerships had a wage share of 32.0 percent and 25.8 percent, respectively. By 2003, those shares dropped to 24.9 percent and 8.1 percent. Meanwhile, the share for large partnerships grew from 4.0 percent in 1998 to 23.4 percent in 2003.
- Educational services. In this sector, there was a decline in wage shares for small corporations and an increase for large corporations. For small corporations, the wage share dropped from 65.7 percent in 1998 to 35.3 percent in 2003. At the same time, the wage share grew from 16.6 percent to 37.3 percent for large corporations.
- Construction. In this sector, small sole proprietorships experienced a drop in their wage share from 32.0 percent in 1998 to 26.0 percent in 2003. At the same time, wage shares for large corporations rose from 11.9 percent in 1998 to 14.8 percent in 2003.
BEA published estimates of small business gross output and wages by industry in two previous working papers (Highfill and Strassner 2017; Highfill and others 2020). In those papers, enterprise-level employment was used to characterize businesses as “small” instead of firm-level receipts used in this paper. This section describes how those previous estimates compare to our new estimates. Unfortunately, we cannot separate the differences caused by the employment-based and receipts-based size classifications from the differences caused by the enterprise and firm distinction. However, this distinction may not have a substantial impact on our results, based on research by Bureau of Labor Statistics economists. Sadeghi, Talan, and Clayton (2016) found that while there are large differences in job flow trends between the establishment-level data and firm-level data, this is not the case when comparing firm-level to enterprise-level data. Specifically, “First, gross job flows by size class at the enterprise level are very close to gross job flows at the firm level. Second, the gap between the two series is stable and does not change noticeably over time, making the patterns similar” (Sadeghi, Talan, and Clayton 2016). Additional research is underway at BEA to help determine the extent to which the enterprise versus firm distinction impacts BEA's estimates by business size.
We split the small business category into two groups to better compare to BEA's previous papers, which distinguished between “small” and “very small” businesses (table 1). Very small businesses in a previous analysis (Highfill and Strassner 2017) referred to enterprises with 0–19 employees and small businesses as enterprises with 20–99 employees. For our receipts-based size classes, we use $2.5 million as the cutoff to distinguish between very small and small businesses. We chose $2.5 million because this value corresponds most closely to the average receipts value for enterprises with 10–19 employees ($1.8 million) in the 2002 Statistics of U.S. Businesses data (table 2).
| Business size class | Firm-level receipts | Enterprise-level employment |
|---|---|---|
| Very small | Less than $2.5 million | Less than 20 |
| Small | $2.5 million–$9.9 million | 20–99 |
| Medium | $10 million–$49.9 million | 100–499 |
| Large | $50 million or greater | 500 or greater |
| Enterprise size (number of employees) |
Number of firms | Receipts (thousands of dollars) |
Average firm receipts |
|---|---|---|---|
| 0 | 770,041 | 215,139,058 | $279,386 |
| 1–4 | 2,695,606 | 937,533,365 | $347,801 |
| 5–9 | 1,010,804 | 888,342,543 | $878,847 |
| 10–19 | 613,880 | 1,085,595,864 | $1,768,417 |
| 20–99 | 508,249 | 2,884,696,648 | $5,675,755 |
| 100–499 | 82,334 | 2,547,423,855 | $30,940,120 |
| 500 or greater | 16,845 | 13,503,796,863 | $801,650,155 |
We also exclude the agriculture industry from our analysis to align with our previous estimates. We focus our comparison mainly on the “very small” and “large” categories since these two size classes represent the largest shares of wages and gross output (table 3). Data for the other two class sizes are available on BEA's small business website.
| Business size class | Receipts-Based size class share | Employment-Based size class share | Difference in shares |
|---|---|---|---|
| Gross output | |||
| Very small | 19 | 20 | −1 |
| Small | 9 | 12 | −3 |
| Medium | 11 | 11 | 0 |
| Large | 61 | 58 | 3 |
| Wages | |||
| Very small | 20 | 16 | 4 |
| Small | 11 | 17 | −6 |
| Medium | 12 | 14 | −2 |
| Large | 56 | 53 | 3 |
Note. See table 1 for size class values
Gross output
The distribution of gross output by business size using receipts-based business size classes and employment-based size classes are very close overall (table 3). Receipts-based size classes show very small businesses (firms with less than $2.5 million in receipts) represented 19 percent of total gross output in 2002, only 1 percentage point less than the share using employment-based size classes (20 percent). For all size classes, shares of gross output by business size are within 3 percentage points using both the receipts-based and employment-based size class definitions.
Comparing receipts-based and employment-based shares of gross output for very small businesses across industries, more than half of sectors have shares within 5 percentage points of each other (table 4). Shares in the professional, scientific, and technical services sector were the same for very small businesses (35 percent of gross output) and within 2 percentage points for large businesses using both the receipts- and employment-based size definitions. Other industries with similar gross output shares across all sizes include mining, information, and arts, entertainment, and recreation.
| Range of differences in shares | NAICS code | Sector | Share using receipts-based size classes | Share using employment-based size classes | Difference in shares |
|---|---|---|---|---|---|
| Very small businesses | |||||
| Within 5 percentage points (pp) | 21 | Mining | 9 | 8 | 2 |
| 22 | Utilities | 0 | 2 | −2 | |
| 31–33 | Manufacturing | 3 | 5 | −2 | |
| 42–45 | Wholesale and retail trade | 16 | 20 | −5 | |
| 51 | Information | 4 | 6 | −2 | |
| 52 | Finance and insurance | 4 | 6 | −2 | |
| 54 | Professional, scientific, and technical services | 35 | 35 | 0 | |
| 55 | Management of companies | 1 | 3 | −3 | |
| 71 | Arts, entertainment, and recreation | 36 | 34 | 2 | |
| Within 6–10 pp | 23 | Construction | 31 | 40 | −9 |
| 56 | Administrative and waste services | 30 | 23 | 7 | |
| 72 | Accommodation and food services | 33 | 23 | 10 | |
| More than 10 pp | 48–49 | Transportation and warehousing | 19 | 33 | −14 |
| 53 | Real estate, rental, and leasing* | 43 | 57 | −14 | |
| 61 | Educational services | 46 | 11 | 35 | |
| 62 | Health care and social assistance | 40 | 22 | 18 | |
| 81 | Other services | 70 | 53 | 17 | |
| Large businesses | |||||
| Within 5 pp | 21 | Mining | 74 | 78 | −4 |
| 51 | Information | 86 | 83 | 3 | |
| 53 | Real estate, rental, and leasing* | 27 | 26 | 1 | |
| 54 | Professional, scientific, and technical services | 34 | 36 | −2 | |
| 56 | Administrative and waste services | 46 | 51 | −5 | |
| 71 | Arts, entertainment, and recreation | 36 | 32 | 4 | |
| 72 | Accommodation and food services | 43 | 43 | 0 | |
| 81 | Other services | 10 | 14 | −3 | |
| Within 6–10 pp | 23 | Construction | 27 | 19 | 8 |
| 42-45 | Wholesale and retail trade | 61 | 53 | 8 | |
| 48-49 | Transportation and warehousing | 60 | 50 | 9 | |
| 52 | Finance and insurance | 88 | 81 | 6 | |
| 55 | Management of companies | 91 | 85 | 6 | |
| More than 10 pp | 22 | Utilities | 97 | 85 | 12 |
| 31–33 | Manufacturing | 86 | 75 | 12 | |
| 61 | Educational services | 28 | 57 | −29 | |
| 62 | Health care and social assistance | 28 | 54 | −26 | |
* Excludes owner-occupied housing
Note. See table 1 for size class values.
A few industries show differences in size class shares of more than 10 percentage points. In educational services, very small businesses represented 46 percent of gross output using receipts-based size classes, but only 11 percent of gross output when using employment-based size classes. Likewise, large businesses represented 28 percent of gross output in the educational services sector using receipts-based size classes, compared to 57 percent of gross output using employment-based size classes. The health care and social assistance sector shows a similar pattern. It is unclear if these differences are due to the receipts versus employment size classification, the enterprise versus firm distinction, or a mix of both.
Wages
The distribution of wages by business size using receipts-based and employment-based classifications is not as close as gross output, though shares across all size classes are within 6 percentage points of each other (table 3). Very small businesses represented 20 percent of wages in 2002 using the receipts-based size class, 4 percentage points higher than the share using employment-based size classes (16 percent). Small businesses show the opposite result—the share of wages attributable to small businesses using the receipts-based size class was 11 percent, compared to 17 percent using the employment-based size classification. If the very small and small categories are combined, the shares are much closer—31 percent using receipts-based size classes versus 33 percent using employment-based classes. This may suggest the $2.5 million receipts threshold for “very small” businesses may be more applicable when comparing gross output rather than wages.
Similar to gross output shares for very small businesses, more than half of sectors show wage shares are within 5 percentage points of each other (table 5). Across all business sizes, industries with similar wages shares using both receipts- and employment-based definitions include mining; information; real estate, rental, and leasing; and professional, scientific, and technical services. As with gross output, the two industries with the greatest differences in wages shares include educational services and health care and social assistance.
| Range of differences in shares | NAICS code | Sector | Share using receipts-based size classes | Share using employment-based size classes | Difference in shares |
|---|---|---|---|---|---|
| Very small businesses | |||||
| Within 5 percentage points (pp) | 21 | Mining | 16 | 11 | 5 |
| 22 | Utilities | 1 | 2 | −1 | |
| 31–33 | Manufacturing | 5 | 7 | −2 | |
| 48–49 | Transportation and warehousing | 13 | 11 | 1 | |
| 51 | Information | 6 | 6 | −1 | |
| 52 | Finance and insurance | 7 | 9 | −2 | |
| 53 | Real estate, rental, and leasing | 36 | 33 | 4 | |
| 54 | Professional, scientific, and technical services | 26 | 26 | 1 | |
| 55 | Management of companies | 0 | 1 | 0 | |
| 71 | Arts, entertainment, and recreation | 27 | 23 | 3 | |
| Within 6–10 pp | 42–45 | Wholesale and retail trade | 11 | 19 | −8 |
| More than 10 pp | 23 | Construction | 54 | 32 | 21 |
| 56 | Administrative and waste services | 27 | 13 | 14 | |
| 61 | Educational services | 37 | 7 | 30 | |
| 62 | Health care and social assistance | 31 | 18 | 12 | |
| 72 | Accommodation and food services | 31 | 17 | 14 | |
| 81 | Other services | 64 | 43 | 21 | |
| Large businesses | |||||
| Within 5 pp | 21 | Mining | 65 | 63 | 2 |
| 23 | Construction | 17 | 18 | −1 | |
| 51 | Information | 83 | 77 | 5 | |
| 53 | Real estate, rental, and leasing | 29 | 33 | −5 | |
| 54 | Professional, scientific, and technical services | 39 | 38 | 1 | |
| 55 | Management of companies | 92 | 90 | 2 | |
| 72 | Accommodation and food services | 43 | 44 | −1 | |
| 81 | Other services | 12 | 17 | −5 | |
| Within 6–10 pp | 22 | Utilities | 95 | 88 | 7 |
| 48–49 | Transportation and warehousing | 71 | 65 | 6 | |
| 52 | Finance and insurance | 79 | 73 | 6 | |
| 56 | Administrative and waste services | 51 | 60 | −9 | |
| 71 | Arts, entertainment, and recreation | 37 | 30 | 7 | |
| More than 10 pp | 31–33 | Manufacturing | 82 | 63 | 18 |
| 42–45 | Wholesale and retail trade | 64 | 47 | 16 | |
| 61 | Educational services | 34 | 58 | −25 | |
| 62 | Health care and social assistance | 31 | 53 | −22 | |
Note. See table 1 for size class values.
Summary
Compared to BEA's previous estimates of gross output and wages that use number of employees in a business to determine size classes, these new estimates that use receipts to classify size are overall very close. In both cases, our results show that large businesses generated around 60 percent of private gross output and wages in 2002, while small businesses generated around 30 percent of this economic activity. Some industries, such as professional, scientific, and technical services, show that the distribution of wages and gross output by size are essentially the same, using either receipts or number of employees to classify business size. However, the distribution of wages and gross output by size using receipts-based size classes were very different for a few industries, such as educational services and health care and social assistance. It is unclear to what extent these differences are due to using receipts instead of employment to classify business size or due to the unit of analysis in the SOI receipts-based data (firm) versus the employment-based Census data (enterprise).
Defining a small business involves making decisions about a number of factors, including the unit of analysis (for example, establishments, firms, or enterprise), the variable used to classify businesses by size (for example, number of employees in a business or business receipts), and the numerical value delineating small businesses from nonsmall businesses (for example, less than 100 employees or less than $10 million in receipts). Data availability can determine which business characteristics are used to identify small businesses. Data from IRS, such as the SOI data used in this paper, typically do not include employment values, so financial variables such as receipts size or asset size are used to categorize businesses by size. The business characteristics used to classify small businesses are sometimes determined by an organization's goal, as is the case with the Small Business Administration (SBA) loan program. The SBA in many cases uses employment to determine if a business is small and therefore eligible for a loan (U.S. Small Business Administration 2018). However, the SBA also uses revenue to identify small businesses for certain capital-intensive industries that have few employees and high revenue, such as construction (Kobe 2012). This paper shows that using employment or receipts to categorize businesses by size class often results in similar outcomes, though variability is seen across some industries.
These estimates represent BEA's first set of wages and gross output disaggregated by business size and legal form of organization. We find most economic activity for small firms in 2003 was generated by corporations (64 percent of gross output and 71 percent of wages), followed by sole proprietorships (23 percent of gross output and 17 percent of wages) and partnerships (13 percent of gross output and 12 percent of wages). Gross output and wages for medium and large firms for 1998–2003 were dominated by corporations and partnerships, with trivial representation from sole proprietorships in any industry; over 95 percent of sole proprietors' wages and gross output were generated by small businesses.
While most relationships did not change drastically over the 6-year study period, we see an increase in overall shares of wages and gross output attributable to corporations and partnerships, possibly reflecting changes in the tax code between 1998 and 2003. Tax cuts in 2001 lowered rates for individuals, and therefore for passthrough entities, or businesses where income flows to owners, which includes partnerships (DeBacker and Prisinzano 2015). Since these tax cuts further increased the divide between corporate and noncorporate tax rates during the period, this may explain the overall increase in shares of wages and gross output for partnerships between 1998 and 2003 (from 7.8 percent to 10.6 percent for wages and 8.7 percent to 12.8 percent for gross output) and decreasing shares for corporations (from 86.2 percent to 84.1 percent for wages and 84.8 percent to 80.7 percent for gross output).
Our estimates that use firm-level receipts to classify business size provide a new lens to view small business statistics compared to previous estimates that used employment to categorize business sizes. While these public IRS data are useful to understand certain economic activity across industries and business sizes for 1998–2003, additional and more timely data are needed for a comprehensive understanding of economic activity for small businesses. BEA is currently researching other ways to estimate small business statistics including using different size classes, datasets, and business characteristics. We invite all interested data users to send feedback about these estimates or suggestions for future research to SmallBusiness@bea.gov.
BEA. 2020. NIPA Handbook: Concepts and Methods of the U.S. National Income and Product Accounts. Suitland, MD: BEA, December.
BEA. 2021. Wages and Gross Output by Industry.
BEA. 2021a. “Gross Output by Industry.”
BEA. 2021b. “Table 6.3D. Wages and Salaries by Industry.”
Bhandari, Anmol, Serdar Birinci, Ellen McGrattan, and Kurt See. 2019. “What Do Survey Data Tell Us About US Businesses?” Working paper 26063. Cambridge, MA: National Bureau of Economic Research, July.
DeBacker, Jason and Richard Prisinzano. 2015. “The Rise of Partnerships.” Tax Notes 147 (13): 1563–1575.
Highfill, Tina and Erich Strassner. 2017. Experimental Estimates of Wages and Gross Output by Business Size and Industry, 2002–2012. Washington, DC: BEA, December.
Highfill, Тina, Richard Cao, Richard Schwinn, Richard Prisinzano, and Danny Leung. 2020. “Measuring the Small Business Economy.” Working paper WP2020–4. Suitland, MD: BEA, March.
IRS. 2007. “SOI Tax Stats - Integrated Business Data: Table 2: Selected financial data on businesses.”
Luttrell, Kelly, Patrice Treubert, and Michael Parisi. 2006. “Integrated Business Data, 2003.” SOI Bulletin 26 (2): 47-56.
OECD. 2018. Financing SMEs and Entrepreneurs 2018: An OECD Scoreboard. Paris: OECD Publishing, February.
Prisinzano, Richard, Jason DeBacker, John Kitchen, Matthew Knittel, Susan Nelson, and James Pearce. 2018. “Methodology to Identify Small Businesses.” Technical paper 4. Washington, DC: OTA, December.
Sadeghi, Akbar, David Talan, and Richard Clayton. 2016. “Establishment, firm, or enterprise: does the unit of analysis matter?” Monthly Labor Review (November).
U.S. Census Bureau. 2017. “Annual Datasets by Establishment Industry.”
- An enterprise includes one or more establishments under common ownership that can consist of multiple firms and is a distinction made by the U.S. Census Bureau. A firm is one or more establishments (business location) that share an employer identification number assigned by IRS for tax purposes.