Revisions to Estimation Methods for Regional Price Parities
Updates Back to 2008
In December 2021, the Bureau of Economic Analysis (BEA) released new estimates of regional price parities (RPPs) for 2020 and revised estimates for 2008 to 2019. These included the first major revisions to estimation methods since the RPPs were officially introduced in 2014.
The release included two additional series estimated using the RPPs. The first, real personal consumption expenditures (PCE) for states, was released for the first time and covers 2008 to 2020. Also released was real personal income for states, portions, and metropolitan areas. These included new estimates for 2020 and revised estimates for 2008 to 2019.
RPPs are price indexes that measure geographic price level differences for one period within the United States. For example, if the RPP for Washington, DC, is 120, prices there are on average 20 percent higher than the U.S. average. BEA estimates of real personal consumption and real personal income consist of their respective current-dollar estimates adjusted by the RPPs and converted to constant dollars using the U.S. PCE price index.
The RPPs mainly use price and expenditure-related survey data collected by U.S. federal government agencies including Consumer Price Index (CPI) survey data from the Bureau of Labor Statistics (BLS), Public Use Microdata Sample (PUMS) data from the Census Bureau American Community Survey (ACS), and PCE by state data from BEA. These data sources are estimated for distinct sets of geographies that are reconciled by allocating all of them to the county level. The reconciliation uses either housing units or income shares as the distributional assumption.
The CPI data are price observations classified into item strata consisting of detailed goods and services categories within broad expenditure classes such as food, apparel, transport, housing, education, recreation, medical, and other. They are sampled throughout the year in 32 index areas. For strata with a high relative importance, that is, with larger expenditure weights in the average U.S. consumption basket, such as motor vehicles and gasoline, we estimate index area means that control for detailed characteristics of the item strata. For strata with smaller weights, we use a shortcut method controlling for broader characteristics.
ACS PUMS data are individual housing unit observations sampled annually for Public Use Microdata Areas (PUMAs). Tenant rents are observed directly, and area means are stratified by structure type, number of rooms, number of bedrooms, and age of the unit.
PCE by state is a household consumption measure that reflects the value of the goods and services purchased by, or on behalf of, households by state of residence. The Economic Census from the Census Bureau and the Quarterly Census of Employment and Wages from BLS are the primary data sources for the majority of the PCE series. For those remaining, additional annual state-level data sources are used, including the ACS for housing and utilities.
The RPPs are derived using a multilateral price aggregation index that combines the CPI price relatives for goods and services, the ACS PUMS price relatives and expenditures for housing, and expenditure weights from the PCE by state series. They are used in combination with the U.S. PCE price index to produce regional estimates of real PCE and personal income. The series are adjusted using the RPPs to control for regional price level differences and then divided by the U.S. PCE price index to obtain constant-dollar estimates.
RPPs released in December 2021 incorporated methodology and presentational revisions as described below.1
The adoption of PCE-based weights in place of CPI cost weights. This revision is based on experimental estimates published in September 2020 replacing expenditure weights from the CPI program with weights from BEA’s PCE by state series.2 The change creates consistency in the treatment of the real PCE series, with both prices and adjusted expenditures estimated simultaneously. Their use increases transparency because state PCE data are directly observed for all states and publicly available.
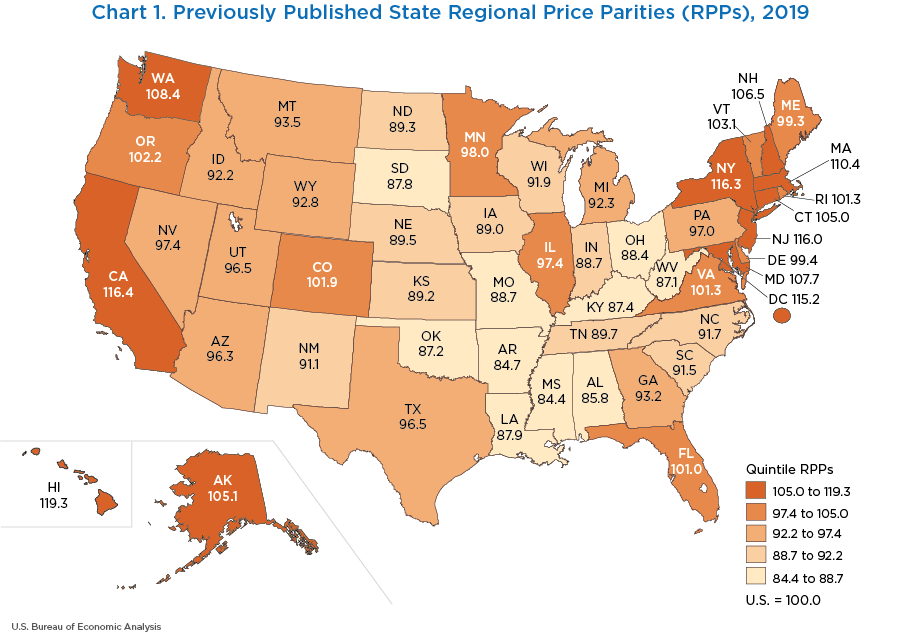
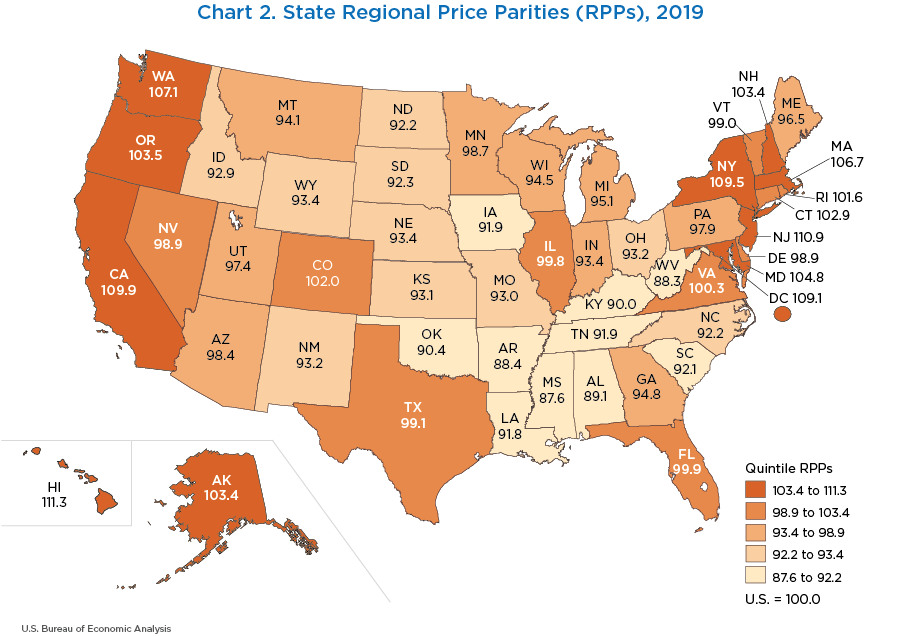
The adoption of PCE-based weights reduces the range of RPPs across regions. In 2019, the range narrows from 34.9 index points using CPI weights to 23.7 using PCE-based weights (table 1). Although the range of the RPPs decreases, their rankings remain similar, as seen when the results are arrayed in maps by quintile (charts 1 and 2).
The narrowing of the RPP range occurs for several reasons. While each CPI cost weight category has a corresponding regional price series, some PCE categories do not, because they are excluded from the CPI. These include expenditures on life insurance and gambling. For others, such as hospitals and physician services, the corresponding CPI series are highly variable (see item 4 below). In both cases, the PCE categories are assigned a national price level that does not vary across regions, reducing the RPP range.
The range is also reduced because the share of housing rents in the PCE-based weights is smaller than in the CPI weights. In 2019 for example, housing rents made up 30 percent of the CPI weights but only 16 percent of the PCE-based weights. Housing rents have the widest price variability across expenditure categories, so decreasing their share also decreases the range of the RPPs.
Weight shares also shift due to conceptual differences. PCE includes both out-of-pocket purchases by consumers as well as expenditures made on behalf of households, while the CPI weights only include out-of-pocket purchases. As a result, categories such as medical goods and services make up a larger share of PCE-based weights than they do of CPI cost weights.
The introduction of housing data from the ACS PUMS. As part of the July 2021 annual update of the National Income and Product Accounts and subsequent revisions to the industry and regional accounts, BEA has implemented improvements in source data and the methodology for annual current-dollar estimates of housing services expenditures on tenant- and owner-occupied housing.3 The new methodology utilizes microdata on housing units from the ACS, which is an annual survey that replaced the long-form decennial census questions on housing. Estimates are based on the ACS PUMS, and the resulting expenditures for housing are used for estimating the RPPs.
The use of annual CPI and ACS data instead of multiyear moving averages. In the past, the estimation of RPPs used multiyear rolling averages to blend the CPI and the ACS confidential microdata, creating a multitiered system with 1-, 3-, and 5-year averages depending on the level of spatial aggregation—state, metropolitan statistical area, or portions of states. Annual estimates were revised until centered on the midpoint of the multiyear rolling average.
In conjunction with BEA’s new housing expenditures, the RPPs for housing rents and utilities were estimated on an annual basis at the smallest geographic level possible, that is, for PUMAs consisting of areas with a minimum population threshold of 100,000. By using annual CPI results instead of 5-year averages, we eliminate the need for the rolling estimates in a multitiered aggregation system.
The use of annual data and PUMA-level geographies increases the range of the housing rent RPPs and increases the variability of the goods and other services RPPs.
The removal of highly variable CPI item strata. Now that the RPPs use annual CPI data, price levels for seven item strata were removed from the estimation process because of the volatility and high standard errors in their annual results. These factors make it difficult to obtain consistent estimates of their relative price levels across years. For these categories, a national price level has been assigned that is uniform across all regions.
Three of the item strata are medical categories covering hospitals, physician services, and prescription drugs. Although they have high relative importance, these CPI data are not consistent with BEA's national medical price index, and both BEA and BLS are pursuing alternative data sources for medical goods and services.
The remaining item strata are highly heterogenous with relatively few observations. These include three education categories covering college tuition, elementary and high school tuition, and childcare and nursery school fees. The fourth is a recreation category for club membership for shopping clubs and fraternal or other organizations.
The removal of these item strata narrows the range of the RPPs, particularly for other services.
The change in presentation of real personal income results. In previous releases, the results were presented in “chained dollars” for consistency with real series published at BEA that use chain-type methods. However, the regional results for real personal income have never been individually chained and are now referred to as “constant-dollar” estimates.
| State | Regional Price Parities | |
|---|---|---|
| Previously Published | Current | |
| United States | 100.0 | 100.0 |
| Alabama | 85.8 | 89.1 |
| Alaska | 105.1 | 103.4 |
| Arizona | 96.3 | 98.4 |
| Arkansas | 84.7 | 88.4 |
| California | 116.4 | 109.9 |
| Colorado | 101.9 | 102.0 |
| Connecticut | 105.0 | 102.9 |
| Delaware | 99.4 | 98.9 |
| District of Columbia | 115.2 | 109.1 |
| Florida | 101.0 | 99.9 |
| Georgia | 93.2 | 94.8 |
| Hawaii | 119.3 | 111.3 |
| Idaho | 92.2 | 92.9 |
| Illinois | 97.4 | 99.8 |
| Indiana | 88.7 | 93.4 |
| Iowa | 89.0 | 91.9 |
| Kansas | 89.2 | 93.1 |
| Kentucky | 87.4 | 90.0 |
| Louisiana | 87.9 | 91.8 |
| Maine | 99.3 | 96.5 |
| Maryland | 107.7 | 104.8 |
| Massachusetts | 110.4 | 106.7 |
| Michigan | 92.3 | 95.1 |
| Minnesota | 98.0 | 98.7 |
| Mississippi | 84.4 | 87.6 |
| Missouri | 88.7 | 93.0 |
| Montana | 93.5 | 94.1 |
| Nebraska | 89.5 | 93.4 |
| Nevada | 97.4 | 98.9 |
| New Hampshire | 106.5 | 103.4 |
| New Jersey | 116.0 | 110.9 |
| New Mexico | 91.1 | 93.2 |
| New York | 116.3 | 109.5 |
| North Carolina | 91.7 | 92.2 |
| North Dakota | 89.3 | 92.2 |
| Ohio | 88.4 | 93.2 |
| Oklahoma | 87.2 | 90.4 |
| Oregon | 102.2 | 103.5 |
| Pennsylvania | 97.0 | 97.9 |
| Rhode Island | 101.3 | 101.6 |
| South Carolina | 91.5 | 92.1 |
| South Dakota | 87.8 | 92.3 |
| Tennessee | 89.7 | 91.9 |
| Texas | 96.5 | 99.1 |
| Utah | 96.5 | 97.4 |
| Vermont | 103.1 | 99.0 |
| Virginia | 101.3 | 100.3 |
| Washington | 108.4 | 107.1 |
| West Virginia | 87.1 | 88.3 |
| Wisconsin | 91.9 | 94.5 |
| Wyoming | 92.8 | 93.4 |
| Maximum | 119.3 | 111.3 |
| Minimum | 84.4 | 87.6 |
| Range | 34.9 | 23.7 |
- For a full description of the methodologies for RPPs and other BEA series, see the methodology page on the BEA website.
- For more information on the experimental estimates, see Bettina H. Aten, Christian Awuku-Budu, Eric B. Figueroa, Joshua Ingber, and Bryan Vengelen, “Experimental Estimates of PCE-Weighted Regional Price Parities and Real PCE by State,” Survey of Current Business 100 (September 2020).
- For more information on the new housing measures, see Dylan Rassier, Bettina H. Aten, Eric B. Figueroa, Solomon Kublashvili, Brian J. Smith, and Jack York, “Improved Measures of Housing Services for the U.S. Economic Accounts,” Survey 101 (May 2021) and Alex Adams, Bettina Aten, Eric Figueroa, Solomon Kublashvili, Krishna Parajuli, Albert Yoon, and Jack York, “Preview of the 2021 Annual Update of the Regional Economic Accounts,” Survey 101 (July 2021).

