
Government Receipts and Expenditures
Fourth Quarter 2021
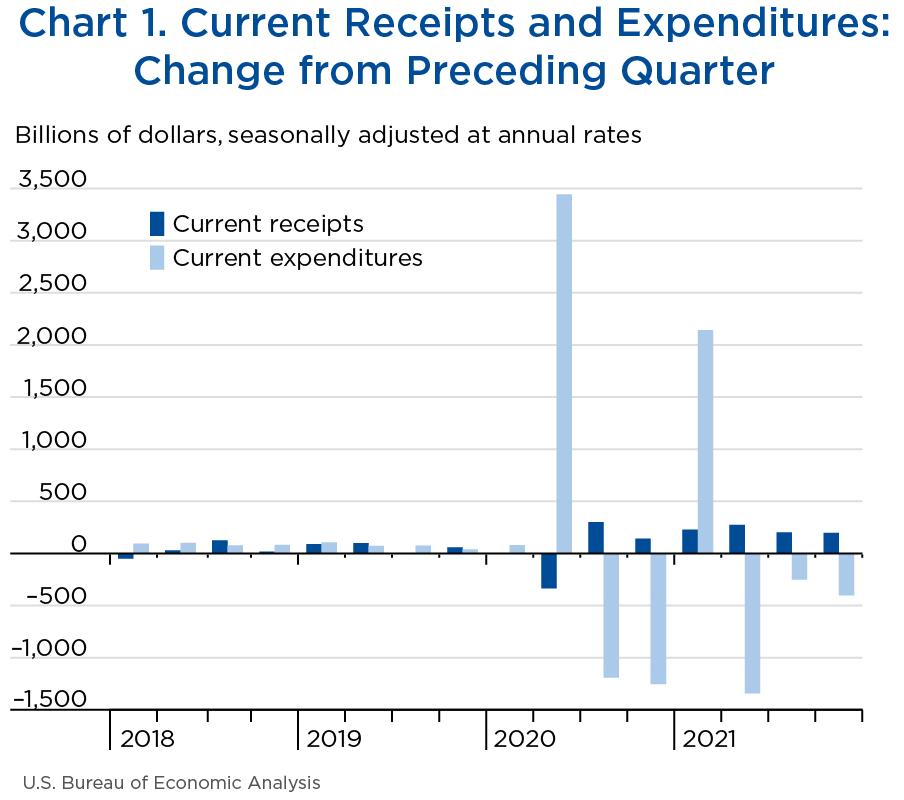
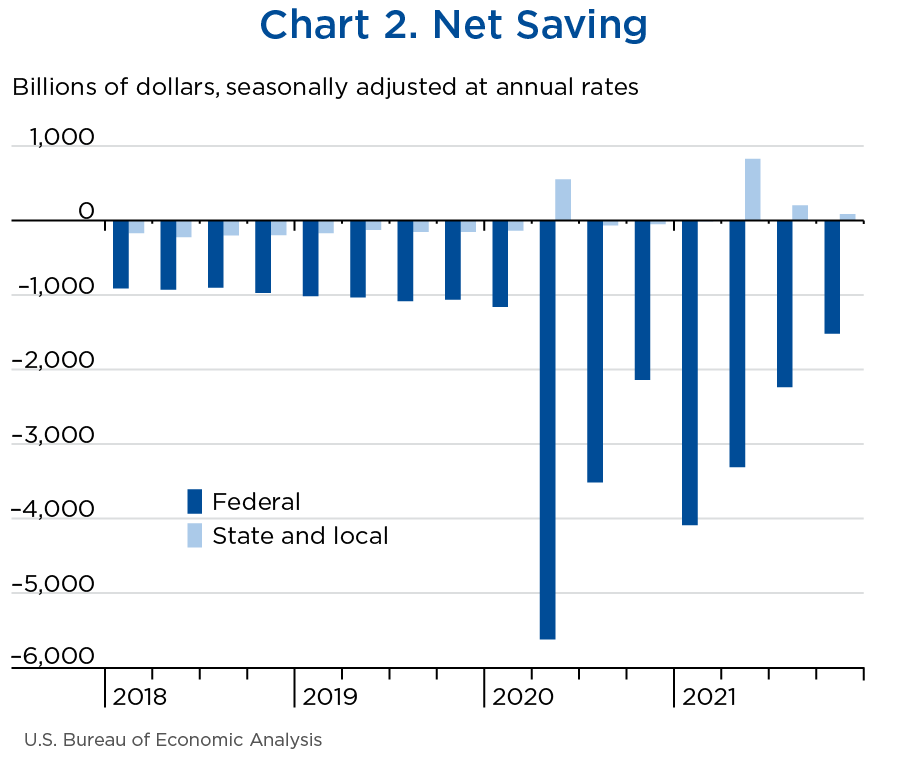
Net government saving, the difference between current receipts and current expenditures in the federal government and state and local governments, was −$1,431.2 billion in the fourth quarter of 2021, increasing $598.8 billion from −$2,030.0 billion in the third quarter of 2021 (charts 1 and 2 and table 1).
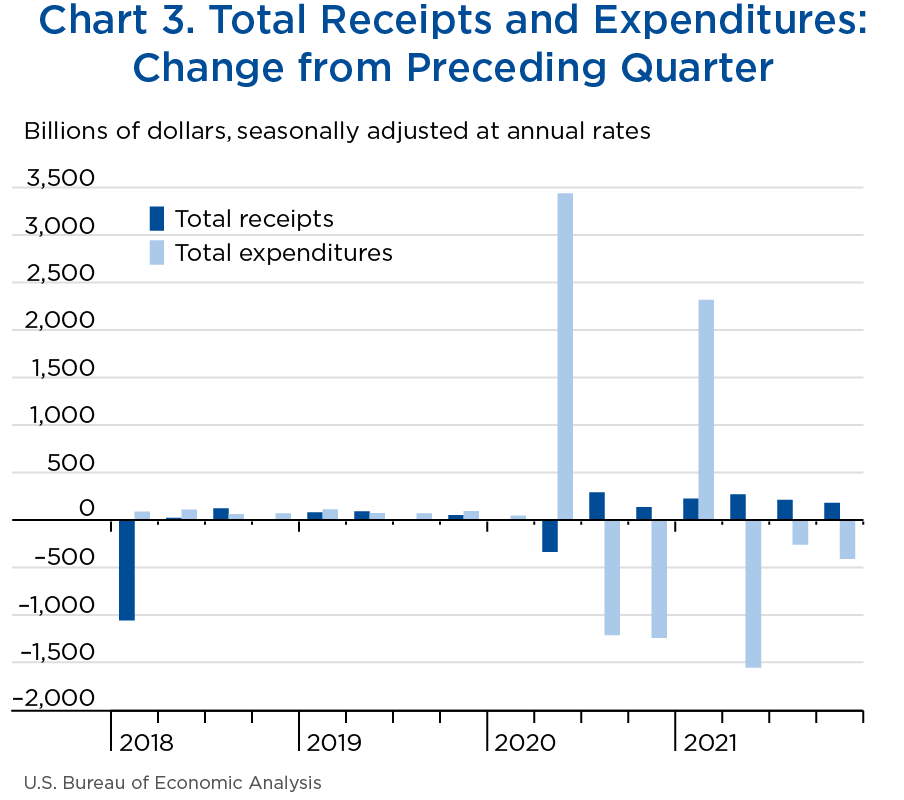
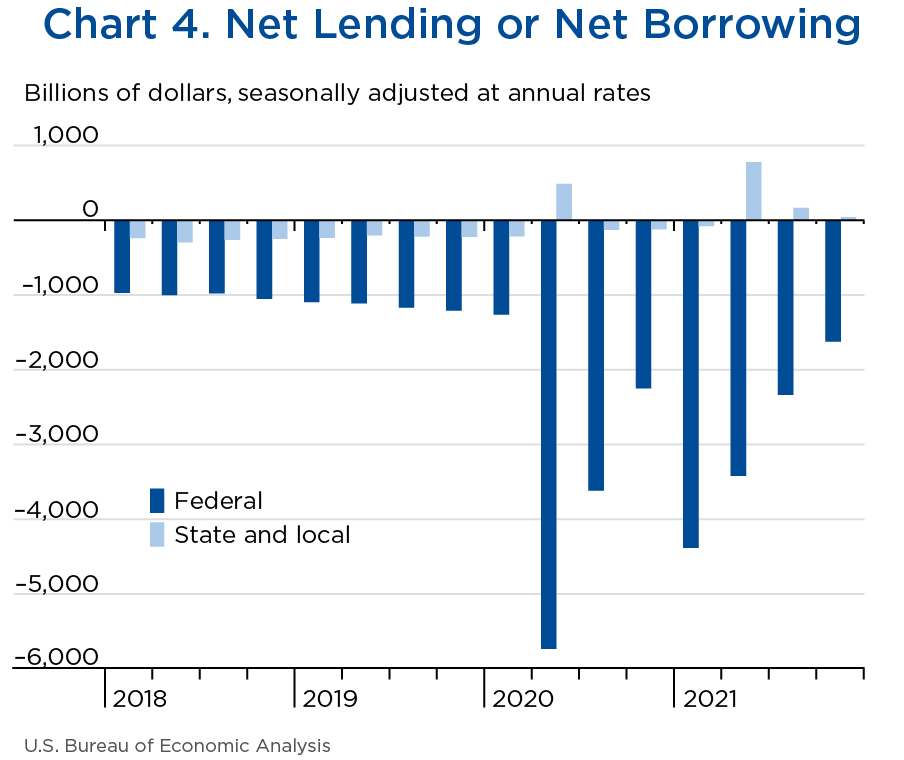
“Net lending or net borrowing (−)” is an alternative measure of the government fiscal position. Net borrowing is the financing requirement of the government sector, and it is derived as net government saving plus the consumption of fixed capital and net capital transfers received less gross investment and net purchases of nonproduced assets.
Net borrowing was $1,584.4 billion in the fourth quarter, decreasing $587.6 billion from $2,172.0 billion in the third quarter (charts 3 and 4 and table 1).
[Click chart to expand]
[Click chart to expand]
[Click chart to expand]
[Click chart to expand]
| Line | Level | Change from preceding quarter | ||||
|---|---|---|---|---|---|---|
| 2021 | ||||||
| IV | I | II | III | IV | ||
| 1 | Current receipts | 6,976.0 | 229.5 | 275.2 | 202.4 | 196.6 |
| 2 | Current expenditures | 8,407.1 | 2,141.9 | −1,341.6 | −251.5 | −402.3 |
| 3 | Net government saving | −1,431.2 | −1,912.3 | 1,616.6 | 454.0 | 598.8 |
| 4 | Federal | −1,517.1 | −1,948.8 | 776.2 | 1,077.1 | 718.5 |
| 5 | State and local | 85.9 | 36.4 | 840.5 | −623.1 | −119.7 |
| 6 | Net lending or net borrowing (−) | −1,584.4 | −2,088.2 | 1,821.0 | 469.4 | 587.6 |
| 7 | Federal | −1,625.2 | −2,134.0 | 964.5 | 1,081.3 | 712.7 |
| 8 | State and local | 40.8 | 45.8 | 856.6 | −612.0 | −125.1 |
Net federal government saving was −$1,517.1 billion in the fourth quarter, increasing $718.5 billion from −$2,235.6 billion in the third quarter (table 2). In the fourth quarter, current receipts decelerated and current expenditures decreased less relative to the third quarter.
Federal government net borrowing was $1,625.2 billion in the fourth quarter, decreasing $712.7 billion from $2,337.9 billion in the third quarter.
- Personal current taxes (line 3) decelerated in the fourth quarter, reflecting a deceleration in nonwithheld taxes. The deceleration in nonwithheld taxes reflected a deceleration in declarations and final settlements.
- Taxes on production and imports (line 4) turned up in the fourth quarter. Customs duties turned up in the fourth quarter, increasing $5.3 billion after decreasing $3.9 billion in the third quarter, primarily reflecting an acceleration in the volume of imports. Excise taxes also turned up, reflecting an upturn in taxes on alcoholic beverages due to lower refunds.
- Taxes on corporate income (line 5) turned down in the fourth quarter, reflecting a deceleration in corporate profits.
- Contributions for government social insurance (line 7) decelerated in the fourth quarter, reflecting the pattern of wages.
- Income receipts on assets (line 8) decelerated in the fourth quarter, reflecting a deceleration in dividends from Federal Reserve banks that was partially offset by an upturn in interest receipts.
- Current transfer receipts (line 9) turned up in the fourth quarter, reflecting upturns in current transfer receipts from the rest of the world and current transfer receipts from business. The upturn in current transfer receipts from the rest of the world reflects an increase in fines paid by foreign businesses. The upturn in current transfer receipts from business reflected an upturn in deposit insurance premiums.
- National defense consumption expenditures (line 13) turned down in the fourth quarter, reflecting a larger decrease in defense services.
- Nondefense consumption expenditures (line 14) turned up in the fourth quarter. Spending for nondurable goods turned up, reflecting an acceleration in spending on COVID–19 vaccines. Nondefense services decreased less, reflecting a continued decrease in Paycheck Protection Program (PPP) loan process fees, which were boosted in the second quarter.
- Government social benefits to persons (line 17) decreased less in the fourth quarter, decreasing $200.0 billion after decreasing $236.0 billion in the third quarter. The smaller decrease in the fourth quarter reflects a smaller decrease in economic impact payments to individuals as provisions of several federal programs tapered off or expired in December 2021. Unemployment benefits decreased more in the fourth quarter, reflecting the expiration, on September 4, 2021, of the temporary weekly supplemental payment of $300 to persons receiving unemployment benefits. The child tax credit prepayments that began in July decelerated; these prepayments, which were scheduled through the end of 2021, were enacted by the American Rescue Plan Act. These decreases were partially offset by an acceleration in transfers to nonprofits, reflecting an acceleration in transfers from the Public Health and Social Services Emergency Fund.
- Grants-in-aid to state and local governments (line 20) decreased less in the fourth quarter, reflecting the pattern of spending for various COVID–19 response efforts appropriated through the Coronavirus Response and Relief Supplemental Appropriations (CRRSA) Act and the American Rescue Plan Act. General economic and labor affairs grants decreased less, reflecting decreased funding from the Coronavirus State and Local Fiscal Recovery Funds to help state and local governments bridge budget shortfalls.
- Other current transfer payments to the rest of the world (line 21) turned down in the fourth quarter. Third-quarter transfer payments were boosted by economic support payments to international organizations to fight COVID–19 and other diseases.
- Interest payments (line 22) accelerated in the fourth quarter, reflecting an acceleration in interest paid on Treasury Inflation-Protected Securities.
- Subsidies (line 23) decreased more in the fourth quarter, reflecting a decrease in spending authorized by pandemic response programs. Notably, PPP loans to businesses continued to decrease after loans were boosted in the second quarter by provisions of the CRRSA Act. Restaurant revitalization subsides turned down, reflecting a decrease in emergency assistance to eligible restaurants affected by the pandemic. Air carrier subsides decreased less in the fourth quarter, reflecting the continued decrease in payroll support payments to airlines as this program winds down. Subsidies related to the Public Health and Social Services Emergency Fund accelerated.
- Capital transfer payments (line 33) turned down. Third-quarter capital transfer payments were boosted by disaster-related National Flood Insurance Program payments for insurance settlements related to Hurricane Ida.
| Line | Level | Change from preceding quarter | ||||
|---|---|---|---|---|---|---|
| 2021 | ||||||
| IV | I | II | III | IV | ||
| 1 | Current receipts | 4,446.4 | 167.5 | 195.2 | 147.0 | 121.6 |
| 2 | Current tax receipts | 2,606.7 | 147.0 | 134.3 | 96.7 | 81.7 |
| 3 | Personal current taxes | 2,115.8 | 115.0 | 94.2 | 89.9 | 79.8 |
| 4 | Taxes on production and imports | 178.3 | 9.6 | 11.6 | −4.9 | 5.4 |
| 5 | Taxes on corporate income | 281.2 | 21.3 | 28.6 | 10.9 | −4.7 |
| 6 | Taxes from the rest of the world | 31.4 | 1.1 | −0.1 | 1.0 | 1.1 |
| 7 | Contributions for government social insurance | 1,630.1 | 31.9 | 37.8 | 38.7 | 35.7 |
| 8 | Income receipts on assets | 153.2 | −6.8 | 29.5 | 11.1 | 3.1 |
| 9 | Current transfer receipts | 57.5 | −3.8 | −6.1 | −1.1 | 1.9 |
| 10 | Current surplus of government enterprises | −1.0 | −0.8 | −0.3 | 1.6 | −0.7 |
| 11 | Current expenditures | 5,963.5 | 2,116.2 | −580.9 | −930.1 | −596.9 |
| 12 | Consumption expenditures | 1,195.6 | 55.8 | −11.8 | −12.0 | −0.5 |
| 13 | National defense | 707.6 | −6.1 | 2.6 | 0.3 | −2.7 |
| 14 | Nondefense | 488.1 | 62.0 | −14.5 | −12.3 | 2.3 |
| 15 | Current transfer payments | 3,921.7 | 2,284.3 | −863.7 | −783.3 | −376.5 |
| 16 | Government social benefits | 2,964.0 | 2,240.1 | −1,705.7 | −237.0 | −200.7 |
| 17 | To persons | 2,936.3 | 2,231.5 | −1,698.3 | −236.0 | −200.0 |
| 18 | To the rest of the world | 27.7 | 8.6 | −7.4 | −1.0 | −0.7 |
| 19 | Other current transfer payments | 957.7 | 44.4 | 842.0 | −546.4 | −175.8 |
| 20 | Grants-in-aid to state and local governments | 904.2 | 38.5 | 850.7 | −575.1 | −152.9 |
| 21 | To the rest of the world | 53.5 | 5.9 | −8.7 | 28.7 | −22.9 |
| 22 | Interest payments | 541.5 | −9.2 | 1.3 | 7.8 | 29.9 |
| 23 | Subsidies | 304.7 | −214.8 | 293.2 | −142.5 | −249.8 |
| 24 | Net federal government saving | −1,517.1 | −1,948.8 | 776.2 | 1,077.1 | 718.5 |
| 25 | Social insurance funds | −362.1 | −244.9 | 119.8 | 228.4 | 238.6 |
| 26 | Other | −1,154.9 | −1,703.9 | 656.4 | 848.7 | 480.0 |
| Addenda: | ||||||
| 27 | Total receipts | 4,471.5 | 168.2 | 195.8 | 149.3 | 123.4 |
| 28 | Current receipts | 4,446.4 | 167.5 | 195.2 | 147.0 | 121.6 |
| 29 | Capital transfer receipts | 25.0 | 0.9 | 0.5 | 2.3 | 1.7 |
| 30 | Total expenditures | 6,096.6 | 2,302.2 | −768.6 | −932.1 | −589.4 |
| 31 | Current expenditures | 5,963.5 | 2,116.2 | −580.9 | −930.1 | −596.9 |
| 32 | Gross government investment | 370.5 | 0.5 | 6.4 | 10.8 | 4.6 |
| 33 | Capital transfer payments | 91.4 | 207.3 | −207.8 | 10.7 | −9.2 |
| 34 | Net purchases of nonproduced assets | 0.0 | −18.1 | 18.0 | −17.9 | 18.2 |
| 35 | Less: Consumption of fixed capital | 328.8 | 3.5 | 4.4 | 5.5 | 6.2 |
| 36 | Net lending or net borrowing (−) | −1,625.2 | −2,134.0 | 964.5 | 1,081.3 | 712.7 |
Net state and local government saving was $85.9 billion in the fourth quarter, decreasing $119.7 billion from $205.6 billion in the third quarter. In the fourth quarter, current receipts decreased less and current expenditures decelerated relative to the third quarter (table 3).
State and local government net lending was $40.8 billion, decreasing $125.2 billion from $165.9 billion in the third quarter.
- Personal current taxes (line 3) accelerated in the fourth quarter, reflecting an acceleration in income taxes.
- Taxes on production and imports (line 4) accelerated in the fourth quarter, reflecting accelerations in sales taxes and state severance taxes, which are taxes on the extraction of certain natural resources.
- Federal grants-in-aid (line 9) decreased less in the fourth quarter, reflecting the pattern of spending for various COVID–19 response efforts appropriated through the CRRSA Act and the American Rescue Plan Act. General economic and labor affairs grants decreased less, reflecting decreased funding from the Coronavirus State and Local Fiscal Recovery Funds to help state and local governments bridge budget shortfalls.
- Current surplus of government enterprises (line 11) turned down in the fourth quarter, reflecting a decrease in federal subsidies to mass transit enterprises.
- Consumption expenditures (line 13) decelerated in the fourth quarter, reflecting a deceleration in compensation of general government employees. The deceleration was partially offset by an acceleration in nondurable goods, reflecting an acceleration in purchases of petroleum.
- Government social benefits (line 14) decelerated in the fourth quarter, reflecting a deceleration in Medicaid benefits. Third-quarter government social benefits were boosted by higher enrollment from expanded coverage in several states, as well as the implementation of the special enrollment period for the federal Affordable Care Act Health Insurance Marketplace that ended August 15, 2021.
- Capital transfer receipts (line 22) turned down in the fourth quarter. Third-quarter capital transfer receipts were boosted by disaster-related insurance benefits related to Hurricane Ida.
| Line | Level | Change from preceding quarter | ||||
|---|---|---|---|---|---|---|
| 2021 | ||||||
| IV | I | II | III | IV | ||
| 1 | Current receipts | 3,433.8 | 100.5 | 930.7 | −519.7 | −77.9 |
| 2 | Current tax receipts | 2,259.6 | 57.5 | 77.3 | 45.5 | 77.3 |
| 3 | Personal current taxes | 629.0 | 37.4 | 26.2 | 18.7 | 23.9 |
| 4 | Taxes on production and imports | 1,515.2 | 13.5 | 44.6 | 23.3 | 33.4 |
| 5 | Taxes on corporate income | 115.4 | 6.7 | 6.4 | 3.4 | 20.1 |
| 6 | Contributions for government social insurance | 22.8 | 0.7 | 0.7 | 0.6 | 0.3 |
| 7 | Income receipts on assets | 99.6 | 0.4 | 0.3 | 0.7 | 0.9 |
| 8 | Current transfer receipts | 1,062.0 | 42.2 | 848.2 | −574.3 | −151.8 |
| 9 | Federal grants-in-aid | 904.2 | 38.5 | 850.7 | −575.1 | −152.9 |
| 10 | Other | 157.7 | 3.7 | −2.5 | 0.8 | 1.0 |
| 11 | Current surplus of government enterprises | −10.2 | −0.3 | 4.1 | 8.0 | −4.7 |
| 12 | Current expenditures | 3,347.8 | 64.1 | 90.2 | 103.4 | 41.7 |
| 13 | Consumption expenditures | 2,119.3 | 41.8 | 48.8 | 65.3 | 38.7 |
| 14 | Government social benefits | 939.2 | 18.9 | 35.5 | 47.7 | 6.0 |
| 15 | Interest payments | 288.6 | 1.5 | −0.1 | −1.7 | −3.0 |
| 16 | Subsidies | 0.6 | 1.9 | 6.1 | −8.0 | 0.0 |
| 17 | Net state and local government saving | 85.9 | 36.4 | 840.5 | −623.1 | −119.7 |
| 18 | Social insurance funds | 5.7 | 0.5 | 0.6 | 0.5 | 0.4 |
| 19 | Other | 80.2 | 35.9 | 839.9 | −623.6 | −120.1 |
| Addenda: | ||||||
| 20 | Total receipts | 3,515.5 | 99.0 | 933.6 | −511.5 | −88.5 |
| 21 | Current receipts | 3,433.8 | 100.5 | 930.7 | −519.7 | −77.9 |
| 22 | Capital transfer receipts | 81.7 | −1.6 | 2.9 | 8.1 | −10.5 |
| 23 | Total expenditures | 3,474.7 | 53.2 | 77.0 | 100.4 | 36.7 |
| 24 | Current expenditures | 3,347.8 | 64.1 | 90.2 | 103.4 | 41.7 |
| 25 | Gross government investment | 447.4 | −6.1 | −4.9 | 5.0 | 5.1 |
| 26 | Capital transfer payments | |||||
| 27 | Net purchases of nonproduced assets | 18.9 | 0.2 | 0.3 | 0.4 | 0.3 |
| 28 | Less: Consumption of fixed capital | 339.4 | 5.1 | 8.7 | 8.2 | 10.5 |
| 29 | Net lending or net borrowing (−) | 40.8 | 45.8 | 856.6 | −612.0 | −125.1 |