
U.S. Net International Investment Position
Fourth Quarter and Year 2018
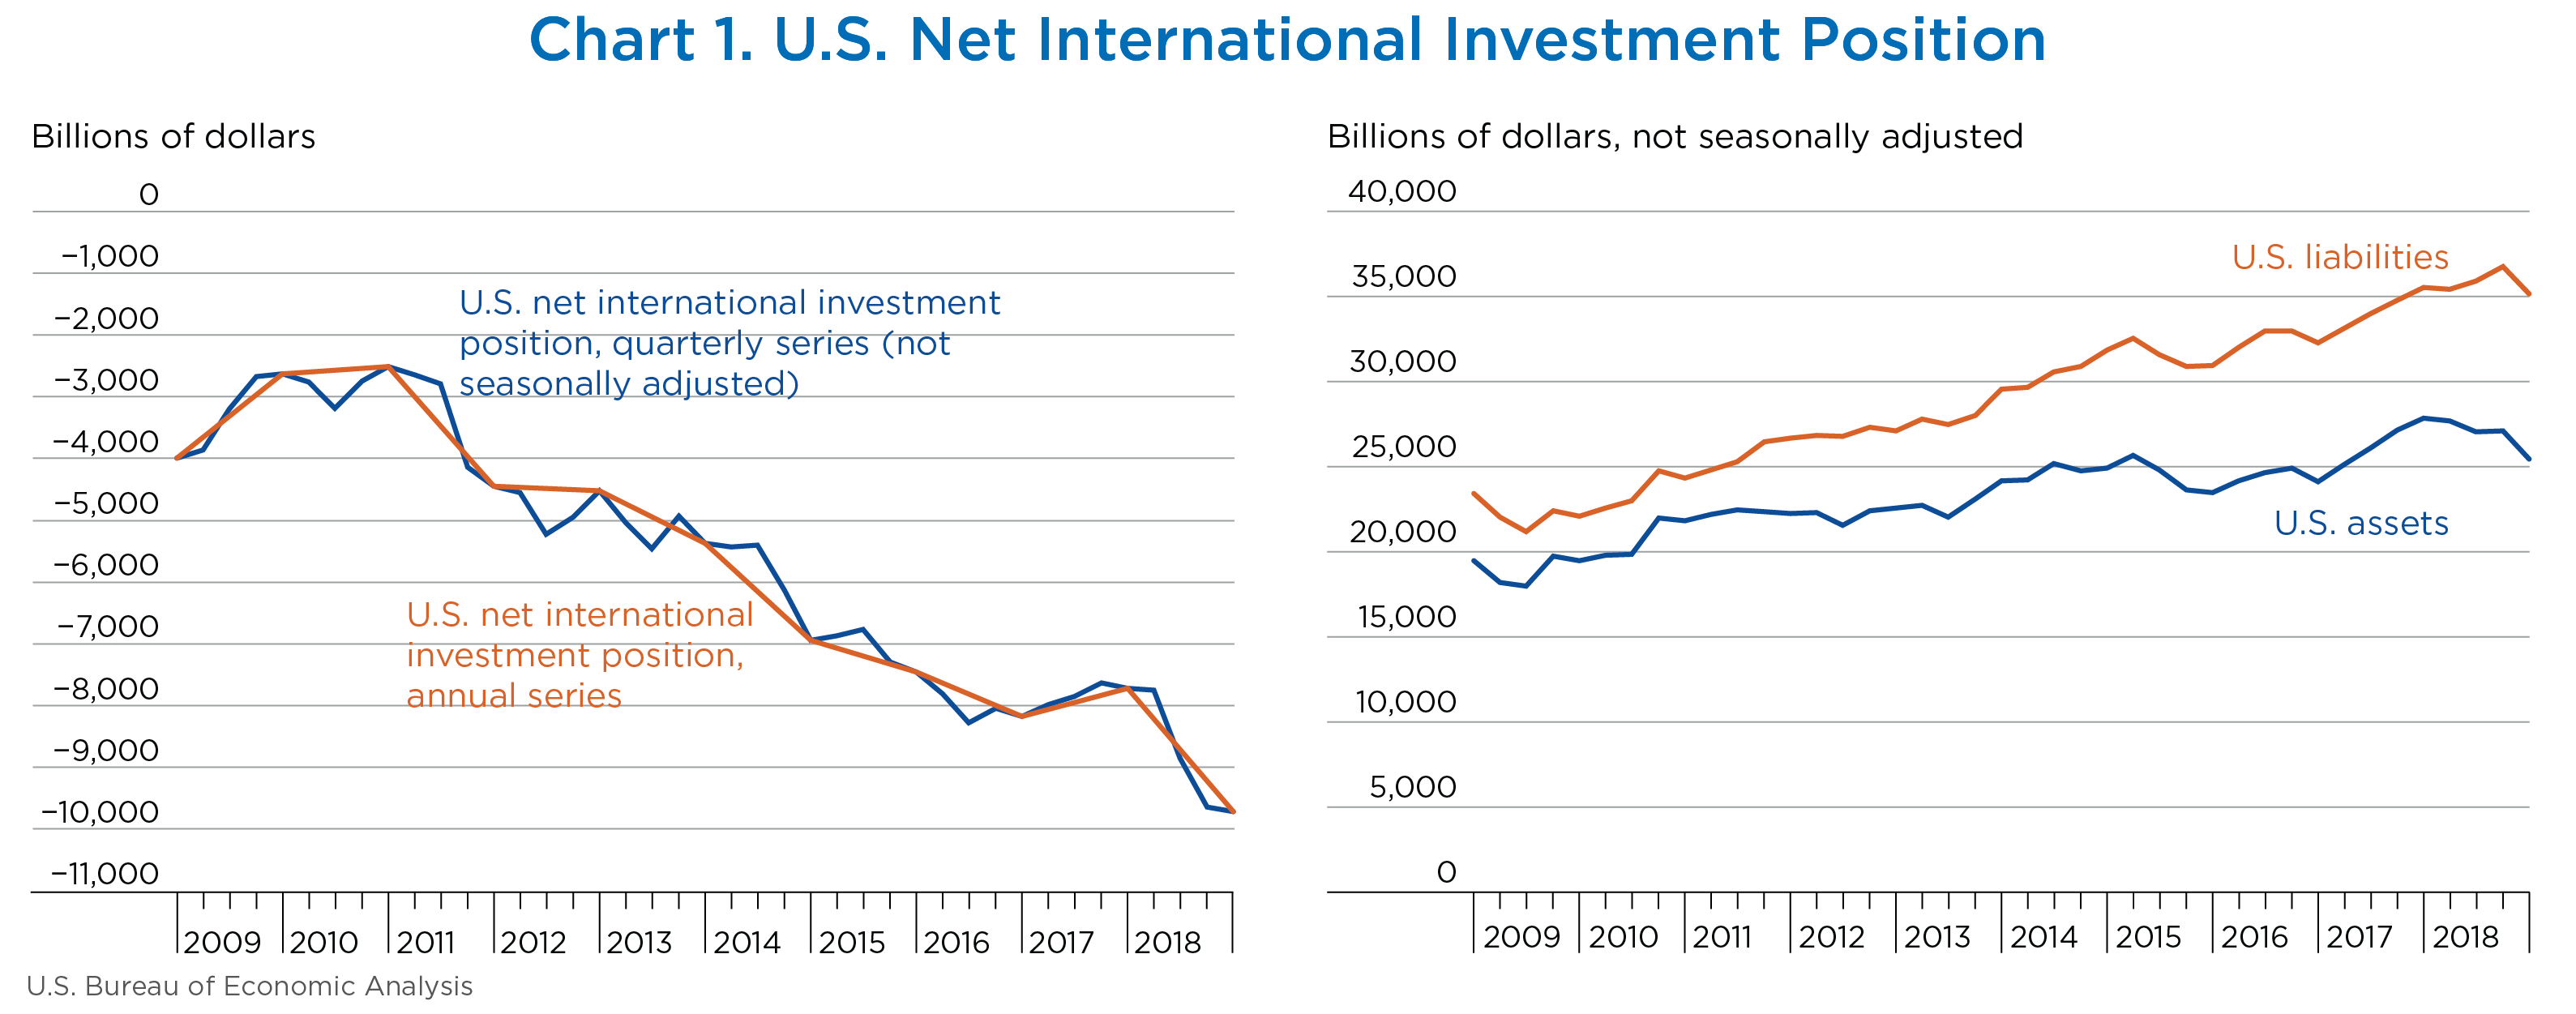
The U.S. net international investment position—the value of U.S. assets less the value of U.S. liabilities—decreased to −$9,717.1 billion (preliminary) at the end of the fourth quarter of 2018 from −$9,634.8 billion (revised) at the end of the third quarter (chart 1).
For the year 2018, the U.S. net international investment position decreased $1,992.1 billion from −$7,725.0 billion at the end of 2017 (chart 1).
The U.S. international investment position is a statistical balance sheet that presents the dollar value of U.S. external financial assets and liabilities at a specific point in time. The negative net investment position represents a U.S. net liability to the rest of the world.
Fourth-quarter highlights
- The net investment position decreased $82.4 billion in the fourth quarter, reflecting a $1,695.4 billion decrease in U.S. assets and a $1,613.0 billion decrease in U.S. liabilities. The decrease also reflected net financial transactions of −$199.2 billion and net other changes in position, such as price and exchange-rate changes, of $116.8 billion (table A).
- The net investment position decreased 0.9 percent in the fourth quarter, compared with a decrease of 8.9 percent in the third quarter and an average quarterly decrease of 4.7 percent from the first quarter of 2011 through the second quarter of 2018.
Year 2018 highlights
- The net investment position decreased $1,992.1 billion in 2018, reflecting a $2,400.5 billion decrease in U.S. assets and a $408.4 billion decrease in U.S. liabilities. The decrease also reflected net financial transactions of −$519.6 billion and net other changes in position, such as price and exchange-rate changes, of −$1,472.6 billion (table E).
- The net investment position decreased 25.8 percent in 2018, compared with an increase of 5.6 percent in 2017.
[Click chart to expand]
| Type of investment | Position, 2018:III | Change in position in 2018:IV | Position, 2018:IV | ||
|---|---|---|---|---|---|
| Total | Attributable to: | ||||
| Financial transactions | Other changes in position 1 | ||||
| U.S. net international investment position | −9,634.8 | −82.4 | −199.2 | 116.8 | −9,717.1 |
| Net position excluding financial derivatives | −9,692.0 | −56.0 | −179.1 | 123.2 | −9,747.9 |
| Financial derivatives other than reserves, net 2 | 57.2 | −26.4 | −20.1 | −6.3 | 30.8 |
| U.S. assets | 27,094.0 | −1,695.4 | (2) | (2) | 25,398.6 |
| Assets excluding financial derivatives | 25,594.7 | −1,942.1 | 136.5 | −2,078.6 | 23,652.6 |
| Financial derivatives other than reserves | 1,499.2 | 246.7 | (2) | (2) | 1,746.0 |
| U.S. liabilities | 36,728.7 | −1,613.0 | (2) | (2) | 35,115.7 |
| Liabilities excluding financial derivatives | 35,286.7 | −1,886.2 | 315.6 | −2,201.8 | 33,400.5 |
| Financial derivatives other than reserves | 1,442.0 | 273.1 | (2) | (2) | 1,715.2 |
- Disaggregation of other changes in position into price changes, exchange-rate changes, and other changes in volume and valuation is only presented for annual statistics released in June each year.
- Financial transactions and other changes in financial derivatives positions are available only on a net basis; they are not separately available for U.S. assets and U.S. liabilities.
Note. The statistics on positions are presented in table 1.2 of the international investment position (IIP) accounts on BEA’s website. The statistics on financial transactions are not seasonally adjusted and are presented in table 1.2 of the international transactions accounts (ITAs) on BEA’s website.
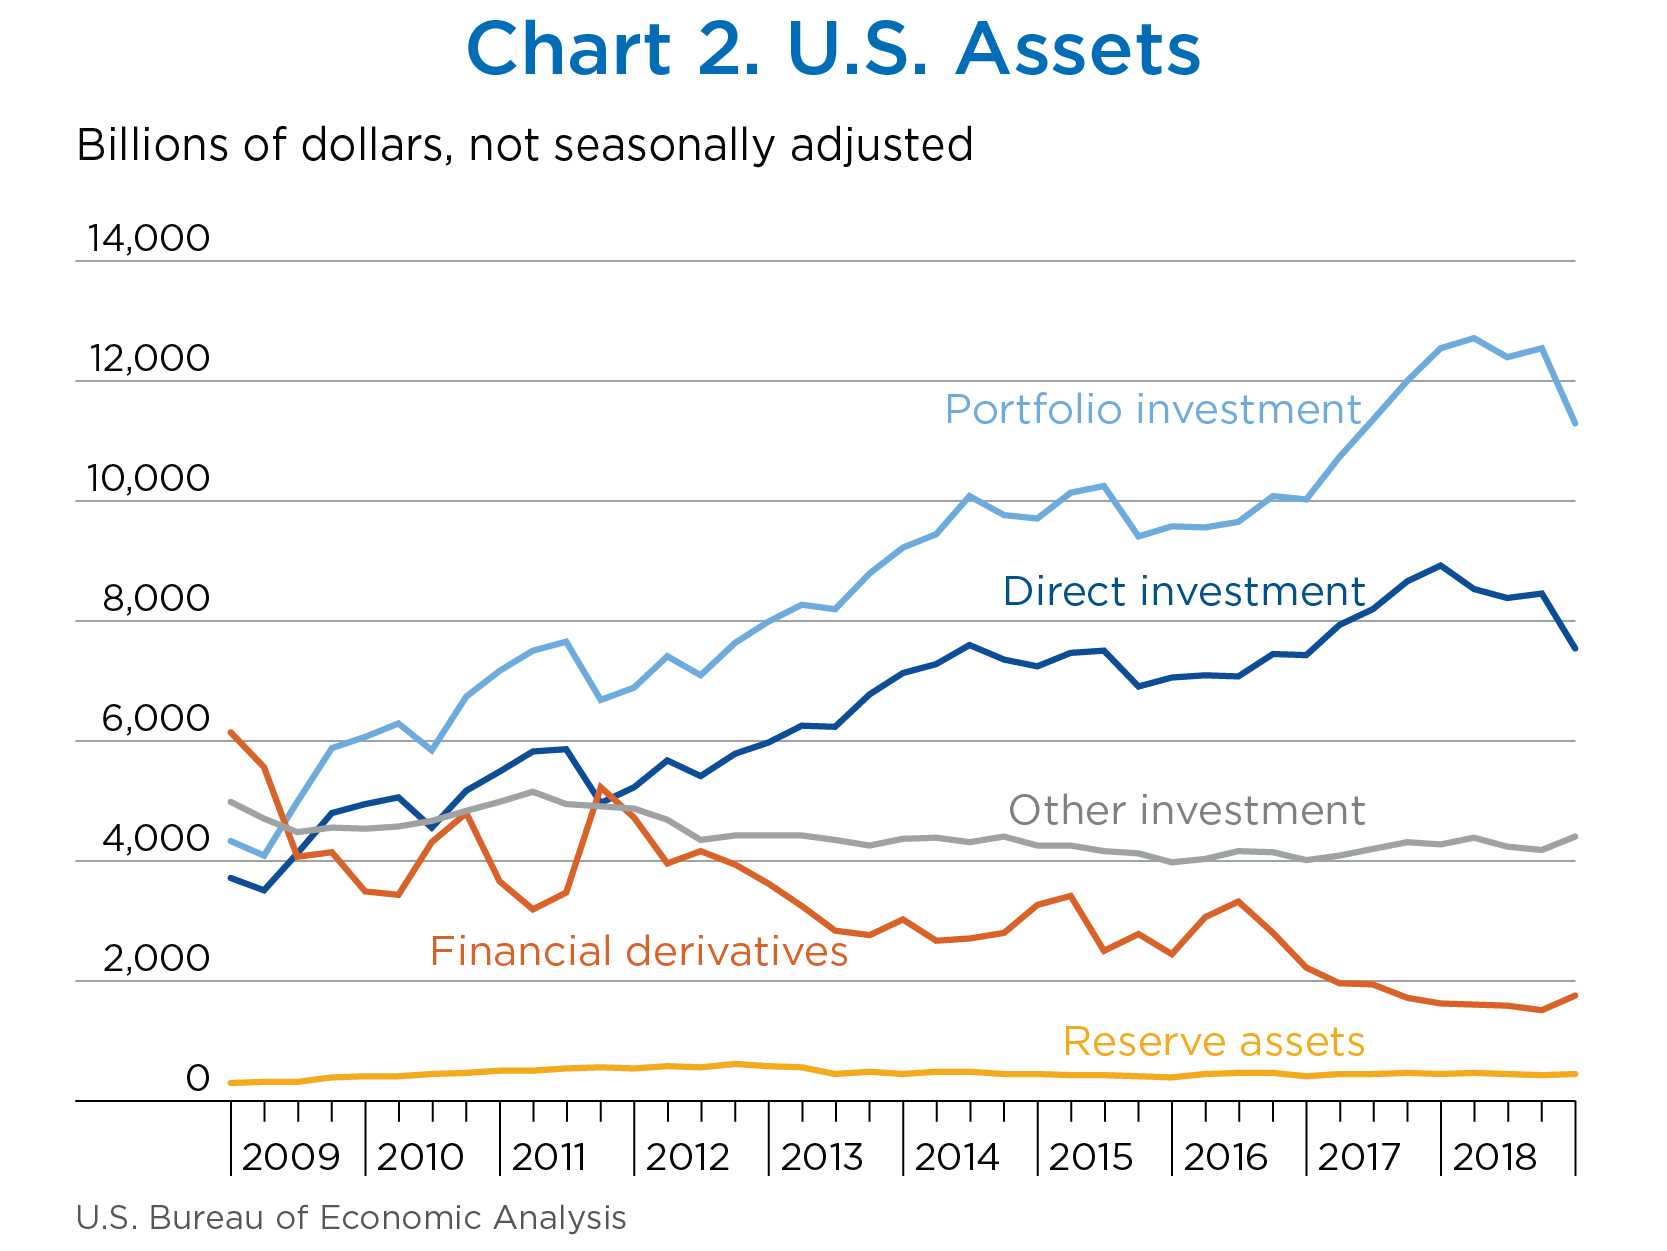
U.S. assets decreased $1,695.4 billion to $25,398.6 billion at the end of the fourth quarter, reflecting decreases in portfolio investment and direct investment assets that were partly offset by increases in financial derivatives, other investment, and reserve assets (chart 2, table B).
- Assets excluding financial derivatives decreased $1,942.1 billion to $23,652.6 billion. The decrease resulted from financial transactions of $136.5 billion and other changes in position of −$2,078.6 billion.
- Financial transactions reflected net U.S. acquisition of other investment deposit and loan assets and of direct investment equity assets that were partly offset by net U.S. sales of foreign securities.
- Other changes in position were driven by foreign stock price decreases that lowered the equity value of portfolio investment and direct investment assets.
- Financial derivatives increased $246.7 billion to $1,746.0 billion, reflecting increases in single-currency interest rate contracts.
[Click chart to expand]
| Type of investment | Position, 2018:III | Change in position in 2018:IV | Position, 2018:IV | ||
|---|---|---|---|---|---|
| Total | Attributable to: | ||||
| Financial transactions | Other changes in position 1 | ||||
| U.S. assets | 27,094.0 | −1,695.4 | (2) | (2) | 25,398.6 |
| Assets excluding financial derivatives | 25,594.7 | −1,942.1 | 136.5 | −2,078.6 | 23,652.6 |
| Financial derivatives other than reserves | 1,499.2 | 246.7 | (2) | (2) | 1,746.0 |
| By functional category: | |||||
| Direct investment at market value | 8,451.3 | −922.9 | 60.7 | −983.6 | 7,528.4 |
| Equity | 7,201.5 | −925.5 | 62.0 | −987.5 | 6,276.0 |
| Debt instruments | 1,249.8 | 2.6 | −1.3 | 3.9 | 1,252.3 |
| Portfolio investment | 12,543.2 | −1,262.1 | −149.6 | −1,112.6 | 11,281.1 |
| Equity and investment fund shares | 8,988.6 | −1,162.4 | −65.1 | −1,097.3 | 7,826.2 |
| Debt securities | 3,554.7 | −99.7 | −84.5 | −15.3 | 3,454.9 |
| Short term | 699.9 | −33.9 | −34.2 | 0.3 | 666.0 |
| Long term | 2,854.7 | −65.8 | −50.3 | −15.6 | 2,788.9 |
| Financial derivatives other than reserves | 1,499.2 | 246.7 | (2) | (2) | 1,746.0 |
| Over-the-counter contracts | 1,435.9 | 251.6 | (2) | (2) | 1,687.5 |
| Single-currency interest rate contracts | 958.5 | 249.2 | (2) | (2) | 1,207.8 |
| Foreign exchange contracts | 301.8 | 2.1 | (2) | (2) | 303.8 |
| Other contracts | 175.6 | 0.3 | (2) | (2) | 175.9 |
| Exchange-traded contracts | 63.3 | −4.9 | (2) | (2) | 58.4 |
| Other investment | 4,177.2 | 216.8 | 223.2 | −6.4 | 4,394.0 |
| Currency and deposits | 1,768.6 | 138.8 | 143.5 | −4.7 | 1,907.5 |
| Loans | 2,358.1 | 76.2 | 77.7 | −1.6 | 2,434.3 |
| Insurance technical reserves | n.a. | n.a. | n.a. | n.a. | n.a. |
| Trade credit and advances | 50.4 | 1.9 | 2.0 | −0.1 | 52.3 |
| Reserve assets | 423.0 | 26.0 | 2.1 | 23.9 | 449.1 |
| Monetary gold | 310.5 | 24.0 | 0.0 | 24.0 | 334.5 |
| Special drawing rights | 50.9 | −0.1 | (*) | −0.2 | 50.8 |
| Reserve position in the International Monetary Fund | 20.0 | 2.0 | 2.0 | −0.1 | 22.0 |
| Other reserve assets | 41.6 | 0.2 | (*) | 0.2 | 41.8 |
- n.a.
- Not available
- (*)
- Value between zero and +/− $50 million
- Disaggregation of other changes in position into price changes, exchange-rate changes, and other changes in volume and valuation is only presented for annual statistics released in June each year.
- Financial transactions and other changes in financial derivatives positions are available only on a net basis; they are not separately available for U.S. assets and U.S. liabilities.
Note. The statistics on positions are presented in table 1.2 of the international investment position (IIP) accounts on BEA’s website. The statistics on financial transactions are not seasonally adjusted and are presented in table 1.2 of the international transactions accounts (ITAs) on BEA’s website.
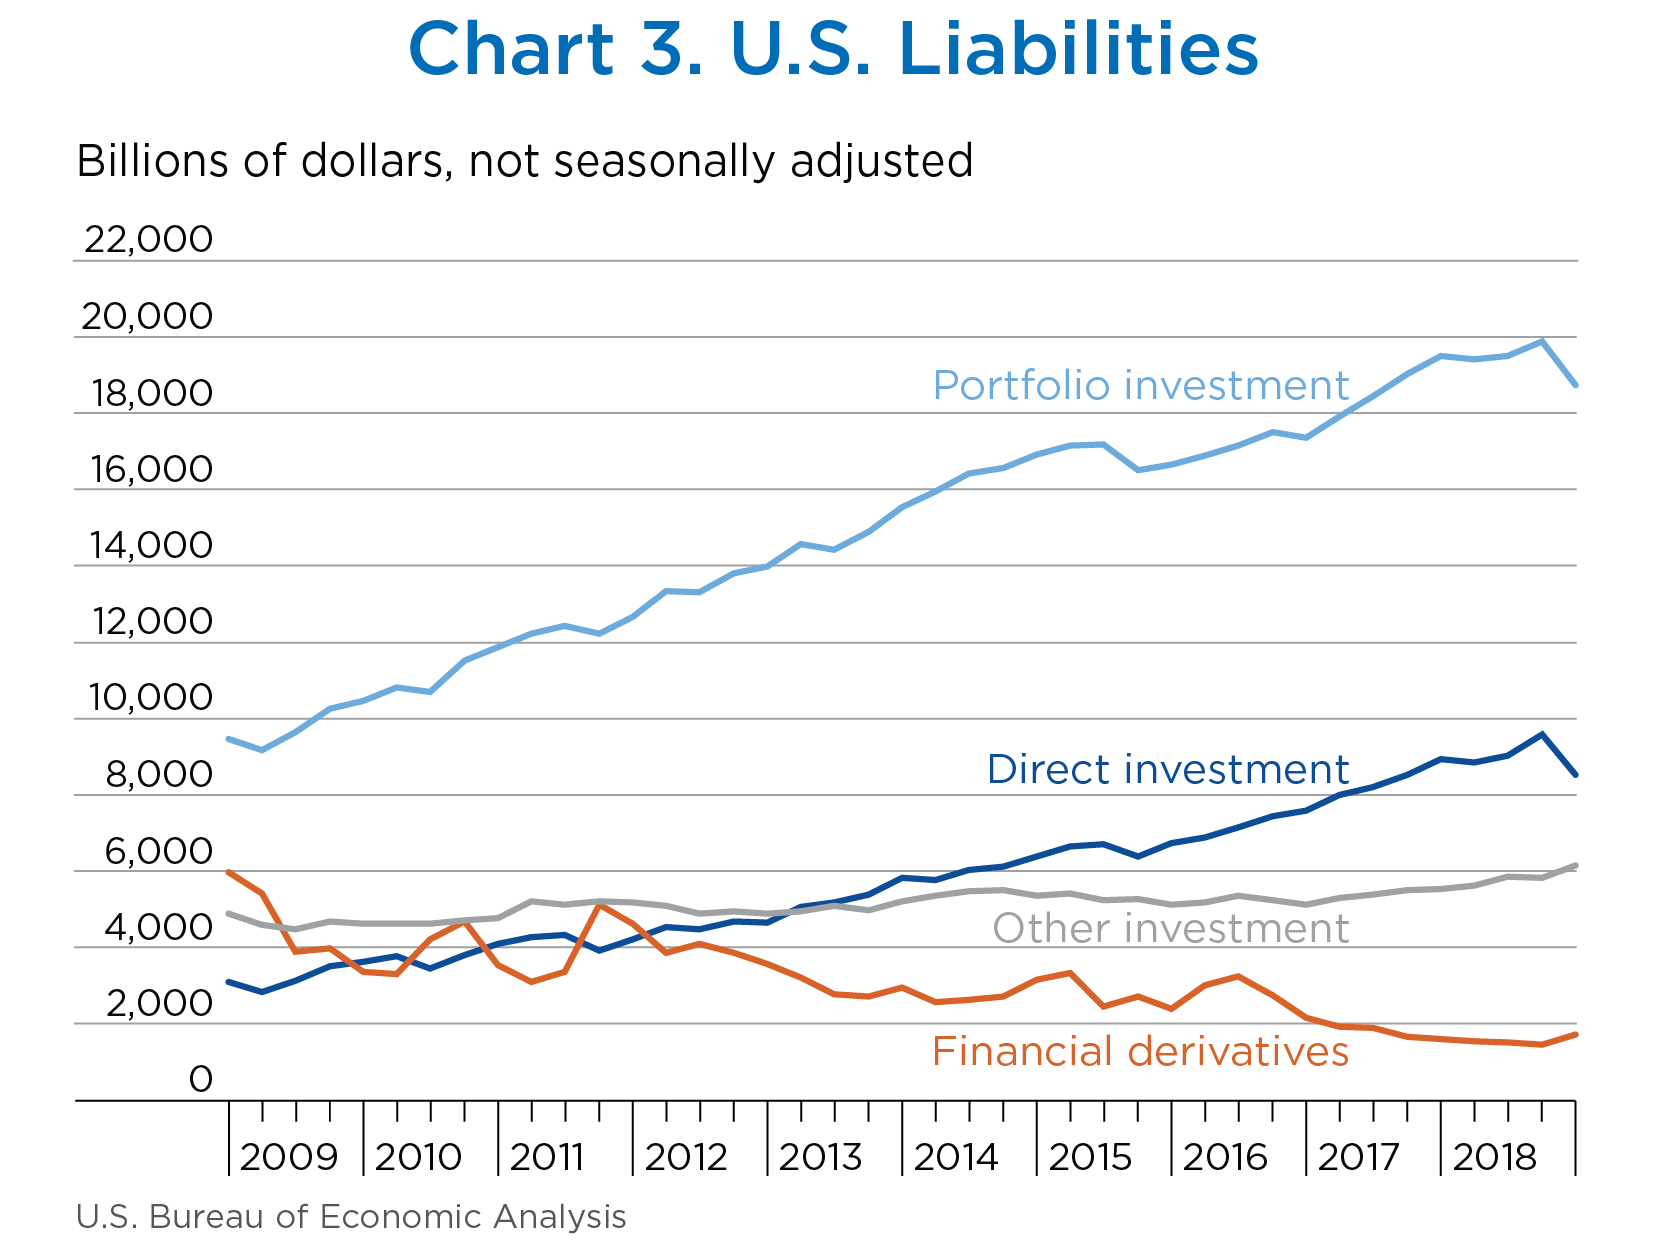
U.S. liabilities decreased $1,613.0 billion to $35,115.7 billion at the end of the fourth quarter, reflecting decreases in portfolio investment and direct investment liabilities that were partly offset by increases in other investment liabilities and financial derivatives (chart 3, table C).
- Liabilities excluding financial derivatives decreased $1,886.2 billion to $33,400.5 billion. The decrease resulted from financial transactions of $315.6 billion and other changes in position of −$2,201.8 billion.
- Financial transactions reflected net U.S. incurrence of other investment loan and deposit liabilities and of direct investment equity liabilities that were partly offset by net foreign sales of U.S. securities, especially of U.S. long-term debt.
- Other changes in position were driven by U.S. stock price decreases that lowered the equity value of portfolio investment and direct investment liabilities.
- Financial derivatives increased $273.1 billion to $1,715.2 billion, reflecting increases in single-currency interest rate contracts.
[Click chart to expand]
| Type of investment | Position, 2018:III | Change in position in 2018:IV | Position, 2018:IV | ||
|---|---|---|---|---|---|
| Total | Attributable to: | ||||
| Financial transactions | Other changes in position 1 | ||||
| U.S. liabilities | 36,728.7 | −1,613.0 | (2) | (2) | 35,115.7 |
| Liabilities excluding financial derivatives | 35,286.7 | −1,886.2 | 315.6 | −2,201.8 | 33,400.5 |
| Financial derivatives other than reserves | 1,442.0 | 273.1 | (2) | (2) | 1,715.2 |
| By functional category: | |||||
| Direct investment at market value | 9,583.2 | −1,064.8 | 83.6 | −1,148.4 | 8,518.4 |
| Equity | 7,855.1 | −1,057.5 | 95.0 | −1,152.5 | 6,797.6 |
| Debt instruments | 1,728.1 | −7.3 | −11.4 | 4.1 | 1,720.8 |
| Portfolio investment | 19,882.9 | −1,144.9 | −12.9 | −1,132.0 | 18,738.1 |
| Equity and investment fund shares | 8,561.6 | −1,107.9 | 88.2 | −1,196.0 | 7,453.7 |
| Debt securities | 11,321.4 | −37.0 | −101.0 | 64.0 | 11,284.4 |
| Short term | 967.1 | 12.9 | 13.1 | −0.2 | 980.0 |
| Long term | 10,354.3 | −49.9 | −114.1 | 64.2 | 10,304.4 |
| Financial derivatives other than reserves | 1,442.0 | 273.1 | (2) | (2) | 1,715.2 |
| Over-the-counter contracts | 1,385.6 | 269.5 | (2) | (2) | 1,655.1 |
| Single-currency interest rate contracts | 917.4 | 264.8 | (2) | (2) | 1,182.2 |
| Foreign exchange contracts | 290.7 | 8.6 | (2) | (2) | 299.3 |
| Other contracts | 177.5 | −3.9 | (2) | (2) | 173.6 |
| Exchange-traded contracts | 56.4 | 3.6 | (2) | (2) | 60.0 |
| Other investment | 5,820.6 | 323.5 | 244.9 | 78.6 | 6,144.1 |
| Currency and deposits | 3,152.6 | 102.8 | 104.6 | −1.8 | 3,255.4 |
| Loans | 2,418.7 | 222.4 | 141.8 | 80.6 | 2,641.1 |
| Insurance technical reserves | n.a. | n.a. | n.a. | n.a. | n.a. |
| Trade credit and advances | 200.0 | −1.6 | −1.5 | −0.1 | 198.5 |
| Special drawing rights allocations | 49.3 | −0.2 | 0.0 | −0.2 | 49.1 |
- n.a.
- Not available
- Disaggregation of other changes in position into price changes, exchange-rate changes, and other changes in volume and valuation is only presented for annual statistics released in June each year.
- Financial transactions and other changes in financial derivatives positions are available only on a net basis; they are not separately available for U.S. assets and U.S. liabilities.
Note. The statistics on positions are presented in table 1.2 of the international investment position (IIP) accounts on BEA’s website. The statistics on financial transactions are not seasonally adjusted and are presented in table 1.2 of the international transactions accounts (ITAs) on BEA’s website.
The U.S. net international investment position statistics for the third quarter of 2018 have been updated to incorporate newly available and revised source data (table D).
| Preliminary estimate | Revised estimate | |
|---|---|---|
| U.S. net international investment position | −9,627.2 | −9,634.8 |
| U.S. assets | 27,150.7 | 27,094.0 |
| Direct investment at market value | 8,468.6 | 8,451.3 |
| Portfolio investment | 12,558.8 | 12,543.2 |
| Financial derivatives other than reserves | 1,499.2 | 1,499.2 |
| Other investment | 4,201.1 | 4,177.2 |
| Reserve assets | 423.0 | 423.0 |
| U.S. liabilities | 36,777.9 | 36,728.7 |
| Direct investment at market value | 9,591.1 | 9,583.2 |
| Portfolio investment | 19,882.9 | 19,882.9 |
| Financial derivatives other than reserves | 1,442.0 | 1,442.0 |
| Other investment | 5,861.9 | 5,820.6 |
The U.S. net international investment position decreased to −$9,717.1 billion (preliminary) at the end of 2018 from −$7,725.0 billion at the end of 2017 (table E). The $1,992.1 billion decrease reflected a $2,400.5 billion decrease in U.S. assets and a $408.4 billion decrease in U.S. liabilities.
U.S. assets decreased $2,400.5 billion to $25,398.6 billion at the end of 2018, reflecting decreases in direct investment and portfolio investment assets that were partly offset by increases in financial derivatives and other investment assets (table E).
- Assets excluding financial derivatives decreased $2,524.0 billion to $23,652.6 billion. The decrease resulted from financial transactions of $301.6 billion and other changes in position of −$2,825.6 billion.
- Financial transactions reflected net U.S. purchases of foreign securities and net U.S. acquisition of other investment deposit assets that were partly offset by net U.S. withdrawal of direct investment equity assets. The net withdrawal of direct investment equity assets reflected U.S. parent repatriation of previously reinvested earnings in response to the Tax Cuts and Jobs Act. For more information, see the box “Effects of the 2017 Tax Cuts and Jobs Act on U.S. Direct Investment Assets.”
- Other changes in position mostly reflected foreign stock price decreases that lowered the equity value of portfolio investment and direct investment assets, and to a lesser extent, the depreciation of major foreign currencies against the U.S. dollar that lowered the value of foreign-currency-denominated assets in dollar terms.
- Financial derivatives increased $123.5 billion to $1,746.0 billion, mostly in single-currency interest rate contracts and foreign exchange contracts.
| Type of investment | Yearend position, 2017 | Change in position in 2018 | Yearend position, 2018 | ||
|---|---|---|---|---|---|
| Total | Attributable to: | ||||
| Financial transactions | Other changes in position 1 | ||||
| U.S. net international investment position | −7,725.0 | −1,992.1 | −519.6 | −1,472.6 | −9,717.1 |
| Net position excluding financial derivatives | −7,753.3 | −1,994.7 | −499.3 | −1,495.4 | −9,747.9 |
| Financial derivatives other than reserves, net | 28.3 | 2.5 | −20.3 | 22.8 | 30.8 |
| U.S. assets | 27,799.1 | −2,400.5 | (2) | (2) | 25,398.6 |
| Assets excluding financial derivatives | 26,176.6 | −2,524.0 | 301.6 | −2,825.6 | 23,652.6 |
| Financial derivatives other than reserves | 1,622.5 | 123.5 | (2) | (2) | 1,746.0 |
| By functional category: | |||||
| Direct investment at market value | 8,910.0 | −1,381.6 | −50.6 | −1,331.0 | 7,528.4 |
| Equity | 7,645.9 | −1,369.8 | −58.5 | −1,311.3 | 6,276.0 |
| Debt instruments | 1,264.1 | −11.8 | 7.9 | −19.7 | 1,252.3 |
| Portfolio investment | 12,543.8 | −1,262.7 | 210.3 | −1,473.1 | 11,281.1 |
| Equity and investment fund shares | 9,129.5 | −1,303.3 | 97.2 | −1,400.5 | 7,826.2 |
| Debt securities | 3,414.4 | 40.6 | 113.2 | −72.6 | 3,454.9 |
| Short term | 649.8 | 16.2 | 17.6 | −1.4 | 666.0 |
| Long term | 2,764.6 | 24.3 | 95.6 | −71.2 | 2,788.9 |
| Financial derivatives other than reserves | 1,622.5 | 123.5 | (2) | (2) | 1,746.0 |
| Over-the-counter contracts | 1,582.0 | 105.6 | (2) | (2) | 1,687.5 |
| Single-currency interest rate contracts | 1,150.5 | 57.2 | (2) | (2) | 1,207.8 |
| Foreign exchange contracts | 261.3 | 42.5 | (2) | (2) | 303.8 |
| Other contracts | 170.1 | 5.8 | (2) | (2) | 175.9 |
| Exchange-traded contracts | 40.5 | 17.9 | (2) | (2) | 58.4 |
| Other investment | 4,273.0 | 121.0 | 136.9 | −15.9 | 4,394.0 |
| Currency and deposits | 1,774.9 | 132.6 | 151.8 | −19.3 | 1,907.5 |
| Loans | 2,446.4 | −12.1 | −15.7 | 3.6 | 2,434.3 |
| Insurance technical reserves | n.a. | n.a. | n.a. | n.a. | n.a. |
| Trade credit and advances | 51.8 | 0.5 | 0.8 | −0.3 | 52.3 |
| Reserve assets | 449.7 | −0.6 | 5.0 | −5.6 | 449.1 |
| Monetary gold | 337.6 | −3.1 | 0.0 | −3.1 | 334.5 |
| Special drawing rights | 51.9 | −1.1 | 0.2 | −1.2 | 50.8 |
| Reserve position in the International Monetary Fund | 17.6 | 4.4 | 4.8 | −0.4 | 22.0 |
| Other reserve assets | 42.6 | −0.8 | (*) | −0.8 | 41.8 |
- n.a.
- Not available
- (*)
- Value between zero and +/− $50 million
- Disaggregation of other changes in position into price changes, exchange-rate changes, and other changes in volume and valuation is only presented for annual statistics released in June each year.
- Financial transactions and other changes in financial derivatives positions are available only on a net basis; they are not separately available for U.S. assets and U.S. liabilities.
U.S. liabilities decreased $408.4 billion to $35,115.7 billion at the end of 2018, reflecting decreases in portfolio investment and direct investment liabilities that were partly offset by increases in other investment liabilities and financial derivatives (table F).
- Liabilities excluding financial derivatives decreased $529.3 billion to $33,400.5 billion. The decrease resulted from financial transactions of $800.9 billion and other changes in position of −$1,330.2 billion.
- Financial transactions reflected net incurrence of liabilities in all major investment categories.
- Other changes in position mostly reflected U.S. stock price decreases that lowered the equity value of portfolio investment and direct investment liabilities.
- Financial derivatives increased $120.9 billion to $1,715.2 billion, mostly in single-currency interest rate contracts and foreign exchange contracts.
| Type of investment | Yearend position, 2017 | Change in position in 2018 | Yearend position, 2018 | ||
|---|---|---|---|---|---|
| Total | Attributable to: | ||||
| Financial transactions | Other changes in position 1 | ||||
| U.S. liabilities | 35,524.1 | −408.4 | (2) | (2) | 35,115.7 |
| Liabilities excluding financial derivatives | 33,929.8 | −529.3 | 800.9 | −1,330.2 | 33,400.5 |
| Financial derivatives other than reserves | 1,594.2 | 120.9 | (2) | (2) | 1,715.2 |
| By functional category: | |||||
| Direct investment at market value | 8,925.5 | −407.1 | 267.1 | −674.2 | 8,518.4 |
| Equity | 7,132.8 | −335.2 | 332.2 | −667.5 | 6,797.6 |
| Debt instruments | 1,792.6 | −71.8 | −65.1 | −6.7 | 1,720.8 |
| Portfolio investment | 19,482.2 | −744.1 | 320.0 | −1,064.1 | 18,738.1 |
| Equity and investment fund shares | 7,951.9 | −498.2 | 147.2 | −645.4 | 7,453.7 |
| Debt securities | 11,530.3 | −245.9 | 172.8 | −418.7 | 11,284.4 |
| Short term | 959.2 | 20.8 | 28.8 | −8.0 | 980.0 |
| Long term | 10,571.1 | −266.7 | 144.0 | −410.7 | 10,304.4 |
| Financial derivatives other than reserves | 1,594.2 | 120.9 | (2) | (2) | 1,715.2 |
| Over-the-counter contracts | 1,554.4 | 100.8 | (2) | (2) | 1,655.1 |
| Single-currency interest rate contracts | 1,112.6 | 69.7 | (2) | (2) | 1,182.2 |
| Foreign exchange contracts | 266.8 | 32.5 | (2) | (2) | 299.3 |
| Other contracts | 175.1 | −1.4 | (2) | (2) | 173.6 |
| Exchange-traded contracts | 39.9 | 20.2 | (2) | (2) | 60.0 |
| Other investment | 5,522.2 | 621.9 | 213.8 | 408.1 | 6,144.1 |
| Currency and deposits | 3,196.6 | 58.8 | 29.6 | 29.2 | 3,255.4 |
| Loans | 2,091.1 | 550.0 | 169.7 | 380.3 | 2,641.1 |
| Insurance technical reserves | n.a. | n.a. | n.a. | n.a. | n.a. |
| Trade credit and advances | 184.2 | 14.3 | 14.5 | −0.2 | 198.5 |
| Special drawing rights allocations | 50.3 | −1.2 | 0.0 | −1.2 | 49.1 |
- n.a.
- Not available
- Disaggregation of other changes in position into price changes, exchange-rate changes, and other changes in volume and valuation is only presented for annual statistics released in June each year.
- Financial transactions and other changes in financial derivatives positions are available only on a net basis; they are not separately available for U.S. assets and U.S. liabilities.