
A Profile of U.S. Exporters and Importers of Services, 2017
In 2017, the United States had a surplus on trade in services of $255.1 billion, which contrasted with an $805.2 billion deficit on trade in goods. Despite the important role that trade in services plays in the U.S. economy and worldwide, public information regarding the firms that engage in such trade remains limited. The Bureau of Economic Analysis (BEA) published a profile of services traders in 2012 in an effort to fill that gap; this article provides an updated view of services traders for 2008–2017, with a focus on 2017.1 In addition, BEA is introducing two interactive tables of statistics featuring certain tabulations included in this article with expanded historical detail.2
The analysis presented in this article is focused on a subset of statistics on international trade in services that is based on data collected by BEA. BEA administers surveys on international transactions in financial services; insurance services; charges for the use of intellectual property; telecommunications, computer, and information services; and other business services.3 (For more information, see the graphic “Defining Selected Services” at right.) Data from these surveys have been linked to BEA’s extensive information on multinational enterprises (MNEs) collected on its activities of multinational enterprise (AMNE) surveys of U.S. parents and U.S. affiliates to learn more about the characteristics of U.S. services traders.4

[Click chart to expand]
The use of data linked between BEA surveys provides a fuller view of the characteristics of MNEs that trade services.5 Trade in services surveys conducted by BEA collect very little information on services-trading firms besides their primary industry. In contrast, AMNE surveys collect information on many aspects of the company’s finances and operations. Because MNEs account for such a large proportion of services trade, the linked data provide considerable insight into the nature of firms that are services traders and opens the door to further research, including research into the extent that services-providing firms serve foreign markets either through international trade transactions or through their affiliates located in the markets that they serve.6 The linked data may also enable advances in ongoing research on digital trade and the U.S. economy and on patterns in the location of intellectual property asset creation and use by MNEs.
The balance on U.S. trade in the selected services that are in scope for this article was $176.1 billion in 2017, accounting for 69 percent of the overall surplus on total trade in services (graphic). These selected services cover most international services traded between businesses and accounted for 57 percent of total services exports and 51 percent of total services imports in 2017. The remainder of trade in services consists of travel (for all purposes including education), henceforth referred to as travel, which includes transactions by individual persons; government goods and services (including military); and transport and maintenance and repair services (including those traded among businesses). The services that are out of scope for this article are mainly based on source data other than BEA-administered surveys, with the exception of certain transport and maintenance services, and thus cannot be linked at the firm level to BEA AMNE surveys; the surplus on trade in these services totaled $79.0 billion in 2017, mostly reflecting a surplus in travel services.
This article features many key findings about international services traders:
- The largest shares of selected services exports and imports were attributable to firms in the finance and insurance, manufacturing, and information industries; together, they accounted for 71 percent of exports and 72 percent of imports in 2017.
- Exports and imports of selected services by MNEs grew at a faster rate than those of non-MNEs, from 2008 to 2017. As a result, the share of trade in selected services by MNEs grew from 87 percent of both exports and imports in 2008 to 92 percent of exports and 91 percent of imports in 2017.
- The surplus on trade in selected services in 2017 was more than accounted for by a $164.9 billion surplus for U.S. parents and a $12.4 billion surplus for non-MNEs. In contrast, U.S. affiliates ran a $3.4 billion deficit on trade in selected services.
- Trade in selected services by MNEs and non-MNEs was concentrated in different service types. For MNEs, the largest categories of trade were other business services, particularly professional and management consulting services, and charges for the use of intellectual property. For non-MNEs, the largest category of exports was financial services, and the largest category of imports was insurance services.
- Very large firms—those with at least 10,000 employees—dominated U.S. parents’ trade in selected services in 2017, accounting for 64 percent of their exports and 67 percent of their imports. Large firms—those with 1,001 to 10,000 employees—accounted for the largest share of U.S. affiliates’ trade, 43 percent of both exports and imports.
- In general, MNEs, particularly the larger ones, tended to have more diversity in their selected services trade than non-MNEs. MNEs exported to and imported from a greater number of trading partner countries, and, among MNEs, larger firms tended to have a greater number of trading partner countries than smaller firms. Nonetheless, most trade for MNEs was with a relatively small number of trading-partner countries, many of which were European. The top 10 partner countries accounted for 61 percent of total trade (exports plus imports) for U.S. parents and 74 percent of total trade for U.S. affiliates.
- MNEs also tended to trade in a greater number of types of selected services; among MNEs, larger firms tended to trade in a greater number of service types than smaller firms.
- For MNEs, most services trade was with affiliated parties in 2017. Not surprisingly, for U.S. parents, affiliated trade was predominantly with their foreign affiliates and for U.S. affiliates, affiliated trade was predominantly with their foreign parent group.
- Small firms—those with 500 or fewer employees—were intensive services traders relative to their size. Among MNEs, small U.S. parents accounted for 5 percent of selected services exports and 4 percent of imports by all services traders, and small U.S. affiliates accounted for 4 percent of selected services exports and 6 percent of imports.
The remainder of this article is divided into three main sections. The first section presents information on all U.S. services traders, including detail by industry and by firm type. The remainder of the article focuses on the characteristics of services traders that are MNEs using data from BEA’s AMNE surveys. The second section presents statistics for U.S. parents by employment size class and primary industry as well as by the affiliation status and country of location of their trading partners. The third section presents similar information for U.S. affiliates. This article also features three boxes: “Types of Firms that Trade Services” presents key terms used in this article; “Data Availability” indicates where additional information from this article, and on international services more broadly, can be found on BEA’s website; and “Trade in Services by Small MNEs” discusses the characteristics of trade in services for services traders that have been identified as small firms via the linked data on U.S. parents and U.S. affiliates.
Trade in selected services by industry
In 2017, finance and insurance firms had the largest share of selected services exports and imports, followed by firms in manufacturing and in information (table A).7 Since 2008—the first year covered by the linked data highlighted in this article—the ranking of the nine major industry categories presented in this article has been nearly unchanged for both exports and imports.
Exports
In 2017, the top three industry categories accounted for $323.4 billion (or 71 percent) of selected services exports of $452.9 billion. Highlights for the top three industries include the following:
- Finance and insurance. Finance and insurance firms accounted for the largest share—between 25 and 30 percent—of exports by major industry between 2008–2017. Within finance and insurance, finance firms accounted for more than 80 percent of selected services exports in 2017. The large role played by firms in finance partly reflects the fact that the United States is a major hub for global securities trading.8 More than three-fourths of exports by finance and insurance firms were in financial services, followed by insurance services and other business services, particularly professional and management consulting services (table B).
- Manufacturing. Manufacturing firms primarily produce goods but accounted for the second-largest share of selected services exports between 2008–2017. Two industries—chemicals manufacturing and computers and electronic products manufacturing—accounted for more than 60 percent of exports by manufacturers in 2017. More than 40 percent of selected services exports by manufacturing firms were in charges for the use of intellectual property, more than three-fourths of which were in industrial processes. Affiliated trade accounted for 91 percent of exports related to industrial processes by firms classified in manufacturing, reflecting a tendency for MNEs in manufacturing to license patents, trade secrets, and other types of intellectual property to their foreign affiliates or members of their foreign parent groups. The remainder of manufacturers’ selected services exports was mostly in research and development services and in professional and management consulting services.
- Information. Within information, the largest share of selected services exports was accounted for by software publishers and companies classified in the industry other information services, which includes operators of web search portals and publishers of content exclusive to the internet. In 2017, nearly half of all exports in information were in charges for the use of intellectual property, mostly by firms classified in computer software and audiovisual and related products. The remainder of exports in information were primarily in telecommunications, computer, and information services and in other business services, particularly professional and management consulting services.
Imports
The top three industry categories for imported services totaled $199.9 billion, or 72 percent, of selected services imports of $276.8 billion in 2017. Highlights for the top three industries include the following:
- Finance and insurance. As with exports, finance and insurance firms accounted for the largest share of imports by major industry between 2008–2017, although the share has decreased over time, from 41 percent of selected services imports in 2008 to 32 percent in 2017. Within finance and insurance, insurance firms accounted for 56 percent of the imports in 2017. Half of all imports by finance and insurance firms were in insurance services; the vast majority of which, over 90 percent, was in reinsurance. The remaining selected services imports were mostly in financial services, particularly in financial management, financial advisory, and custody services, and in other business services, particularly professional and management consulting services.
- Manufacturing. In 2017, the industry groups with the largest shares of selected services imports within manufacturing were manufacturers of chemicals, computer and electronic products, and transportation equipment. More than half of imports in manufacturing were in other business services, mostly in research and development services and professional and management consulting services. Just over one-third of imports in manufacturing were in charges for the use of intellectual property, which were largely in industrial processes. As with exports, much of this trade occurred between affiliated parties.
- Information. Imports of selected services by information firms were largest for those categorized in other information services, which includes operators of web search portals and publishers of content exclusive to the internet, and for software publishers. The largest categories of imports by information firms were other business services, particularly research and development services and professional and management consulting services, and charges for the use of intellectual property, more than half of which were transactions related to audiovisual and related products.
| 2008 | 2009 | 2010 | 2011 | 2012 | 2013 | 2014 | 2015 | 2016 | 2017 | |
|---|---|---|---|---|---|---|---|---|---|---|
| Exports | ||||||||||
| Total selected services, all industries | 294,413 | 297,229 | 320,333 | 358,458 | 370,814 | 395,811 | 417,604 | 417,178 | 423,139 | 452,933 |
| Mining | 3,037 | 3,079 | 2,731 | 3,709 | 3,899 | 4,721 | 4,701 | 5,101 | 3,843 | 4,050 |
| Manufacturing | 70,717 | 68,705 | 73,949 | 79,152 | 80,283 | 87,240 | 94,446 | 93,826 | 93,065 | 99,231 |
| Wholesale trade | 11,683 | 13,379 | 12,692 | 16,191 | 17,212 | 18,201 | 22,430 | 23,047 | 21,788 | 24,337 |
| Retail trade | 3,343 | 3,832 | 4,496 | 6,004 | 7,250 | 8,250 | 9,045 | 10,088 | 7,377 | 10,751 |
| Information | 53,138 | 55,653 | 64,332 | 74,136 | 79,933 | 82,070 | 83,083 | 89,509 | 91,291 | 95,671 |
| Finance and insurance | 86,486 | 88,844 | 96,472 | 90,117 | 91,829 | 114,585 | 119,215 | 113,838 | 117,616 | 128,501 |
| Real estate and rental and leasing | 5,535 | 5,705 | 5,756 | 8,995 | 10,105 | 13,169 | 13,578 | 14,431 | 15,636 | 15,224 |
| Professional, scientific, and technical services | 41,951 | 41,495 | 42,159 | 47,973 | 50,085 | 43,362 | 44,250 | 40,703 | 47,413 | 50,459 |
| Other industries | 18,523 | 16,538 | 17,747 | 32,181 | 30,217 | 24,212 | 26,856 | 26,634 | 25,110 | 24,707 |
| Addendum: | ||||||||||
| Other services1 | 238,404 | 215,493 | 242,426 | 268,604 | 284,910 | 304,680 | 323,491 | 338,132 | 335,307 | 346,024 |
| Imports | ||||||||||
| Total selected services, all industries | 197,897 | 203,849 | 209,192 | 225,156 | 230,814 | 239,573 | 249,150 | 249,868 | 260,828 | 276,810 |
| Mining | 2,154 | 3,137 | 2,878 | 3,289 | 3,860 | 5,015 | 5,558 | 5,464 | 4,277 | 4,074 |
| Manufacturing | 48,523 | 48,514 | 51,810 | 57,648 | 58,959 | 68,664 | 72,133 | 70,508 | 65,696 | 68,820 |
| Wholesale trade | 7,921 | 7,573 | 7,431 | 8,047 | 8,988 | 8,494 | 11,473 | 11,205 | 10,884 | 9,808 |
| Retail trade | 1,018 | 1,410 | 1,686 | 2,015 | 1,660 | 1,586 | 1,571 | 1,907 | 2,697 | 3,992 |
| Information | 26,079 | 29,663 | 31,493 | 31,729 | 34,621 | 33,159 | 33,457 | 36,011 | 40,828 | 42,167 |
| Finance and insurance | 80,180 | 78,851 | 79,235 | 76,402 | 75,769 | 78,539 | 79,175 | 78,996 | 80,809 | 88,990 |
| Real estate and rental and leasing | 653 | 548 | 215 | 425 | 505 | 997 | 458 | 326 | 981 | 1,277 |
| Professional, scientific, and technical services | 21,802 | 22,628 | 22,919 | 31,939 | 31,825 | 27,661 | 30,303 | 27,468 | 37,285 | 40,482 |
| Other industries | 9,567 | 11,525 | 11,527 | 13,664 | 14,627 | 15,456 | 15,022 | 17,983 | 17,373 | 17,201 |
| Addendum: | ||||||||||
| Other services1 | 211,155 | 182,951 | 200,121 | 210,606 | 221,199 | 221,514 | 231,611 | 242,098 | 250,799 | 267,070 |
- Other services include those services that are out of scope for this article, specifically maintenance and repair services, travel, transport, and government goods and services.
| Total selected services | Insurance services | Financial services | Charges for the use of intellectual property, n.i.e. | Telecom- munications, computer, and information services | Other business services | ||||
|---|---|---|---|---|---|---|---|---|---|
| Total | Research and development services | Professional and management consulting services | Technical, trade-related, and other business services | ||||||
| Exports | |||||||||
| All industries | 452,933 | 18,015 | 109,203 | 126,523 | 42,001 | 157,190 | 42,232 | 78,940 | 36,019 |
| Mining | 4,050 | 1 | (D) | (D) | 24 | 3,935 | 6 | 1,228 | 2,701 |
| Manufacturing | 99,231 | 290 | 766 | 40,832 | 5,459 | 51,883 | 25,485 | 18,944 | 7,454 |
| Wholesale trade | 24,337 | 2,562 | 30 | 8,204 | 357 | 13,185 | 4,687 | 7,781 | 717 |
| Retail trade | 10,751 | (D) | (D) | 3,030 | (D) | (D) | (D) | 1,484 | 4 |
| Information | 95,671 | (D) | (D) | 44,476 | 24,652 | 22,968 | 3,820 | 17,052 | 2,096 |
| Finance and insurance | 128,501 | 14,902 | 100,259 | (D) | (D) | 8,700 | 8 | 7,734 | 958 |
| Real estate and rental and leasing | 15,224 | 0 | 170 | 6,714 | (D) | (D) | (D) | 971 | 7,289 |
| Professional, scientific, and technical services | 50,459 | 0 | 61 | 13,612 | 2,601 | 34,184 | 7,004 | 21,505 | 5,676 |
| Other industries | 24,707 | 227 | 4,298 | 7,175 | 471 | 12,536 | 1,170 | 2,241 | 9,124 |
| Imports | |||||||||
| All industries | 276,810 | 50,599 | 28,957 | 53,440 | 39,628 | 104,185 | 35,231 | 42,156 | 26,799 |
| Mining | 4,074 | (D) | (D) | 47 | 34 | 3,932 | 8 | 271 | 3,653 |
| Manufacturing | 68,820 | 839 | 913 | 25,623 | 2,645 | 38,800 | 18,791 | 13,858 | 6,151 |
| Wholesale trade | 9,808 | (D) | (D) | 5,645 | 501 | 2,865 | 1,267 | 767 | 831 |
| Retail trade | 3,992 | (D) | (D) | (D) | 262 | (D) | (D) | 796 | (D) |
| Information | 42,167 | 21 | 204 | 11,699 | 9,287 | 20,955 | 8,864 | 7,158 | 4,933 |
| Finance and insurance | 88,990 | 45,352 | 26,716 | 750 | 6,190 | 9,981 | 75 | 9,307 | 599 |
| Real estate and rental and leasing | 1,277 | (D) | (D) | (D) | 2 | (D) | (D) | 289 | (D) |
| Professional, scientific, and technical services | 40,482 | 32 | 29 | 6,554 | 19,351 | 14,517 | 5,218 | 7,336 | 1,963 |
| Other industries | 17,201 | 3,054 | 943 | 1,632 | 1,356 | 10,215 | 950 | 2,372 | 6,893 |
- (D)
- Suppressed to avoid the disclosure of data of individual companies.
- n.i.e.
- Not included elsewhere
Trade in selected services by firm type
MNEs are the preeminent services traders. In 2017, MNEs accounted for 92 percent of selected services exports and 91 percent of imports. The dominant role of MNEs holds throughout the 2008–2017 period, which is the period covered by the most recent link between BEA data on international services and MNEs (chart 1). Additionally, MNEs accounted for most ($163.7 billion) of the $176.1 billion surplus on selected services trade in 2017. Among MNEs, U.S. parents were net exporters of selected services while U.S. affiliates were net importers.
Although non-multinational enterprises (non-MNEs) accounted for less than 10 percent of both exports and imports of selected services overall in 2017, their share of trade varied by type of service (table C). For example, non-MNEs accounted for larger shares of trade in financial services and insurance services compared with very small shares of trade in research and development services (within other business services) or charges for the use of intellectual property.

[Click chart to expand]
Information and communications technology (ICT) services and trade over ICT networks, which is approximated by potentially ICT-enabled services, are important to all services traders, including both MNEs and non-MNEs.9 In 2017, due to definitional similarities, potentially ICT-enabled services accounted for 97 percent of both exports and imports of selected services.
| Exports | Imports | |||||||
|---|---|---|---|---|---|---|---|---|
| All firms | Of which:1 | All firms | Of which:1 | |||||
| U.S. parents | U.S. affiliates | Non-MNEs | U.S. parents | U.S. affiliates | Non-MNEs | |||
| Trade in selected services | 452,933 | 381,381 | 96,989 | 37,483 | 276,811 | 216,514 | 100,434 | 25,103 |
| Insurance services | 18,015 | 15,382 | 6,320 | 1,968 | 50,599 | 29,800 | 29,272 | 11,281 |
| Financial services | 109,203 | 84,787 | 12,960 | 16,261 | 28,957 | 21,736 | 4,110 | 4,576 |
| Charges for the use of intellectual property n.i.e. | 126,523 | 114,988 | 24,731 | 4,644 | 53,440 | 45,262 | 27,395 | 1,242 |
| Telecommunications, computer, and information services | 42,001 | 37,174 | 8,691 | 2,030 | 39,628 | 27,265 | 13,202 | 1,756 |
| Other business services | 157,190 | 129,050 | 44,286 | 12,580 | 104,185 | 92,450 | 26,456 | 6,248 |
| Research and development services | 42,232 | 33,963 | 14,419 | 1,348 | 35,231 | 33,239 | 7,680 | 1,137 |
| Professional and management consulting services | 78,940 | 67,159 | 20,717 | 5,081 | 42,156 | 36,260 | 13,287 | 2,553 |
| Technical, trade-related, and other business services | 36,019 | 27,929 | 9,150 | 6,151 | 26,799 | 22,952 | 5,489 | 2,558 |
| Addenda: | ||||||||
| ICT services | 70,114 | 64,942 | 13,507 | 2,231 | 47,061 | 34,568 | 18,879 | 1,612 |
| Potentially ICT-enabled services | 438,992 | 371,135 | 93,039 | 34,454 | 268,045 | 208,820 | 96,684 | 24,520 |
- ICT
- Information and communications technology
- MNEs
- Multinational enterprises
- n.i.e.
- Not included elsewhere
Note. In this table, and in the statistics presented in the remainder of the article, there is an overlap between the statistics of U.S. parents and of majority-owned U.S. affiliates that arises when a given U.S. parent is, in turn, majority owned by a foreign company. For this reason, the sum of statistics for U.S. parents and U.S. affiliates does not equal the total for MNEs and the sum of statistics for U.S. parents, U.S. affiliates, and non-MNEs does not equal the total for all firms.
Exports
In 2017, exports of selected services totaled $452.9 billion. Over the period 2008–2017, selected services exports grew at an annual rate of 4.9 percent, reflecting strong growth in MNE exports (5.5 percent); the annual growth rate of non-MNE exports over the same period was just 0.1 percent. In line with their stronger growth, the share of exports attributable to MNEs grew from 87 percent in 2008 to 92 percent in 2017. From 2008 to 2017, the highest growth in MNE exports was in financial services and in professional and management consulting services.
By type of firm, U.S. parent companies accounted for the most selected services exports, with exports totaling $381.4 billion in 2017. U.S. affiliates exported $97.0 billion and non-MNEs exported $37.5 billion of selected services in 2017.
The largest category of selected services exports varied among MNEs and non-MNEs, but there was a high degree of similarity between U.S. parents and U.S. affiliates. In particular, transactions relating to the development and use of intellectual property, which is a valuable asset for many MNEs, were substantial. These assets tend to be non-rival in that they can be simultaneously used by units of the same MNE in different geographic locations.
- U.S. parents. For U.S. parents, other business services was the largest category of exports, followed by charges for the use of intellectual property. Together, these two categories accounted for 64 percent of U.S. parents’ selected services exports. Exports of professional and management consulting services and research and development services were the largest categories within other business services.10 Within charges for the use of intellectual property, the largest exports were related to industrial processes and computer software. The top export markets for U.S. parents were Ireland and the United Kingdom, which accounted for 12 percent and 10 percent, respectively, of selected services exports for U.S. parents (table D).
- U.S. affiliates. For U.S. affiliates, other business services and charges for the use of intellectual property were also the largest categories of exports and accounted for 71 percent of their selected services exports. Within other business services, the largest exports were professional and management consulting services and research and development services. The largest exports within charges for the use of intellectual property were for industrial processes and computer software. The top export markets for U.S. affiliates were Switzerland and the United Kingdom, which accounted for 12 percent and 10 percent, respectively, of exports of selected services, reflecting the importance of affiliated trade with foreign parent countries.
- Non-MNEs. For non-MNEs, the largest category of exports was financial services, which accounted for 43 percent of selected services exports by non-MNEs, reflecting particularly strong exports of financial management, financial advisory, and custody services. The top export market for non-MNEs was the United Kingdom Islands, Caribbean, which accounted for almost one-third of selected services exports by non-MNEs and reflected the dominance of financial services exports for those firms.
In addition to having the most selected services exports, U.S. parents also tended to trade with more countries than either U.S. affiliates or non-MNEs (chart 2). For example, almost half of U.S. parents exported to ten or more countries and only 20 percent exported to just one country. U.S. parent exports by country were also less concentrated in the top 5 destination markets, which combined to account for 42 percent of their selected services exports. Non-MNEs and U.S. affiliates more commonly exported to fewer countries and had a greater proportion of their exports destined to the top 5 markets. Among non-MNEs, 38 percent exported to just one country and only 30 percent exported to ten or more countries; the top 5 export markets accounted for 56 percent of their selected services exports. Among U.S. affiliates, 35 percent exported to just one country and only 36 percent exported to 10 or more countries. Of those U.S. affiliates that exported to a single country, the overwhelming majority—84 percent—exported to the country of their foreign parent. The top 5 countries accounted for 46 percent of U.S. affiliates’ selected services exports. It is interesting to note that the top 5 destination markets for exports varied greatly by firm type, with just one country (the United Kingdom) making it into the top 5 markets list for all three firm types.
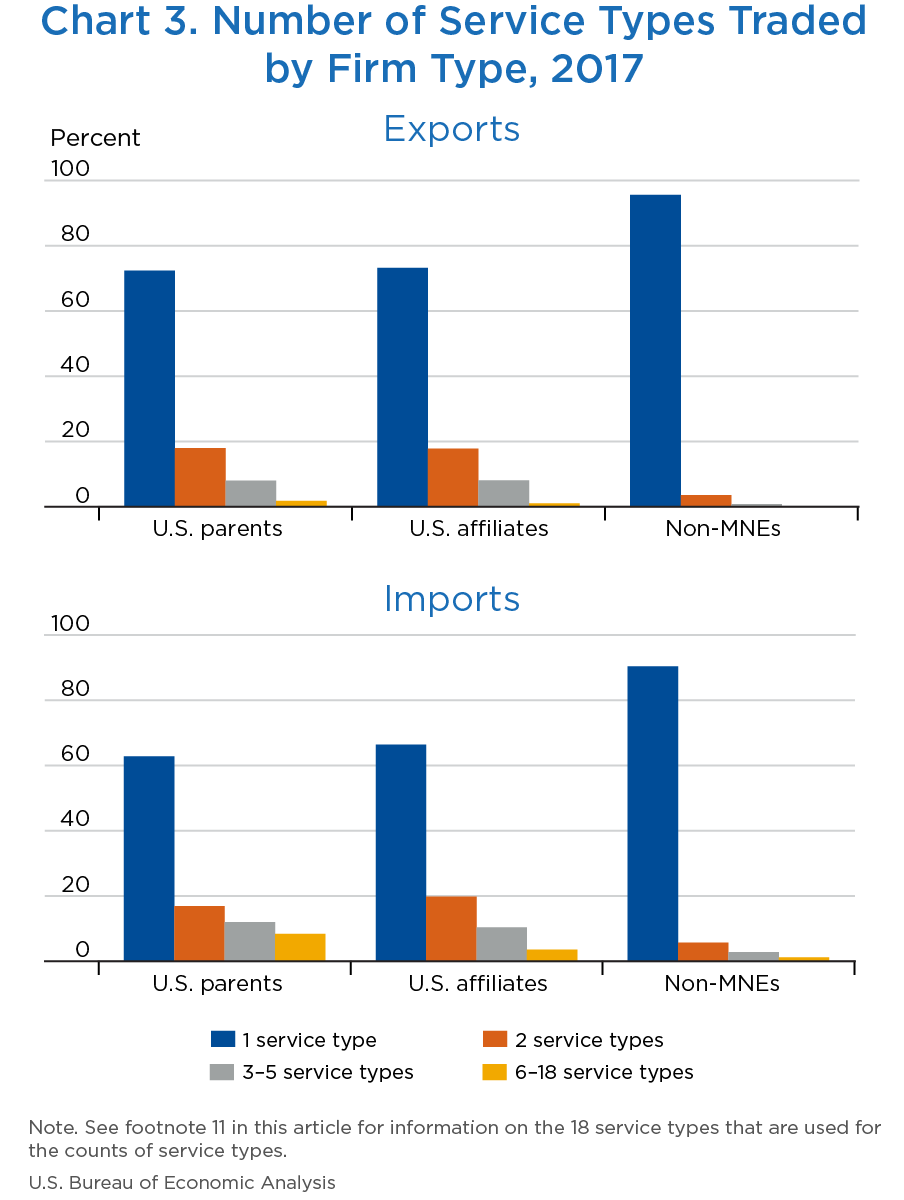
Among all exporters of selected services, the vast majority exported just one type of service (chart 3).11 However, this pattern was particularly pronounced among non-MNEs. In 2017, 96 percent of non-MNEs exported just one service type compared with 72 percent of U.S. parents and 73 percent of U.S. affiliates.
| Rank | U.S. Parents | U.S. Affiliates | Non-MNEs | ||||
|---|---|---|---|---|---|---|---|
| Country | Billions of dollars | Country | Billions of dollars | Country | Billions of dollars | ||
| Exports | |||||||
| All countries | 381.4 | All countries | 97.0 | All countries | 37.5 | ||
| 1 | Ireland | 46.3 | Switzerland | 11.7 | U.K. Islands, Caribbean | 12.1 | |
| 2 | United Kingdom | 38.7 | United Kingdom | 9.4 | United Kingdom | 3.3 | |
| 3 | Switzerland | 27.8 | Germany | 8.3 | Canada | 2.9 | |
| 4 | Canada | 27.6 | Ireland | 8.0 | Japan | 1.6 | |
| 5 | U.K. Islands, Caribbean | 21.3 | Japan | 6.8 | China | 1.3 | |
| Total top 5 | 161.6 | Total top 5 | 44.2 | Total top 5 | 21.2 | ||
| Imports | |||||||
| All countries | 216.5 | All countries | 100.4 | All countries | 25.1 | ||
| 1 | United Kingdom | 27.0 | Switzerland | 15.9 | Bermuda | 5.8 | |
| 2 | Switzerland | 18.8 | Bermuda | 11.4 | United Kingdom | 5.1 | |
| 3 | Germany | 16.2 | Japan | 10.7 | U.K. Islands, Caribbean | 1.9 | |
| 4 | India | 16.2 | Germany | 10.1 | Canada | 1.3 | |
| 5 | Japan | 14.4 | India | 8.9 | India | 1.0 | |
| Total top 5 | 92.6 | Total top 5 | 57.1 | Total top 5 | 15.2 | ||
- MNEs
- Multinational enterprises

[Click chart to expand]
[Click chart to expand]
Imports
In 2017, U.S. firms imported $276.8 billion of selected services (table C). Selected services imports grew at an annual rate of 3.8 percent over the period 2008–2017, driven by strong growth in MNE imports. Imports by MNEs grew at an annual rate of 4.3 percent for the period compared with relatively flat imports by non-MNEs. MNEs’ share of selected services imports grew from 87 percent in 2008 to 91 percent in 2017 (chart 1). Over the period, MNE imports of professional and management consulting services and charges for the use of intellectual property grew particularly rapidly.
- U.S. parents. U.S. parents accounted for $216.5 billion (or 78 percent) of selected services imports. Other business services was the largest category of services imports, with professional and management consulting services accounting for the largest portion of imports in the category. The top import source country for U.S. parents was the United Kingdom, which accounted for 12 percent of their selected services imports (table D).
- U.S. affiliates. U.S. affiliates imported $100.4 billion of selected services, with the largest imports in insurance services, charges for the use of intellectual property, and other business services, especially professional and management consulting services. Among U.S. affiliates, the top sources of imports were Switzerland and Bermuda, which accounted for 16 percent and 11 percent of selected services imports, respectively.
- Non-MNEs. Non-MNEs imported selected services of $25.1 billion. Among non-MNEs, imports of insurance services were the largest, accounting for 45 percent of their imports, as U.S. insurers sought to mitigate their risk exposure through the purchase of reinsurance from abroad. The top source countries for imports were Bermuda and the United Kingdom, which accounted for a combined 43 percent of selected services imports by non-MNEs.
As with exports, U.S. parents tend to import selected services from more countries than either U.S. affiliates or non-MNEs. In 2017, 45 percent of U.S. parents imported from 10 or more countries, compared with just 21 percent of U.S. affiliates and 22 percent of non-MNEs. The top 5 partner countries accounted for 43 percent of U.S. parents’ selected services imports compared with higher shares concentrated in the top source markets for both U.S. affiliates (57 percent) and non-MNEs (60 percent). More U.S. affiliates (50 percent) imported from just one country than did non-MNEs (32 percent) and U.S. parents (22 percent). It is noteworthy that U.S. affiliates import from fewer countries than they export to, reflecting the importance of trade—especially affiliated trade—with the country of their foreign parent for imports in particular. Among U.S. affiliates that imported from a single country, the overwhelming majority (85 percent) traded only with the country of their foreign parent. The top 5 partner countries for imports varied greatly by firm type, with just one country (India) making it into the top 5 source countries list for all three firm types.
As with exports, most non-MNEs (90 percent) imported just one type of service in 2017. Among MNEs, 66 percent of U.S. affiliates and 63 percent of U.S. parents imported just one type of service.
U.S. parents were net exporters of selected services in 2017, with a $164.9 billion balance on trade. U.S. parents accounted for 84 percent of selected services exports and 78 percent of imports. U.S. parents’ export intensity of sales, which is defined as the ratio of selected services exports to total sales, was 0.045 in 2017 (table E). Similarly, the import intensity of purchases, which is defined as the ratio of selected services imports to purchased inputs, where purchased inputs is calculated as sales minus value added, was 0.033.12
Overall, patterns in U.S. parents’ selected services trade contrast with those in their goods trade. In 2017, U.S. parents that traded selected services exported $533.0 billion and imported $687.6 billion in goods, making them net importers of goods.13 Much of the deficit on goods trade was attributable to parents classified in wholesale trade and retail trade.
| Total number of services-trading firms | Services exporters | Services importers | |||||||
|---|---|---|---|---|---|---|---|---|---|
| Number of firms | Exports of selected services (millions of dollars) | Services trade intensity1 | Employment in the United States (thousands) | Number of firms | Imports of selected services (millions of dollars) | Services trade intensity2 | Employment in the United States (thousands) | ||
| All U.S. parents | 1,802 | 1,553 | 381,381 | 0.045 | 15,525 | 1,242 | 216,514 | 0.033 | 16,327 |
| By employment size class | |||||||||
| Small (0–500) | 545 | 449 | 23,409 | 0.258 | 55 | 316 | 10,803 | 0.217 | 40 |
| Medium |
159 | 133 | 8,249 | 0.103 | 83 | 100 | 4,487 | 0.171 | 60 |
| Large |
712 | 629 | 104,867 | 0.068 | 2,081 | 514 | 55,954 | 0.054 | 1,706 |
| Very large (> 10,000) | 386 | 342 | 244,856 | 0.036 | 13,306 | 312 | 145,271 | 0.027 | 14,522 |
| By industry | |||||||||
| Mining | 40 | 31 | 3,039 | 0.052 | 131 | 32 | (D) | 0.081 | 144 |
| Manufacturing | 508 | 415 | 92,595 | 0.029 | 4,020 | 378 | 60,939 | 0.027 | 3,854 |
| Wholesale trade | 126 | 106 | 14,784 | 0.015 | 960 | 84 | 8,775 | 0.012 | 773 |
| Retail trade | 46 | 37 | 10,501 | 0.012 | 3,166 | 33 | 3,514 | 0.010 | 4,851 |
| Information | 145 | 137 | 89,128 | 0.101 | 1,631 | 109 | 38,385 | 0.083 | 1,535 |
| Finance and insurance | 466 | 417 | 100,499 | 0.053 | 2,519 | 302 | 59,708 | 0.039 | 2,442 |
| Real estate and rental and leasing | 33 | 30 | 12,802 | 0.167 | 240 | 15 | (D) | 0.085 | 81 |
| Professional, scientific, and technical services | 241 | 228 | 40,071 | 0.134 | 987 | 155 | 28,916 | 0.239 | 867 |
| Other industries | 197 | 152 | 17,963 | 0.057 | 1,871 | 134 | 11,424 | 0.052 | 1,781 |
- (D)
- Suppressed to avoid the disclosure of data of individual companies.
- For exports, services trade intensity is defined as selected services exports divided by total sales.
- For imports, services trade intensity is defined as selected services imports divided by purchased inputs, where purchased inputs is calculated as sales minus value added.
By employment size class
Each size class of U.S. parents exported more selected services than it imported through international trade. Very large firms, which are those with at least 10,000 employees, were the largest services traders and accounted for $99.6 billion of the overall $164.9 billion services trade surplus for U.S. parents. Despite the dominance of larger firms, small- and medium-sized U.S. parents combined to account for 8 percent of exports and 7 percent of imports in 2017.
Exports
Very large firms dominated U.S. parents’ exports in 2017, accounting for $244.9 billion, or 64 percent, of selected services exports by U.S. parents. This was lower than the proportion of value added attributable to very large U.S. parents that are services traders (79 percent).14 Among very large U.S. parents, 45 percent exported to 25 or more countries (chart 4). More than half of very large parents exported multiple service types (chart 5). However, relative to their size, very large U.S. parents were less-intensive exporters than all other size classes with a services trade intensity ratio of 0.036 and about $18,000 of exported services per employee. Small firms, which are those with 500 employees or fewer, contributed $23.4 billion to U.S. parents’ selected services exports and were the most intensive exporters relative to their size, with a services trade intensity ratio of 0.258. As a group, small U.S. parents exported just over $425,000 for each person that they employed, which was more than twenty times the average among very large parents and reflected both their more export-intensive operations and a different mix in the types of services that they export.
Small U.S. parents tended not to trade with a large number of countries, with 37 percent exporting selected services to just one country and only 13 percent exporting to 25 or more countries. In contrast to very large parents, small U.S. parents generally specialized in exporting a single type of service.
The patterns in exports by medium (501 to 1,000 employees) and large (1,001 to 10,000 employees) U.S. parents tended to be more similar to each other than to any other groups in terms of the number of partner countries and the number of service types traded. Their services export intensity ratios fell in between those of very large and small firms at 0.103 and 0.068, respectively.
Imports
As with exports, very large parents dominated imports, accounting for $145.3 billion (or two-thirds) of U.S. parents’ selected services imports. Medium-sized firms were the smallest contributors to selected services imports by U.S. parents, accounting for just two percent of imports by all U.S. parents. In terms of services import intensity, the pattern was generally the same as for exports wherein very large U.S. parents were the least intensive importers (with a trade intensity ratio of 0.027) and small firms were the most intensive (with a trade intensity ratio of 0.217). Import intensities for medium and large U.S. parents fell in between those for very large and small parents. Similarly, imports per employee was the lowest for very large U.S. parents at about $10,000, while it was highest for small parents at just over $270,000, partly reflecting differences in the composition of imports (by type) between small firms and very large firms as well as their more import-intensive operations.
Very large U.S. parents generally imported selected services from more countries than any other size class. Among very large parents, 42 percent imported from 25 or more countries and only 15 percent imported from a single country. In contrast, among small U.S. parents, 31 percent imported from just one country and only 11 percent imported from 25 or more countries.
Small firms and, to a lesser extent, medium firms, tended to import fewer types of services than large or very large firms among U.S. parents. For example, only 39 percent of very large U.S. parents imported just one service type compared with 84 percent of small firms and 72 percent of medium firms. Similarly, 20 percent of very large U.S. parents imported more than six types of services compared with only one percent of small or medium firms importing that many types of services.

[Click chart to expand]

[Click chart to expand]
By industry
Finance and insurance and manufacturing were the top two industry categories among selected-services-trading U.S. parents. They combined to account for 51 percent of U.S. parents’ exports and 56 percent of imports of selected services in 2017. U.S. parents in information had the largest surplus, with exports exceeding imports by $50.7 billion in 2017. For most major industries (except mining) that are shown in table E, there is a surplus in services trade.
Exports
U.S. parents that export selected services were spread across all industry categories, including both those that are typically associated with the production of services and those that mainly produce goods. U.S. parents classified in the finance and insurance sector had the largest selected services exports, accounting for 26 percent of U.S. parents’ exports. Among U.S. parents in this sector, the largest exports were of financial management, financial advisory, and custody services; credit card and other credit-related services; and securities lending, electronic funds transfer, and other services. The next largest services-exporting industry among U.S. parents was manufacturing, which accounted for 24 percent of U.S. parent selected services exports, followed by information (23 percent). U.S. manufacturing parents’ exports were driven by transactions relating to their valuable intellectual property, which includes patents on products and processes. Charges for the use of intellectual property (mainly industrial processes) and research and development services (within the category of other business services) were particularly large for U.S. manufacturing parents, with the majority of those transactions being with their foreign affiliates.
In terms of services export intensity, U.S. parents classified in real estate and rental and leasing, for which the largest share of selected services exports were in other business services, particularly in operating leasing and industrial engineering, and in charges for the use of intellectual property, particularly in industrial processes, were the most intensive exporters relative to their sales, with a trade intensity ratio of 0.167, followed by those in professional, scientific, and technical services industries, which had a trade intensity ratio of 0.134. The least intensive exporters relative to their sales were U.S. parents classified in retail trade and wholesale trade. Although wholesale and retail trade are service activities, the products sold by U.S. parents in those industries are primarily goods, so the value of the services that they provide are included indistinguishably in the value of the goods sold.
Imports
As with exports, U.S. parents that import selected services were spread across all industry categories. U.S. parents classified in manufacturing and in finance and insurance accounted for the largest shares of imports—each accounted for 28 percent of U.S. parents’ imports in 2017. Like exports, the largest imports for U.S. manufacturing parents were research and development services (within other business services) and charges for the use of intellectual property, particularly rights related to industrial processes. For U.S. parents in finance and insurance, the largest imports were of reinsurance services; credit card and other credit-related services; financial management, financial advisory, and custody services; and professional and management consulting services.
Relative to their total purchased inputs, U.S. parents classified in professional, scientific, and technical services had the highest import intensity ratio, by far, at 0.239.
By affiliation
For U.S. parents, the majority of exports (54 percent) and imports (61 percent) of selected services were with affiliated parties in 2017 (table F). Of the trade with affiliated parties, 86 percent of exports and 75 percent of imports were traded between U.S. parents and their foreign affiliates, resulting in a surplus of $80.3 billion. The remainder of affiliated trade was between those U.S. parents that are also U.S. affiliates and their foreign parent groups, for which there was a trade deficit of $4.6 billion.
The shares of exports and imports by type of service that were accounted for by affiliated trade are shown in chart 6. For most selected service types, affiliated transactions accounted for either the majority of both exports and imports, for example, for business and management consulting and public relations services and research and development services, or the minority of both exports and imports, for example, for advertising and legal services. However, the share with affiliated parties was much higher for imports than for exports for certain services, most notably operating leasing services and computer services, which, for these two services in particular, reflects the underlying trade deficit in affiliated services for U.S. parents. The share with affiliated parties was higher for exports than for imports of telecommunications services.
Exports
Although affiliated trade accounted for the majority of exports by U.S. parents, it accounted for the majority of exports for only 5 of the 12 selected service types shown in chart 6. The service types for which the share of exports that is affiliated was the largest were business and management consulting and public relations services (92 percent), research and development services (89 percent), and telecommunications services (75 percent). The service types for which the share of exports that is affiliated was the smallest (or equivalently, the share of exports that is unaffiliated was the largest) were legal services (3 percent), operating leasing services (11 percent), and architectural and engineering services (20 percent).
Imports
Imports of selected services by U.S. affiliates were predominantly affiliated for half of the service types shown in chart 6. The service types for which the share of imports that is affiliated was the largest are operating leasing services (89 percent) and research and development services (88 percent). The service types for which the share of imports that is affiliated was the smallest were legal services (14 percent), architectural and engineering services (29 percent), and telecommunications services (29 percent).
| Exports | Imports | Balance | |
|---|---|---|---|
| Trade in selected services | 381,381 | 216,514 | 164,867 |
| Unaffiliated | 173,887 | 84,744 | 89,143 |
| Affiliated | 207,495 | 131,770 | 75,724 |
| With their foreign affiliates | 179,045 | 98,728 | 80,317 |
| With their foreign parent groups | 28,450 | 33,042 | −4,592 |

[Click chart to expand]
By partner country
The top 10 trading partners of U.S. parents based on total trade (exports plus imports) in selected services are shown in chart 7 for 2017. The top 10 trading partners accounted for 61 percent of U.S. parents’ trade. The United Kingdom was the top trading partner for U.S. parents, followed by Ireland and Switzerland. U.S. parents had the largest trade surplus with Ireland ($34.5 billion) and the largest trade deficit with India ($10.1 billion). The share of U.S. parents’ trade in selected services with countries hosting their majority-owned foreign affiliates (as opposed to countries in which they do not have a majority-owned foreign affiliate) and the breakdown of trade by affiliation with those countries are shown in chart 8. U.S. parents trade heavily with countries that host their foreign affiliates. In 2017, such trade accounted for 74 percent of their trade, the majority of which (63 percent) was with affiliated parties.15
Exports
The top 10 trading partner countries accounted for $234.2 billion, or 61 percent, of selected services exports by U.S. parents in 2017. The largest export markets for U.S. parents were Ireland, the United Kingdom, and Switzerland. Exports to countries that hosted their foreign affiliates accounted for 76 percent of U.S. parents’ exports; 61 percent of that trade was with affiliated parties. Highlights for the top three export markets include the following:
- Ireland. Exports to Ireland by U.S. parents were $46.3 billion, accounting for more than 12 percent of exports by U.S. parents in 2017. The vast majority of exports to Ireland (97 percent) were by parents with foreign affiliates in Ireland, and more than 90 percent of those exports were to affiliated parties. Ireland’s 97 percent share was the largest such share among the top 10 U.S. parent trading partners.
- United Kingdom. Exports to the United Kingdom were $38.7 billion, accounting for more than 10 percent of all exports by U.S. parents in 2017. Of those exports, 92 percent were by U.S. parents with foreign affiliates in the United Kingdom; however, the majority of that trade (56 percent) was with unaffiliated parties.
- Switzerland. Exports to Switzerland were $27.8 billion. The majority of services (73 percent) were exported by U.S. parents with foreign affiliates in Switzerland, and 91 percent of those exports were supplied to affiliated parties.
Imports
The top 10 trading partner countries accounted for $132.7 billion, or 61 percent, of selected services imports by U.S. parents in 2017. The main import source countries were the United Kingdom, Switzerland, and Germany. Imports from countries that hosted their foreign affiliates accounted for 71 percent of U.S. parents’ imports; 66 percent of that trade was with affiliated parties. Highlights for the top three import source countries include the following:
- United Kingdom. Imports from the United Kingdom by U.S. parents were $27.0 billion, accounting for 12 percent of imports by U.S. parents in 2017. Imports were predominantly by U.S. parents with foreign affiliates in the United Kingdom (83 percent), and 65 percent of those imports were supplied by affiliated parties.
- Switzerland. Imports from Switzerland were $18.8 billion. The majority of these services were imported by U.S. parents with foreign affiliates in Switzerland (52 percent), and the majority of those imports (52 percent) were from affiliated parties.
- Germany. Imports from Germany were $16.2 billion, with 83 percent accounted for by U.S. parents with foreign affiliates in Germany, and more than three-fourths of those imports were supplied by affiliated parties.

[Click chart to expand]

[Click chart to expand]
U.S. affiliates of foreign multinationals were net importers of selected services, with a $3.4 billion deficit on trade in 2017. U.S. affiliates accounted for 21 percent of selected services exports and 36 percent of imports. Relative to sales, U.S. affiliates were slightly more intensive services traders than U.S. parents. U.S. affiliates’ export intensity of sales, which is defined as the ratio of selected services exports to total sales, was 0.046 (table G). Similarly, the import intensity of purchases, which is defined as the ratio of selected services imports to purchased inputs, where purchased inputs is calculated as gross output (sales plus inventory change) minus value added, was 0.061 (table G).
U.S. affiliates were also net importers of goods. In 2017, services-trading U.S. affiliates exported $185.2 billion and imported $366.6 billion in goods for a deficit on trade in goods of $181.4 billion.16 As with U.S. parents, the largest net importers of goods among U.S. affiliates were those firms classified in wholesale trade.
| Total number of services-trading firms | Services exporters | Services importers | |||||||
|---|---|---|---|---|---|---|---|---|---|
| Number of firms | Exports of selected services (millions of dollars) | Services trade intensity1 | Employment in the United States (thousands) | Number of firms | Imports of selected services (millions of dollars) | Services trade intensity2 | Employment in the United States (thousands) | ||
| All U.S. affiliates | 1,126 | 836 | 96,989 | 0.046 | 2,696 | 928 | 100,434 | 0.061 | 3,129 |
| By employment size class | |||||||||
| Small (0–500) | 509 | 372 | 15,969 | 0.179 | 51 | 393 | 15,390 | 0.249 | 60 |
| Medium |
147 | 97 | 12,307 | 0.104 | 58 | 127 | 7,269 | 0.079 | 77 |
| Large |
340 | 263 | 41,335 | 0.061 | 754 | 292 | 43,677 | 0.073 | 838 |
| Very large |
130 | 104 | 27,378 | 0.023 | 1,832 | 116 | 34,098 | 0.038 | 2,154 |
| By industry | |||||||||
| Mining | 28 | 23 | 2,410 | 0.090 | 69 | 24 | 3,105 | 0.158 | (D) |
| Manufacturing | 400 | 253 | 22,060 | 0.025 | 923 | 363 | 24,947 | 0.035 | 1,090 |
| Wholesale trade | 156 | 114 | 17,534 | 0.036 | 219 | 116 | 7,064 | 0.017 | 227 |
| Retail trade | 14 | 9 | 229 | 0.003 | 295 | 13 | 663 | 0.010 | 337 |
| Information | 57 | 55 | 10,091 | 0.079 | 183 | 48 | 5,421 | 0.062 | 178 |
| Finance and insurance | 275 | 240 | 21,135 | 0.060 | 354 | 213 | 35,348 | 0.136 | 351 |
| Real estate and rental and leasing | 28 | 18 | 2,730 | 0.356 | 10 | 14 | 13 | 0.007 | (D) |
| Professional, scientific, and technical services | 74 | 62 | 18,682 | 0.293 | 186 | 60 | 19,070 | 0.464 | 198 |
| Other industries | 94 | 62 | 2,117 | 0.036 | 456 | 77 | 4,804 | 0.086 | 652 |
- (D)
- Suppressed to avoid the disclosure of data of individual companies.
- For exports, services trade intensity is defined as selected services exports divided by total sales.
- For imports, services trade intensity is defined as selected services imports divided by purchased inputs, where purchased inputs is calculated as gross output (sales plus inventory change) minus value added.
By employment size class
Large firms—those with 1,001 to 10,000 employees—were the predominant services traders, having the largest selected services exports and imports of any size class. However, very large firms—those with more than 10,000 employees—were the largest contributors to the deficit on U.S. affiliates’ services trade, with a deficit on services trade of −$6.7 billion in 2017. In contrast, both small and medium U.S. affiliates were net exporters, combining for a surplus of $5.6 billion on services trade.
Exports
While very large firms dominated services exports by U.S. parents, that was not the case among U.S. affiliates; large firms (1,001 to 10,000 employees) accounted for 43 percent of exports and had the largest selected services exports of any size class. The predominance of large affiliates in services trade exceeded their contribution to total U.S. affiliate value added, where large firms that are services traders accounted for 34 percent of the total. Also, small- and medium-sized firms accounted for larger shares of U.S. affiliate exports than for U.S. parent exports. For example, small firms accounted for 16 percent of U.S. affiliates’ exports.
In 2017, large U.S. affiliates exported $41.3 billion in selected services. Although large firms accounted for the most exports among U.S. affiliates, very large firms tended to trade with more countries (chart 9), with 40 percent of very large firms exporting to 25 or more countries compared with 23 percent of large affiliates having that many trading partners. By firm size, the proportion of U.S. affiliates that exported to only one country generally decreased as firm size increased. For example, 45 percent of small firms exported to just one country, compared with 20 percent of very large firms exporting to one country. A similar pattern can be noted for the number of service types traded. Among small U.S. affiliates, 90 percent exported just one type of service, but this share decreases to two-thirds among medium firms and to just over half among very large affiliates (chart 10).
Relative to their sales, small U.S. affiliates were the most intensive exporters, with a services export intensity of sales ratio of 0.179. Trade intensities generally declined with increasing firm size among U.S. affiliates. Very large U.S. affiliates’ export intensity ratio was just 0.023 in 2017. Likewise, average services exports per employee was over $300,000 among small U.S. affiliates compared with about $15,000 for very large affiliates. Like small U.S. parents, small U.S. affiliates tended to export a different mix of services, mainly in finance and insurance, and their operations were more export-intensive than larger firms.
Imports
As with exports, large firms were the top importers of selected services among all U.S. affiliate services traders. Large U.S. affiliates imported $43.7 billion of selected services in 2017, followed by very large U.S. affiliates, which imported $34.1 billion. Both large and very large U.S. affiliates were net importers, and together they more than accounted for the overall deficit on selected services trade for U.S. affiliates.
The patterns of trade intensity for U.S. affiliates’ imports were generally similar to patterns of trade intensity for their exports. Trade intensity decreased with increasing firm size. Small U.S. affiliates were the most intensive importers, relative to their total purchased imports, with a services trade intensity ratio of 0.249. Very large U.S. affiliates, on the other hand, had a services trade intensity ratio of just 0.038. Small U.S. affiliates imported an average of more than $250,000 in services per employee, much more than very large affiliates, which imported an average of about $15,000 per employee, repeating the pattern observed for exports by U.S. affiliates and for U.S. parent trade and reflecting especially large imports of reinsurance by small insurers.
A higher proportion of U.S. affiliates tended to source their imports of selected services from a single country in each size class, when compared with the proportion for U.S. parents in the same size class. For example, 59 percent of small U.S. affiliates imported from just one country and 33 percent of very large U.S. affiliates imported from just one country, compared with 31 and 15 percent for U.S. parents, respectively. The greater concentration of services imports from one or a few countries among U.S. affiliates reflects the importance of transactions with foreign parents in their trade.
In terms of service types traded, a large proportion (81 percent) of small U.S. affiliates imported just one type of service. The number of U.S. affiliates importing more than one type of service tends to increase with size. Among very large U.S. affiliates, 44 percent imported just one type of service.

[Click chart to expand]

[Click chart to expand]
By industry
U.S. affiliates in finance and insurance and in manufacturing were the main traders of selected services. These top two industry categories combined to account for 45 percent of U.S. affiliates’ exports and 60 percent of their imports. Although there was a deficit on U.S. affiliates’ selected services trade overall, there was some variation by industry. U.S. affiliates in finance and insurance were the biggest net importers, whereas affiliates in wholesale trade, in information, and in real estate and rental and leasing had the largest surpluses on trade in selected services.
Exports
U.S. affiliates in manufacturing accounted for the largest share of selected services exports by industry category in 2017 (23 percent). Although manufacturing firms are typically associated with the production of goods, they often have secondary activities in services industries or have services transactions with their foreign parent group, particularly in relation to the use of intellectual property. The largest exports among U.S. affiliates in manufacturing were for charges for the use of intellectual property, particularly industrial processes, and for research and development services. The next most significant services-exporting industry category among U.S. affiliates was finance and insurance, which accounted for 22 percent of U.S. affiliate exports and reflected large exports of financial management, financial advisory, and custody services; reinsurance services; and securities brokerage, underwriting, and related services.
In terms of services trade intensity, the size of exports relative to sales was relatively low in manufacturing, with a trade intensity ratio of 0.025, and the ratio was also low in retail trade (0.003).17 Export trade intensities were highest among U.S. affiliates in real estate and rental and leasing, and professional, scientific, and technical services.
Imports
U.S. affiliates classified in finance and insurance accounted for the largest share of selected services imports by industry category, accounting for 35 percent of U.S. affiliates’ services imports. For U.S. affiliates in finance and insurance, the largest imports were of reinsurance services and professional and management consulting services. U.S. affiliates in finance and insurance were net importers of services, with a $14.2 billion deficit on services trade; affiliates in insurance more than accounted for that deficit.
U.S. affiliates classified in manufacturing had the next largest imports of selected services, with imports of $24.9 billion. The largest imports among manufacturing affiliates were charges for the use of intellectual property, particularly industrial processes, the majority of which was attributable to transactions with the foreign parent group.
Import intensity ratios, which are defined relative to purchased inputs, ranged from a low of 0.007 for affiliates in real estate and rental and leasing to a high of 0.464 for affiliates in professional, scientific, and technical services.
By affiliation
For U.S. affiliates, the majority of exports (71 percent) and imports (63 percent) of selected services were with affiliated parties in 2017 (Table H). As expected, the majority of trade with affiliated parties took place between U.S. affiliates and their foreign parent group (66 percent of exports and 84 percent of imports), resulting in a trade deficit of $8.1 billion. The remainder of affiliated trade, which had a trade surplus of $12.8 billion, was between U.S. affiliates that are also U.S. parents and their foreign affiliates. The shares of exports and imports accounted for by affiliated trade are shown in chart 11. For many service types, affiliated transactions accounted for either the majority of both exports and imports, for example, for business and management consulting and public relations services and for research and development services. For some other service types, affiliated transactions accounted for the minority of both imports and exports—for example, for architectural and engineering services and information services. However, the share with affiliated parties was much higher for imports than exports for computer services and financial services. The share with affiliated parties was higher for exports than imports for legal services.
Exports
Affiliated trade accounted for the majority of selected services exports for 6 of the 10 unsuppressed service types shown in chart 11. The services for which the share of exports that is affiliated was the largest were business and management consulting and public relations services, for which nearly 100 percent of exports were affiliated, advertising services (98 percent), and research and development services (98 percent). The service types for which the share of exports that is affiliated was the smallest (or, equivalently, the share of exports that is unaffiliated was the largest) were information services (3 percent), architectural and engineering services (16 percent), and computer services (36 percent).Imports
Affiliated trade accounted for the majority of selected services imports for 8 of the 12 service types shown in chart 11. The service types for which the share of imports that is affiliated was the largest were charges for the use of intellectual property, for which 97 percent of imports by U.S. affiliates was affiliated, illustrating the importance to U.S. affiliates of intellectual property obtained from the foreign parent group, followed by computer services (95 percent) and operating leasing services (95 percent). The service types for which the share of imports that is affiliated was the smallest were legal services (18 percent), information services (46 percent), and telecommunications services (49 percent).
| Exports | Imports | Balance | |
|---|---|---|---|
| Trade in selected services | 96,989 | 100,434 | −3,446 |
| Unaffiliated | 28,549 | 36,671 | −8,122 |
| Affiliated | 68,440 | 63,764 | 4,676 |
| With their foreign affiliates | 23,106 | 10,291 | 12,815 |
| With their foreign parent groups | 45,333 | 53,473 | −8,140 |

[Click chart to expand]
By partner country
The top 10 trading partners of U.S. affiliates based on total trade (exports plus imports) in selected services for 2017 are shown in chart 12. The top 10 trading partners accounted for 74 percent of total trade. Switzerland was the top trading partner for U.S. affiliates, followed by Germany and Japan. U.S. affiliates had the largest trade surplus with Singapore ($2.5 billion, not shown in chart 12) and had the largest trade deficit with Bermuda ($9.0 billion). The share of U.S. affiliates’ trade that takes place with the country of their foreign parents, and the breakdown of that trade by affiliation are shown in chart 13. Trade with the country of their foreign parent accounted for 43 percent of total trade by U.S. affiliates, and 82 percent of that trade was with affiliated parties.18
Exports
The top 10 trading partner countries accounted for $61.9 billion, or 64 percent, of selected services exports by U.S. affiliates in 2017. The largest export markets for U.S. affiliates were Switzerland, the United Kingdom, and Germany. Exports from U.S. affiliates to the country of their foreign parents accounted for 30 percent of exports, and 91 percent of those exports were to affiliated parties. Highlights for the top three export markets include the following:
- Switzerland. Exports to Switzerland were $11.7 billion, accounting for 12 percent of exports by U.S. affiliates. Exports by U.S. affiliates with a foreign parent in Switzerland accounted for 41 percent of U.S. affiliates’ exports to Switzerland; the vast majority (95 percent) of those exports were to affiliated parties.
- United Kingdom. Exports to the United Kingdom were $9.4 billion; more than one-third (36 percent) was exported by U.S. affiliates with foreign parents in the United Kingdom, and just over two-thirds (68 percent) of those exports were to affiliated parties.
- Germany. Exports to Germany were $8.3 billion; nearly two-thirds (66 percent) were exported by U.S. affiliates with foreign parents in Germany, and nearly all of those exports (99 percent) were to affiliated parties. Of the top 10 countries, Germany had the largest share of exports accounted for by U.S. affiliates with foreign parents in the country.
Imports
The top 10 trading partner countries accounted for $84.3 billion, or 84 percent, of selected services imports by U.S. affiliates in 2017. The largest import source countries were Switzerland, Bermuda, and Japan. U.S. affiliates tended to import from the country of their foreign parents (55 percent) and most imports from the country of the foreign parent were from affiliated parties (77 percent). Highlights for the top three import source countries include the following:
- Switzerland. Imports from Switzerland were $15.9 billion, accounting for 16 percent of imports by U.S. affiliates. The majority of U.S. affiliates’ imports (57 percent) were by U.S. affiliates with foreign parents in Switzerland; however nearly two-thirds (65 percent) of those imports were from unaffiliated parties.
- Bermuda. Imports from Bermuda were $11.4 billion, contributing to Bermuda being the trading partner with which U.S. affiliates have the largest trade deficit of any trading partner. Imports by U.S. affiliates with foreign parents in the country accounted for 30 percent of imports from Bermuda; however, just shy of 100 percent of those imports were from unaffiliated parties, reflecting that the vast majority of imports from Bermuda by all companies are in insurance services, which are always classified as unaffiliated trade.19
- Japan. Imports from Japan were $10.7 billion. Among the top 10 countries, Japan had the largest share of imports by U.S. affiliates from countries of their foreign parents (94 percent), and nearly all (97 percent) of those imports were supplied by affiliated parties.

[Click chart to expand]

[Click chart to expand]
- The last article in this series covered data for 2008. See Kevin Barefoot and Jennifer Koncz-Bruner, “A Profile of U.S. Exporters and Importers of Services,” Survey of Current Business 92 (June 2012). For more information on how the statistics presented in this article compare to those published in 2012, see the FAQ “What information does the Bureau of Economic Analysis publish on the characteristics of international services traders?” on BEA’s website.
- This supplements BEA’s expansive statistics on international services, including those featured in an annual article on international services that presents a broad concept of international services supplied to foreign and U.S. persons by including statistics on both trade in services and services supplied through the affiliates of MNEs. For the latest article in that series, see Shari Allen, Thomas Anderson, Alexis Grimm and Michael Mann, “U.S. International Services: Trade in Services in 2018 and Services Supplied through Affiliates in 2017,” Survey of Current Business 99 (October 2019).
- BEA also administers surveys that collect information on transport services and maintenance and repair services, but those data are not in scope for this article.
- The FAQ “What information does the Bureau of Economic Analysis publish on the characteristics of international services traders?” on BEA’s website provides details on how the statistics in this article were prepared, including how the link between surveys was established, how trade statistics based on a combination of survey data and other calculations were attributed to specific companies, and how industries were assigned. The FAQ also presents a comparison of the scope of the services covered in this article with the 2012 article in this series.
- In this article, “MNE” is defined more narrowly than in other BEA statistical products. In this article, “MNE” includes U.S. parents and majority-owned U.S. affiliates, but it does not include minority-owned U.S. affiliates. As a result, “non-MNEs” includes minority-owned U.S. affiliates in this article. See “Types of Firms that Trade Services” for more information.
- For comparable firm-level information on all services traders, BEA’s international trade in services data would also need to be linked to external data that included information on the operations of non-MNEs, such as data collected by the U.S. Census Bureau, to capture characteristics of non-MNE services traders.
- U.S. services traders are classified under the industry that best describes the major activity of their consolidated U.S. enterprise. See the FAQ “What information does the Bureau of Economic Analysis publish on the characteristics of international services traders?” on BEA’s website for more information on how the industries were assigned and the activities that they reflect.
- In 2018, U.S. stock exchanges accounted for over half (55 percent) of the value of equities traded on all the world’s exchanges, based on data from the World Federation of Exchanges.
- Potentially ICT-enabled services are services that can predominantly be delivered remotely over ICT networks. For more information on the definition of ICT and potentially ICT-enabled services and to see what service types are included in each, see Alexis Grimm, “Trends in U.S. Trade in Information and Communications Technology (ICT) Services and in ICT-Enabled Services,” Survey of Current Business 96 (May 2016).
- Exports of research and development services by U.S. parents may reflect transactions related to cost-sharing agreements between U.S. parents and their foreign affiliates. See Raymond Mataloni Jr., Derrick Jenniges, Sarah Stutzman, and Yiran Xin, “Strategic movement of intellectual property within U.S. multinational enterprises,” BEA Working Paper No. WP2018-8.
- The 18 service types that are considered for the counts of service types in charts 3, 5, and 10 correspond to the following service types that appear in International Services table 2.1: insurance services; financial services; charges for the use of intellectual property n.i.e.; telecommunications, computer, and information services; research and development services; legal services; accounting, auditing, and bookkeeping services; business management consulting and public relations services; advertising; architectural and engineering services; construction; industrial engineering; mining; operating leasing services; trade-related services; sports and performing arts; training services; and other business services n.i.e.
- Preferably, purchased inputs for U.S. parents would have been calculated as gross output (sales plus inventory change) minus value added. However, the measure of purchased inputs does not include inventory change because inventory change data are not available. However, inventory change is typically very small. For example, total inventory change accounted for less than 0.1 percent of sales (as measured by total shipments) for manufacturing in 2016 according to the Census 2016 Annual Survey of Manufactures.
Statistics on trade in goods presented in this article are derived from BEA’s AMNE surveys and represent trade in goods by companies that are also services traders. Goods exports by all U.S. parents totaled $792.5 billion in 2017, and goods imports totaled $921.3 billion. As such, two-thirds of goods exports and three-quarters of goods imports by all U.S. parents were attributable to parents that trade selected services.
Trade in goods statistics collected on BEA’s AMNE surveys differ from those featured in BEA’s International Transactions Accounts, which are collected by the U.S. Census Bureau. The U.S. Census Bureau publishes an annual article, “A Profile of U.S. Importing and Exporting Companies,” that features goods traders. The latest article in that series can be accessed at https://www.census.gov/foreign-trade/Press-Release/edb/2017/index.html
- Value added is a measure of the goods and services produced by U.S. parents or U.S. affiliates and their direct contribution to U.S. gross domestic product (GDP). Statistics on the value added of MNEs are available on BEA’s website.
- Trade with affiliated parties includes trade with any foreign affiliate (including both majority and minority-owned) or with a member of the foreign parent group.
- As noted previously, statistics on trade in goods in this article are based on BEA’s AMNE surveys and represent trade in goods by companies that are also services traders. In 2017, goods exports by all U.S. affiliates were $382.7 billion and goods imports were $686.1 billion. Of these totals, services-trading U.S. affiliates accounted for 48 percent of goods exports and 53 percent of goods imports.
- The very low export intensity in retail trade industries may reflect a predominant focus on serving the U.S. market, rather than exporting, by affiliates in that industry category. In this article, only trade between U.S. residents and nonresidents is in-scope; services supplied to local markets through the affiliates of MNEs is not included in the analysis.
The country of the foreign parent is the country where the immediate owner of the U.S. affiliate resides. This may or may not be the same as the location of the ultimate beneficial owner (UBO), which is the entity proceeding up the ownership chain in which no other entity has more than 50 percent direct voting interest. The UBO ultimately owns or controls the affiliate and derives the benefits, and assumes the risk, of ownership.
Thus, trade with the country of the foreign parent may not provide a full picture of a U.S. affiliate’s trade with members of its foreign parent group, which may include transactions with other foreign affiliates of its foreign parent or trade with its UBO in cases where the location of the UBO differs from the location of the foreign parent.
- Insurance services are considered unaffiliated even when they are traded between affiliated companies because the services are considered to be provided to the policyholders who pay the insurance premiums and who are unaffiliated with either company. The only insurance services considered to be affiliated are primary insurance transactions between a U.S. company that is not an insurance company and an affiliated foreign insurance company, such as a captive foreign insurance affiliate. Data on these affiliated insurance services are not separately available.