
The 2020 Annual Update of the National Income and Product Accounts
The Bureau of Economic Analysis (BEA) released its annual update of the National Income and Product Accounts (NIPAs) on July 30. For real gross domestic product (GDP) and most major components, the updates covered the most recent 5 years (2015–2019) and the first quarter of 2020; for selected estimates of income and saving, the update extended to previous years.1 The reference year for price and quantity estimates remains 2012.
As is usual for NIPA annual updates, the revised estimates reflect newly available source data that are more complete, more detailed, and otherwise more reliable than those that were previously incorporated.
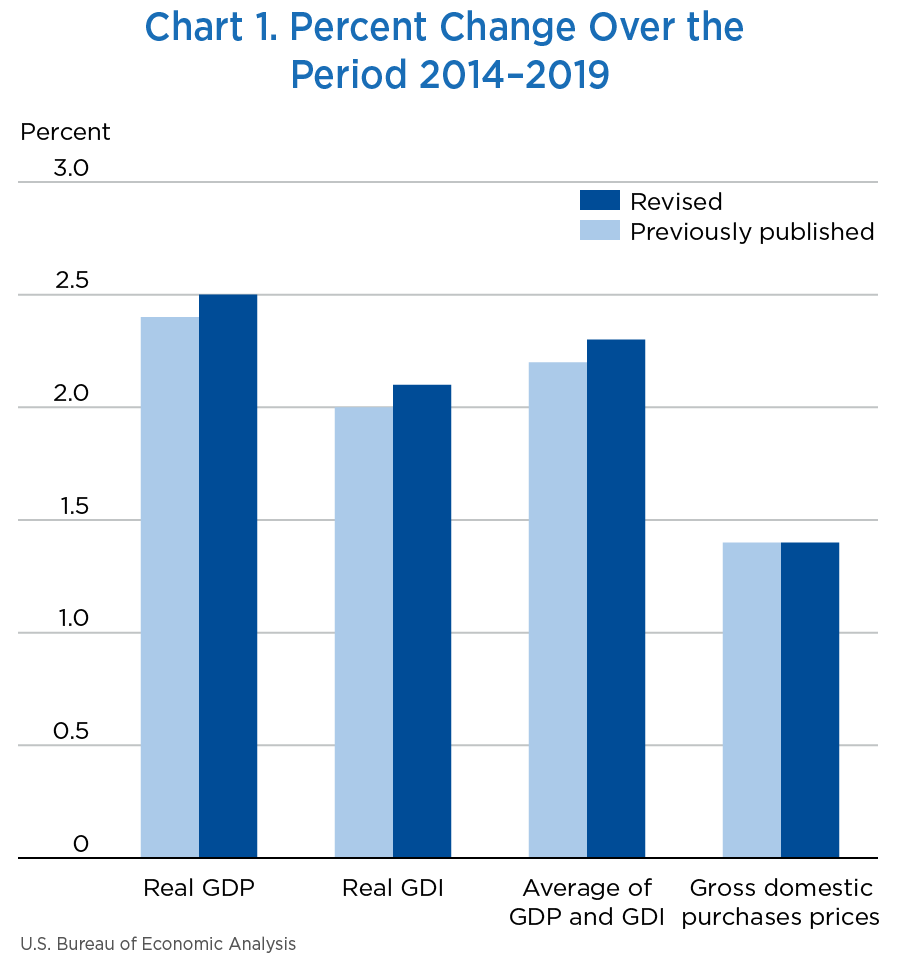
With this update, economic growth from 2014 to 2019 is revised up slightly, but the revised estimates are similar to the previously published estimates (chart 1):
[Click chart to expand]
- Real GDP—an inflation-adjusted measure of the value of the goods and services produced by the nation's economy less the value of the goods and services used up in production—increased at an average annual rate of 2.5 percent; in the previously published estimates, real GDP increased 2.4 percent.
- Real gross domestic income (GDI)—which measures the value of the production of goods and services in the United States as the incomes earned and the costs incurred in production—increased at an average annual rate of 2.1 percent; in the previously published estimates, real GDI increased at an average annual rate of 2.0 percent.
- The average of real GDP and real GDI increased at an average annual rate of 2.3 percent; in the previously published estimates, the measure increased at an average annual rate of 2.2 percent.
- The price index for gross domestic purchases increased at an average annual rate of 1.4 percent, unrevised from the previously published estimates.
- Contributors to real GDP growth for 2015–2019 are little changed from the earlier estimates. Consumer spending remains the driving force behind the growth in GDP in all years. Revised estimates show that the contribution of private investment was stronger in 2018 than previously shown, while the contribution of consumer spending was weaker. In 2019, the contribution of fixed investment was stronger than previously shown, while the contributions of inventory investment and consumer spending were weaker.
- For the period of expansion from the second quarter of 2009 through the fourth quarter of 2019, real GDP increased at an average annual rate of 2.3 percent, unrevised from the previously published estimate. The rate of growth in real GDI over this period was also unrevised at 2.4 percent.
- The personal saving rate (personal saving as a percentage of disposable personal income) was revised down 0.1 percentage point to 7.5 percent for 2015 and up 0.1 percentage point to 6.9 percent for 2016. It was revised up 0.2 percentage point for 2017 and for 2018 to 7.2 percent and 7.8 percent, respectively. The largest revision was for 2019; it was revised down from 7.9 percent to 7.5 percent.
The updated NIPA estimates reflect the incorporation of newly available and revised source data, the adoption of improved estimating methods, and for quarterly and monthly measures, the incorporation of updated seasonal factors.
Major source data
The major source data incorporated as part of this year's update are summarized in table 1, and additional information on the NIPA components affected by the incorporation of newly available and revised source data is provided in table 13.2
Source data that affected the NIPA components include the following:
- New Census Bureau Service Annual Survey (SAS) data for 2019 and revised data for 2015 through 2018, which replace Census Bureau Quarterly Services Report data for 2019 and previously incorporated SAS data for 2015 through 2018. SAS data most notably impacted estimates of consumer spending for services and private fixed investment in intellectual property products.
- Revised Internal Revenue Service (IRS) tabulations of corporate tax returns for 2017 and new IRS tabulations of tax returns data for 2018 for corporations, sole proprietorships, and partnerships, which affected estimates of corporate profits, proprietors' income, and net interest.
- Newly available Economic Census data for 2017, new Census Bureau Annual Survey of Manufactures (ASM) data for 2018, which replaced Census Bureau monthly industry shipments data, and revised monthly industry shipments data for 2015–2019, all of which impacted estimates of private investment in equipment and inventories.
- New Census Bureau Annual Retail Trade Survey (ARTS) data for 2018, which replaced Census Bureau monthly retail trade survey data, and revised ARTS data for 2015–2017, both of which impacted estimates of consumer spending for goods and private inventory investment.
- Revised Bureau of Labor Statistics (BLS) Quarterly Census of Employment and Wages (QCEW) data for 2015–2019, which impacted estimates of private and government compensation.
- Revised Department of Agriculture farm statistics for 2015–2019, which impacted estimates of farm output, inventory investment, and proprietors' income.
- Revised BEA International Transactions Accounts (ITAs) data for 1999–2019, which impacted estimates of exports and imports of goods and services and income flows with the rest of the world.
| Agency | Data | Years covered and vintage |
|---|---|---|
| Census Bureau | Annual Capital Expenditures Survey | 2017 (revised) 2018 (new) |
| Annual Wholesale Trade Survey | 2015–2017 (revised) 2018 (new) |
|
| Annual Retail Trade Survey | 2015–2017 (revised) 2018 (new) |
|
| Annual Survey of Manufactures | 2018 (new) | |
| Economic Census | 2017 (new) | |
| Monthly indicators of manufactures, merchant wholesale trade, and retail trade | 2015–2019 (revised) | |
| Service Annual Survey | 2015–2018 (revised) 2019 (new) |
|
| Annual Survey of State and Local Government Finances | Fiscal year 2015–2017 (revised) Fiscal year 2018 (new) |
|
| Monthly survey of construction spending (value put in place) | 2015–2019 (revised) | |
| Quarterly Services Survey | 2015–2019 (revised) | |
| American Community Survey | 2018 (new) | |
| Current Population Survey/Housing Vacancy Survey | 2015–2018 (revised) 2019 (new) |
|
| Office of Management and Budget | Federal budget | Fiscal years 2017–2020 |
| Internal Revenue Service | Tabulations of tax returns for corporations | 2017 (revised) 2018 (new) |
| Tabulations of tax returns for sole proprietorships and for partnerships | 2018 (new) | |
| Bureau of Labor Statistics | Quarterly Census of Employment and Wages | 2015–2019 (revised) |
| Occupational Employment Statistics program | 2019 (new) | |
| Department of Agriculture | Farm statistics | 2015–2019 (revised) |
| Bureau of Economic Analysis | International Transactions Accounts | 1999–2019 (revised) |
Methodology improvements
This year's update also reflects methodological changes to BEA's measures.
Services furnished without payment by financial intermediaries. Several changes have improved the accuracy of BEA's measures of services furnished without payment by financial intermediaries.
Beginning with 2015, measures of the imports of these “implicit” services are now included in the NIPAs; previously, only exports of these services were recorded. Additionally, the NIPA measures of both imports and exports of these services are now based directly on the corresponding measures from the ITAs.3 BEA previously derived the export measure in the NIPAs by allocating the total value of the implicit services to domestic sectors and to the rest of the world, based on Federal Reserve Board data on each sector's share of related assets and liabilities.4
BEA also updated its measures of the implicit services provided by commercial banks to include the services produced by international banking facilities (IBFs).5 Previously, BEA did not capture the implicit services produced by these facilities. The new measures are based on the Federal Deposit Insurance Corporation's (FDIC) Call Report data on the total assets and liabilities of IBFs. BEA derives a measure of the implicit services they export using FDIC microdata and then deducts the estimated exports from the total to derive the domestic consumption of these services. The result is added to the measure of total implicit financial services provided domestically by commercial banks to obtain a more comprehensive measure of the domestic share of these financial services.
BEA has simplified its allocation to sectors of the implicit financial services associated with depositor services by relying exclusively on Federal Reserve Board (FRB) data on by-sector shares of checkable deposits and currency and of time and savings deposits from the Financial Accounts of the United States. The FRB sectors align well with the Call Report categories underlying the NIPA estimates of these implicit services for commercial banks and savings institutions. Previously, the allocation used a complex combination of data from different sources that did not yield benefits in terms of accuracy and that included some discontinued data.
Additionally, the updated NIPA estimates more accurately measure the implicit services associated with depositors' and borrowers' services by using a reference rate for both resale agreements and repurchase agreements that is better aligned with the maturity structure of these agreements. Resale and repurchase agreements have a shorter maturity than conventional deposits and loans. The NIPAs now use a reference rate that is based on the quarterly average of the daily Secured Overnight Financing Rate published by the New York Federal Reserve Bank.6 Previously, the same reference rate was applied to all assets and liabilities.
Treasury inflation-protected securities. The accuracy and consistency of BEA measures of Treasury Inflation-Protected Securities (TIPS) are improved in the following two ways:7
First, the NIPAs record quarterly and annual federal government payments of interest on TIPS on an accrual basis; the measures are the sum of (1) accrued fixed-rate interest payments on the original principal and (2) accrued interest on the difference between the original principal and an inflation-adjusted measure of the principal. Beginning with 1999, the quarterly measures of TIPS interest are now derived by interpolating measures of annual interest accruals based on data from the Treasury Department's Bureau of Public Debt (BPD). Previously, BEA estimates of the interest payments were derived by aggregating the fixed-rate payments with monthly BPD measures of monthly interest accruals based on monthly Consumer Price Index (CPI)-based adjustments of the principal. The use of an annual accrual period for the BEA measures reduces the volatility of the series caused by the monthly inflation adjustments. Additionally, the annual accrual period more accurately reflects the fact that interest on these securities are paid to TIPS holders biannually, or when the securities mature, rather than monthly.
Second, beginning with 1999, the allocation of annual measures of the interest paid on TIPS to businesses, persons, and the rest of the world consistently includes an adjustment for inflation. Specifically, the gains and losses associated with the inflation adjustment that accrue to foreign holders of U.S. TIPS are now included in the NIPA measures of interest payments to the rest of the world. Previously, the inflation adjustment was allocated only to U.S. businesses and persons, while the allocation to the rest of the world was limited to the fixed-interest portion of TIPS payments. This improvement is consistent with a June 2020 change in the treatment of TIPS interest in BEA's ITAs.8
Consumer spending for video rentals. Beginning with 2019, quarterly measures of personal spending on “video streaming and rentals” are improved by using a 3-month moving average of HarrisX data as an indicator for the DVD rental portion of the measure. The HarrisX data are based on actual consumer costs of DVD rentals and the number of consumers that hold DVD rental subscriptions or that rent DVDs from physical outlets such as Redbox. Previously, the DVD portion of video streaming and rentals used the product of population and price as an indicator.
Updated seasonal factors. As with every annual update of the NIPAs, this year's update includes the incorporation of updated quarterly and monthly seasonal factors that capture changes in seasonal patterns that emerge over time. The updated seasonal factors reflect a mix of data that are seasonally adjusted by source agencies as well as data directly adjusted by BEA.
Presentational improvements
This year's annual update introduces additional detail for private fixed investment in research and development (R&D), a component of investment in intellectual property products. Starting with 2008, NIPA table group 5.6 (Private Fixed Investment in Intellectual Property Products) provides detail on R&D investment expenditures by software publishers, by financial and real estate services, by computer systems design and related services, and by other nonmanufacturing not elsewhere classified. Previously, this detail was included in the single category “all other nonmanufacturing.”
From 2014 to 2019, real GDP increased at an average annual rate of 2.5 percent, an upward revision of 0.1 percentage point from the prior estimate. Measures of current-dollar GDP were revised up for each year; it increased at an average annual rate of 4.1 percent (unrevised from previously published estimates).
Real GDP growth was revised up 0.2 percentage point for 2015, revised up 0.1 percentage point for 2016 and 2018, was unrevised for 2017, and revised down 0.1 percentage point for 2019 (table 2). The revisions to real GDP and its components primarily reflect revisions to current-dollar measures; price measures were not significantly revised.
- For 2015, upward revisions to personal consumption expenditures (PCE), nonresidential fixed investment, and inventory investment and a downward revision to imports (a subtraction in the calculation of GDP), were partly offset by a downward revision to state and local government spending.
- For 2016, a downward revision to imports and upward revisions to exports and PCE were partly offset by downward revisions to nonresidential fixed investment and inventory investment.
- For 2017, downward revisions to inventory investment, nonresidential fixed investment, and federal government spending were offset by upward revisions to state and local government spending, exports, PCE, and residential fixed investment.
- For 2018, upward revisions to inventory investment and to nonresidential fixed investment, a downward revision to imports, and upward revisions to residential fixed investment and state and local government spending were partly offset by a downward revision to PCE.
- For 2019, downward revisions to PCE, inventory investment, state and local government spending, and exports were partly offset by upward revisions to nonresidential fixed investment and federal government spending.
| Share of current-dollar GDP | Change from preceding period | Contribution to percent change in real GDP | |||||||||
|---|---|---|---|---|---|---|---|---|---|---|---|
| (Percent) | (Percentage points) | ||||||||||
| 2019 | 2015 | 2016 | 2017 | 2018 | 2019 | 2015 | 2016 | 2017 | 2018 | 2019 | |
| Gross domestic product1 | 100.0 | 3.1 | 1.7 | 2.3 | 3.0 | 2.2 | 3.1 | 1.7 | 2.3 | 3.0 | 2.2 |
| Personal consumption expenditures | 67.9 | 3.8 | 2.8 | 2.6 | 2.7 | 2.4 | 2.6 | 1.9 | 1.8 | 1.9 | 1.6 |
| Goods | 21.1 | 4.8 | 3.6 | 4.0 | 4.1 | 3.7 | 1.0 | 0.8 | 0.9 | 0.9 | 0.8 |
| Durable goods | 7.2 | 7.6 | 5.8 | 6.9 | 6.8 | 4.8 | 0.5 | 0.4 | 0.5 | 0.5 | 0.3 |
| Nondurable goods | 13.9 | 3.4 | 2.5 | 2.6 | 2.7 | 3.1 | 0.5 | 0.4 | 0.4 | 0.4 | 0.4 |
| Services | 46.8 | 3.3 | 2.4 | 2.0 | 2.1 | 1.8 | 1.5 | 1.1 | 0.9 | 1.0 | 0.9 |
| Gross private domestic investment | 17.5 | 5.5 | −1.5 | 3.5 | 6.3 | 1.7 | 1.0 | −0.3 | 0.6 | 1.1 | 0.3 |
| Fixed investment | 17.3 | 3.8 | 1.8 | 3.8 | 5.2 | 1.9 | 0.7 | 0.3 | 0.6 | 0.9 | 0.3 |
| Nonresidential | 13.5 | 2.3 | 0.5 | 3.7 | 6.9 | 2.9 | 0.3 | 0.1 | 0.5 | 0.9 | 0.4 |
| Structures | 3.0 | −0.9 | −4.4 | 4.2 | 3.7 | −0.6 | 0.0 | −0.1 | 0.1 | 0.1 | 0.0 |
| Equipment | 5.8 | 3.0 | −1.7 | 3.2 | 8.0 | 2.1 | 0.2 | −0.1 | 0.2 | 0.5 | 0.1 |
| Intellectual property products | 4.7 | 3.8 | 7.6 | 4.2 | 7.8 | 6.4 | 0.2 | 0.3 | 0.2 | 0.3 | 0.3 |
| Residential | 3.8 | 10.2 | 6.6 | 4.0 | −0.6 | −1.7 | 0.3 | 0.2 | 0.2 | 0.0 | −0.1 |
| Change in private inventories | 0.2 | --- | --- | --- | --- | --- | 0.3 | −0.6 | 0.0 | 0.2 | 0.0 |
| Net exports of goods and services | −2.8 | --- | --- | --- | --- | --- | −0.8 | −0.2 | −0.2 | −0.3 | −0.2 |
| Exports | 11.7 | 0.4 | 0.3 | 3.9 | 3.0 | −0.1 | 0.1 | 0.0 | 0.5 | 0.4 | 0.0 |
| Goods | 7.6 | −0.4 | 0.5 | 4.1 | 4.2 | −0.1 | 0.0 | 0.0 | 0.3 | 0.3 | 0.0 |
| Services | 4.1 | 2.0 | −0.2 | 3.7 | 0.8 | −0.1 | 0.1 | 0.0 | 0.2 | 0.0 | 0.0 |
| Imports | 14.6 | 5.2 | 1.7 | 4.7 | 4.1 | 1.1 | −0.8 | −0.3 | −0.7 | −0.6 | −0.2 |
| Goods | 11.8 | 5.7 | 1.4 | 4.7 | 5.0 | 0.5 | −0.7 | −0.2 | −0.6 | −0.6 | −0.1 |
| Services | 2.8 | 3.0 | 2.9 | 4.5 | 0.4 | 3.7 | −0.1 | −0.1 | −0.1 | 0.0 | −0.1 |
| Government consumption expenditures and gross investment | 17.5 | 1.8 | 1.8 | 0.9 | 1.8 | 2.3 | 0.3 | 0.3 | 0.2 | 0.3 | 0.4 |
| Federal | 6.6 | 0.0 | 0.6 | 0.3 | 2.8 | 4.0 | 0.0 | 0.0 | 0.0 | 0.2 | 0.3 |
| National defense | 4.0 | −2.1 | −0.5 | 0.8 | 3.3 | 5.6 | −0.1 | 0.0 | 0.0 | 0.1 | 0.2 |
| Nondefense | 2.6 | 3.3 | 2.2 | −0.5 | 2.1 | 1.8 | 0.1 | 0.1 | 0.0 | 0.1 | 0.1 |
| State and local | 10.9 | 2.9 | 2.6 | 1.2 | 1.2 | 1.3 | 0.3 | 0.3 | 0.1 | 0.1 | 0.1 |
| Revisions (percentage points) | |||||||||||
| Gross domestic product | ... | 0.2 | 0.1 | −0.1 | 0.1 | −0.1 | 0.2 | 0.1 | −0.1 | 0.1 | −0.1 |
| Personal consumption expenditures | ... | 0.1 | 0.1 | 0.0 | −0.3 | −0.2 | 0.1 | 0.0 | 0.0 | −0.2 | −0.1 |
| Gross private domestic investment | ... | 0.6 | −0.2 | −0.9 | 1.2 | −0.1 | 0.1 | 0.0 | −0.2 | 0.2 | 0.0 |
| Fixed investment | ... | 0.4 | −0.1 | −0.4 | 0.6 | 0.6 | 0.1 | 0.0 | −0.1 | 0.1 | 0.1 |
| Nonresidential | ... | 0.5 | −0.2 | −0.7 | 0.5 | 0.8 | 0.1 | 0.0 | −0.1 | 0.1 | 0.1 |
| Residential | ... | 0.0 | 0.1 | 0.5 | 0.9 | −0.2 | 0.0 | 0.0 | 0.0 | 0.0 | 0.0 |
| Change in private inventories | ... | --- | --- | --- | --- | --- | 0.0 | 0.0 | −0.1 | 0.1 | −0.1 |
| Net exports of goods and services | ... | --- | --- | --- | --- | --- | 0.0 | 0.1 | 0.1 | 0.0 | 0.0 |
| Exports | ... | −0.1 | 0.3 | 0.4 | 0.0 | −0.1 | 0.0 | 0.0 | 0.1 | 0.0 | 0.0 |
| Imports | ... | −0.1 | −0.3 | 0.0 | −0.3 | 0.1 | 0.0 | 0.1 | 0.0 | 0.0 | 0.0 |
| Government consumption expenditures and gross investment | ... | −0.1 | 0.0 | 0.2 | 0.1 | 0.0 | 0.0 | 0.0 | 0.0 | 0.0 | 0.0 |
| Federal | ... | 0.1 | 0.2 | −0.5 | −0.1 | 0.5 | 0.0 | 0.0 | 0.0 | 0.0 | 0.0 |
| State and local | ... | −0.3 | 0.0 | 0.6 | 0.2 | −0.3 | 0.0 | 0.0 | 0.1 | 0.0 | 0.0 |
- The estimates under the contribution columns are also percent changes.
Note. Percent changes are from NIPA table 1.1.1, contributions are from NIPA table 1.1.2, and shares are from NIPA table 1.1.10.
The revisions did not reverse the direction of change in real GDP for any quarter of the revision period (chart 2), and the quarterly pattern for real GDP changed for only 4 of the 21 quarters in the revision period, as highlighted in chart 2. The largest upward revision was 1.3 percentage points for the first quarter of 2018, and the largest downward revision was −0.8 percentage point for the second and third quarters of 2018.

[Click chart to expand]
The updated estimates of PCE primarily reflect the incorporation of source data, including newly available and revised Census Bureau SAS data and ARTS data, newly available and revised FRB Financial Accounts of the United States data, and newly available and revised IRS tabulations of corporate and sole proprietors and partnerships tax return data.
The change in real PCE was revised up 0.1 percentage point for 2015 and 2016, was unrevised for 2017, was revised down 0.3 percentage point for 2018, and was revised down 0.2 percentage point for 2019 (table 3).
- For 2015 and 2016, the revisions were primarily due to upward revisions to services.
- For 2018, the revision was due to downward revisions in services, including health care, food services and accommodations, financial services and insurance, and services provided by nonprofit institutions serving households.
- For 2019, the revision was primarily due to downward revisions in services, including health care, food services and accommodations, recreation services, and services provided by nonprofit institutions serving households.
| Share of current-dollar PCE | Change from preceding period | Contribution to percent change in real PCE | |||||||||
|---|---|---|---|---|---|---|---|---|---|---|---|
| (Percent) | (Percentage points) | ||||||||||
| 2019 | 2015 | 2016 | 2017 | 2018 | 2019 | 2015 | 2016 | 2017 | 2018 | 2019 | |
| Personal consumption expenditures1 | 100.0 | 3.8 | 2.8 | 2.6 | 2.7 | 2.4 | 3.8 | 2.8 | 2.6 | 2.7 | 2.4 |
| Goods | 31.0 | 4.8 | 3.6 | 4.0 | 4.1 | 3.7 | 1.5 | 1.1 | 1.3 | 1.3 | 1.2 |
| Durable goods | 10.5 | 7.6 | 5.8 | 6.9 | 6.8 | 4.8 | 0.8 | 0.6 | 0.7 | 0.7 | 0.5 |
| Motor vehicles and parts | 3.6 | 7.6 | 3.3 | 5.0 | 4.3 | −0.5 | 0.3 | 0.1 | 0.2 | 0.2 | 0.0 |
| Furnishings and durable household equipment | 2.5 | 9.2 | 8.0 | 8.0 | 6.9 | 3.4 | 0.2 | 0.2 | 0.2 | 0.2 | 0.1 |
| Recreational goods and vehicles | 3.0 | 6.2 | 9.8 | 10.8 | 10.8 | 13.2 | 0.2 | 0.3 | 0.3 | 0.3 | 0.4 |
| Other durable goods | 1.5 | 7.8 | 2.0 | 3.4 | 5.7 | 5.1 | 0.1 | 0.0 | 0.1 | 0.1 | 0.1 |
| Nondurable goods | 20.5 | 3.4 | 2.5 | 2.6 | 2.7 | 3.1 | 0.7 | 0.5 | 0.5 | 0.6 | 0.6 |
| Food and beverages purchased for off-premises consumption | 7.1 | 1.5 | 3.1 | 3.4 | 2.4 | 1.7 | 0.1 | 0.2 | 0.2 | 0.2 | 0.1 |
| Clothing and footwear | 2.8 | 3.5 | 2.3 | 1.6 | 3.7 | 3.7 | 0.1 | 0.1 | 0.1 | 0.1 | 0.1 |
| Gasoline and other energy goods | 2.3 | 4.7 | 0.5 | −0.6 | −0.6 | −0.5 | 0.1 | 0.0 | 0.0 | 0.0 | 0.0 |
| Other nondurable goods | 8.3 | 4.6 | 2.7 | 3.2 | 3.6 | 5.3 | 0.4 | 0.2 | 0.3 | 0.3 | 0.4 |
| Services | 69.0 | 3.3 | 2.4 | 2.0 | 2.1 | 1.8 | 2.3 | 1.6 | 1.4 | 1.4 | 1.3 |
| Household consumption expenditures (for services) | 66.0 | 3.6 | 2.3 | 2.1 | 2.0 | 2.1 | 2.3 | 1.5 | 1.4 | 1.4 | 1.4 |
| Housing and utilities | 18.4 | 2.4 | 1.5 | 0.8 | 1.3 | 1.2 | 0.5 | 0.3 | 0.2 | 0.2 | 0.2 |
| Health care | 16.9 | 5.4 | 4.0 | 2.3 | 2.4 | 2.7 | 0.9 | 0.7 | 0.4 | 0.4 | 0.5 |
| Transportation services | 3.3 | 3.7 | 4.3 | 3.7 | 3.8 | 1.6 | 0.1 | 0.1 | 0.1 | 0.1 | 0.1 |
| Recreation services | 4.0 | 3.7 | 2.9 | 1.1 | 2.2 | 1.3 | 0.2 | 0.1 | 0.0 | 0.1 | 0.1 |
| Food services and accommodations | 6.9 | 4.3 | 2.2 | 2.5 | 2.8 | 1.2 | 0.3 | 0.2 | 0.2 | 0.2 | 0.1 |
| Financial services and insurance | 8.1 | 2.4 | −2.0 | 2.1 | 0.3 | 2.1 | 0.2 | −0.2 | 0.2 | 0.0 | 0.2 |
| Other services | 8.4 | 3.2 | 3.5 | 3.9 | 3.4 | 4.0 | 0.3 | 0.3 | 0.3 | 0.3 | 0.3 |
| Final consumption expenditures of NPISHs | 3.0 | −2.0 | 4.5 | 0.2 | 3.1 | −3.0 | −0.1 | 0.1 | 0.0 | 0.1 | −0.1 |
| Gross output of NPISHs | 11.4 | 2.5 | 3.9 | 1.4 | 2.4 | 1.3 | 0.3 | 0.4 | 0.2 | 0.3 | 0.2 |
| Less: Receipts from sales of goods and services by NPISHs | 8.4 | 4.3 | 3.7 | 1.8 | 2.1 | 3.0 | 0.4 | 0.3 | 0.2 | 0.2 | 0.3 |
| Revisions (percentage points) | |||||||||||
| Personal consumption expenditures | ... | 0.1 | 0.1 | 0.0 | −0.3 | −0.2 | 0.1 | 0.1 | 0.0 | −0.3 | −0.2 |
| Goods | ... | 0.1 | 0.0 | 0.1 | 0.0 | 0.0 | 0.0 | 0.0 | 0.0 | 0.0 | 0.0 |
| Durable goods | ... | 0.1 | −0.3 | 0.0 | 0.5 | 0.0 | 0.0 | 0.0 | 0.0 | 0.1 | 0.0 |
| Nondurable goods | ... | 0.0 | 0.1 | 0.1 | −0.3 | −0.1 | 0.0 | 0.0 | 0.0 | −0.1 | 0.0 |
| Services | ... | 0.1 | 0.1 | 0.0 | −0.4 | −0.3 | 0.1 | 0.0 | 0.0 | −0.3 | −0.2 |
- NPISHs
- Nonprofit institutions serving households
- The estimates under the contribution columns are also percent changes.
Note. Percent changes are from NIPA table 2.3.1, contributions are from NIPA table 2.3.2, and shares are calculated from NIPA table 2.3.5.
The largest upward revision to the quarterly estimates was to the first quarter of 2017; the largest downward revision was to the second quarter of 2019. The quarterly pattern of real PCE is changed for 6 of the 21 quarters of the revision period, as highlighted in chart 3.

[Click chart to expand]
Revisions to private fixed investment primarily reflect the incorporation of source data, including revised Census Bureau construction spending (value put in place) data, newly available ASM data, new Economic Census data, and newly available and revised SAS data.
The change in real private fixed investment was revised up 0.4 percentage point for 2015, was revised down 0.1 percentage point for 2016, was revised down 0.4 percentage point for 2017, and was revised up 0.6 percentage point for both 2018 and 2019 (table 4).
- For 2015, the revision was primarily due to an upward revision to nonresidential structures, particularly power and communication structures.
- For 2016, the revision was primarily due to downward revisions to equipment and intellectual property products that were partly offset by an upward revision to nonresidential structures.
- For 2017, the revision was primarily due to a downward revision to equipment that was partly offset by upward revisions to intellectual property products and to residential structures.
- For 2018, the revision was due to upward revisions to equipment, particularly to “other” equipment and industrial equipment, to residential structures, and to intellectual property products.
- For 2019, the revision was due to upward revisions to nonresidential structures, particularly to mining exploration, shafts, and wells and power and communication structures, and to equipment. These upward revisions were partly offset by downward revisions to intellectual property products, particularly software, and to residential structures.
| Share of current-dollar PFI | Change from preceding period | Contribution to percent change in real PFI | |||||||||
|---|---|---|---|---|---|---|---|---|---|---|---|
| (Percent) | (Percentage points) | ||||||||||
| 2019 | 2015 | 2016 | 2017 | 2018 | 2019 | 2015 | 2016 | 2017 | 2018 | 2019 | |
| Private fixed investment1 | 100.0 | 3.8 | 1.8 | 3.8 | 5.2 | 1.9 | 3.8 | 1.8 | 3.8 | 5.2 | 1.9 |
| Nonresidential | 78.2 | 2.3 | 0.5 | 3.7 | 6.9 | 2.9 | 1.9 | 0.4 | 2.9 | 5.3 | 2.2 |
| Structures | 17.6 | −0.9 | −4.4 | 4.2 | 3.7 | −0.6 | −0.2 | −0.8 | 0.7 | 0.7 | −0.1 |
| Commercial and health care | 5.3 | 12.1 | 16.7 | 3.2 | 1.3 | −2.3 | 0.5 | 0.8 | 0.2 | 0.1 | −0.1 |
| Manufacturing | 2.1 | 34.4 | −4.9 | −13.4 | −1.8 | 4.6 | 0.7 | −0.1 | −0.3 | 0.0 | 0.1 |
| Power and communication | 3.5 | 3.4 | 2.2 | −4.6 | −5.7 | 3.5 | 0.1 | 0.1 | −0.2 | −0.2 | 0.1 |
| Mining exploration, shafts, and wells | 3.3 | −28.6 | −42.1 | 38.8 | 25.2 | −2.1 | −1.8 | −1.8 | 0.9 | 0.8 | −0.1 |
| Other structures | 3.4 | 10.5 | 7.2 | 3.8 | 1.3 | −3.4 | 0.3 | 0.2 | 0.1 | 0.1 | −0.1 |
| Equipment | 33.5 | 3.0 | −1.7 | 3.2 | 8.0 | 2.1 | 1.1 | −0.6 | 1.1 | 2.7 | 0.7 |
| Information processing equipment | 10.7 | 6.2 | 4.5 | 7.4 | 8.6 | 3.0 | 0.7 | 0.5 | 0.8 | 0.9 | 0.3 |
| Computers and peripheral equipment | 3.3 | 0.4 | −0.7 | 7.7 | 12.2 | 5.5 | 0.0 | 0.0 | 0.2 | 0.4 | 0.2 |
| Other | 7.4 | 8.7 | 6.6 | 7.3 | 7.2 | 2.0 | 0.7 | 0.5 | 0.6 | 0.6 | 0.2 |
| Industrial equipment | 7.0 | 0.1 | −1.4 | 5.5 | 8.2 | 2.1 | 0.0 | −0.1 | 0.4 | 0.6 | 0.2 |
| Transportation equipment | 8.4 | 10.5 | −5.8 | −1.6 | 5.8 | −0.4 | 1.0 | −0.6 | −0.1 | 0.5 | 0.0 |
| Other equipment | 7.4 | −6.6 | −5.6 | 0.6 | 9.6 | 3.5 | −0.6 | −0.4 | 0.0 | 0.7 | 0.3 |
| Intellectual property products | 27.1 | 3.8 | 7.6 | 4.2 | 7.8 | 6.4 | 0.9 | 1.9 | 1.1 | 2.0 | 1.7 |
| Software | 11.1 | 4.9 | 8.0 | 8.3 | 11.2 | 7.9 | 0.5 | 0.8 | 0.9 | 1.2 | 0.8 |
| Research and development | 13.6 | 2.9 | 8.3 | 1.4 | 6.0 | 5.9 | 0.4 | 1.0 | 0.2 | 0.8 | 0.8 |
| Entertainment, literary, and artistic originals | 2.5 | 3.8 | 2.8 | 2.2 | 3.2 | 2.3 | 0.1 | 0.1 | 0.1 | 0.1 | 0.1 |
| Residential | 21.8 | 10.2 | 6.6 | 4.0 | −0.6 | −1.7 | 1.9 | 1.4 | 0.9 | −0.1 | −0.4 |
| Structures | 21.4 | 10.2 | 6.6 | 3.9 | −0.6 | −1.8 | 1.9 | 1.3 | 0.9 | −0.1 | −0.4 |
| Permanent site | 9.4 | 11.8 | 6.5 | 4.4 | 1.8 | −4.8 | 1.0 | 0.6 | 0.4 | 0.2 | −0.5 |
| Single family | 7.6 | 11.4 | 5.2 | 6.7 | 2.8 | −6.3 | 0.8 | 0.4 | 0.5 | 0.2 | −0.5 |
| Multifamily | 1.8 | 13.4 | 12.2 | −4.7 | −2.1 | 1.8 | 0.2 | 0.2 | −0.1 | 0.0 | 0.0 |
| Other structures | 12.1 | 9.0 | 6.6 | 3.6 | −2.6 | 0.8 | 1.0 | 0.8 | 0.4 | −0.3 | 0.1 |
| Equipment | 0.4 | 8.7 | 8.6 | 7.0 | 1.2 | 1.2 | 0.0 | 0.0 | 0.0 | 0.0 | 0.0 |
| Revisions (percentage points) | |||||||||||
| Private fixed investment | ... | 0.4 | −0.1 | −0.4 | 0.6 | 0.6 | 0.4 | −0.1 | −0.4 | 0.6 | 0.6 |
| Nonresidential | ... | 0.5 | −0.2 | −0.7 | 0.5 | 0.8 | 0.4 | −0.2 | −0.5 | 0.4 | 0.6 |
| Structures | ... | 2.1 | 0.6 | −0.5 | −0.4 | 3.7 | 0.4 | 0.1 | −0.1 | −0.1 | 0.7 |
| Equipment | ... | −0.2 | −0.4 | −1.5 | 1.2 | 0.8 | −0.1 | −0.2 | −0.6 | 0.4 | 0.3 |
| Intellectual property products | ... | 0.2 | −0.3 | 0.5 | 0.4 | −1.1 | 0.1 | −0.1 | 0.2 | 0.1 | −0.3 |
| Residential | ... | 0.0 | 0.1 | 0.5 | 0.9 | −0.2 | 0.0 | 0.0 | 0.1 | 0.2 | −0.1 |
| Structures | ... | 0.0 | 0.2 | 0.5 | 0.9 | −0.3 | 0.0 | 0.0 | 0.1 | 0.2 | −0.1 |
| Equipment | ... | 0.2 | 0.0 | −0.2 | 0.4 | 0.7 | 0.0 | 0.0 | 0.0 | 0.0 | 0.0 |
- The estimates under the contribution columns are also percent changes.
Note. Percent changes are from NIPA table 5.3.1, contributions are from NIPA table 5.3.2, and shares are calculated from NIPA table 5.3.5.
The quarterly pattern of real private fixed investment was changed in 4 of the 21 quarters of the revision period, as highlighted in chart 4. The largest upward revision was for the third quarter of 2019, and the largest downward revisions were for the second quarter of 2016 and the second quarter of 2017.

[Click chart to expand]
Revisions to inventory investment primarily reflect Census Bureau data on inventory book values from a number of surveys, including newly available data from the Census Bureau's Economic Census and from its ASM, ARTS, and Annual Wholesale Trade Survey, and from revised monthly inventory data. Revisions also reflect newly available and revised IRS Statistics of Income data and revised data from the Department of Agriculture for farm inventories.
Change in real private inventories, or real inventory investment, was revised up $5.1 billion for 2015, revised up $1.6 billion for 2016, revised down $15.9 billion for 2017, revised up $5.3 billion for 2018, and revised down $18.4 billion for 2019 (table 5; additionally, chart 5 shows quarterly changes).
- For 2015, there were upward revisions to wholesale trade, to retail trade, and to mining, utilities, and construction.
- For 2016, an upward revision to wholesale trade was partly offset by a downward revision to retail trade and smaller downward revisions to manufacturing, to farm, and to mining, utilities, and construction.
- For 2017, the revision was primarily due to a downward revision to manufacturing; other downward revisions were spread across industries.
- For 2018, upward revisions to wholesale trade, to manufacturing, and to retail trade were partly offset by downward revisions to mining, utilities, construction, and to “other” industries.
- For 2019, downward revisions to wholesale trade, to manufacturing, to farm, and to “other” industries were partly offset by upward revisions to retail trade and to mining, utilities, and construction.
| Level | Change from preceding period | |||||||||
|---|---|---|---|---|---|---|---|---|---|---|
| 2015 | 2016 | 2017 | 2018 | 2019 | 2015 | 2016 | 2017 | 2018 | 2019 | |
| Change in private inventories1 | 137.6 | 24.5 | 15.8 | 53.4 | 48.5 | 51.3 | −113.0 | −8.8 | 37.6 | −4.9 |
| Farm | 1.1 | −6.7 | −6.4 | −7.8 | −16.9 | 4.6 | −7.8 | 0.3 | −1.4 | −9.1 |
| Mining, utilities, and construction | 20.1 | 8.2 | −15.1 | −11.8 | 7.2 | 15.5 | −11.9 | −23.3 | 3.3 | 19.0 |
| Manufacturing | 38.4 | −0.9 | −0.5 | 9.3 | 20.7 | 19.9 | −39.3 | 0.4 | 9.8 | 11.4 |
| Durable-goods industries | 18.5 | −10.0 | 0.1 | 11.9 | 14.8 | 2.8 | −28.4 | 10.1 | 11.8 | 2.9 |
| Nondurable-goods industries | 20.3 | 10.5 | −0.7 | −3.3 | 5.5 | 17.8 | −9.8 | −11.2 | −2.6 | 8.8 |
| Wholesale trade | 39.3 | 7.0 | 20.3 | 33.6 | 15.0 | −0.6 | −32.2 | 13.2 | 13.3 | −18.6 |
| Durable-goods industries | 9.6 | 0.5 | 13.7 | 31.2 | 5.0 | −16.3 | −9.1 | 13.2 | 17.5 | −26.3 |
| Nondurable-goods industries | 30.4 | 6.8 | 6.5 | 2.0 | 10.1 | 16.6 | −23.6 | −0.3 | −4.5 | 8.1 |
| Retail trade | 29.7 | 23.8 | 13.4 | 25.9 | 14.4 | 14.2 | −5.9 | −10.5 | 12.6 | −11.5 |
| Motor vehicle and parts dealers | 10.0 | 17.6 | 12.6 | 20.3 | 9.8 | 0.3 | 7.6 | −5.0 | 7.8 | −10.5 |
| Food and beverage stores | 2.0 | 1.6 | 1.5 | 1.3 | 0.9 | 1.2 | −0.5 | −0.1 | −0.2 | −0.4 |
| General merchandise stores | 2.8 | −1.0 | −3.3 | 1.8 | −1.4 | 3.9 | −3.8 | −2.3 | 5.1 | −3.2 |
| Other retail stores | 15.0 | 5.9 | 2.9 | 3.2 | 5.5 | 8.7 | −9.1 | −3.0 | 0.2 | 2.3 |
| Other industries | 9.4 | −8.4 | 1.8 | 1.5 | 5.2 | −2.1 | −17.8 | 10.1 | −0.3 | 3.7 |
| Residual2 | −1.7 | −0.6 | 2.3 | 3.1 | 2.9 | −1.7 | 1.1 | 2.8 | 0.8 | −0.1 |
| Revisions | ||||||||||
| Change in private inventories | 5.1 | 1.6 | −15.9 | 5.3 | −18.4 | 5.1 | −3.6 | −17.4 | 21.1 | −23.7 |
| Farm | −0.1 | −0.1 | −1.7 | 1.2 | −5.8 | −0.1 | −0.1 | −1.5 | 2.8 | −7.0 |
| Mining, utilities, and construction | 1.1 | −0.1 | 0.0 | −10.0 | 1.8 | 1.1 | −1.2 | 0.1 | −10.0 | 11.8 |
| Manufacturing | 0.0 | −0.2 | −10.8 | 7.4 | −7.9 | 0.0 | −0.2 | −10.5 | 18.1 | −15.2 |
| Wholesale trade | 2.1 | 3.4 | −3.3 | 7.4 | −10.1 | 2.1 | 1.3 | −6.7 | 10.7 | −17.5 |
| Retail trade | 2.0 | −1.3 | −0.1 | 3.5 | 3.5 | 2.0 | −3.3 | 1.3 | 3.6 | 0.0 |
| Other industries | 0.0 | 0.0 | −0.5 | −3.9 | −0.8 | 0.0 | 0.0 | −0.5 | −3.4 | 3.1 |
- The levels are from NIPA table 5.7.6B.
- The residual is the difference between the first line and the sum of the most detailed lines.
Note. The chained-dollar series are calculated as the period-to-period change in end-of-period inventories. Because the formula for the chain-type quantity indexes uses weights of more than one period, chained-dollar estimates are usually not additive.

[Click chart to expand]
The revisions to the real measures of exports are due to the incorporation of revised data from the ITAs; revisions to exports prices are small. As with the NIPAs, the ITAs are updated each year; the most recent update was released in June 2020 (see “Discontinuities in the Estimates of Foreign Transactions in the National Income and Product Accounts”).9
The percent change in real exports was revised up 0.3 percentage point for 2016 and 0.4 percentage point for 2017 (table 6). For 2015 and 2019, revisions to the percent change in real exports were small and downward (−0.1 percentage point); the measure for 2018 was unrevised.
- For 2015, the revision was due to a downward revision to exports of services.
- For 2016 and 2017, the revisions were primarily due to upward revisions to services, particularly other business services and charges for the use of intellectual property not elsewhere classified (n.e.c.). For 2017, the revision was also due to an upward revision to petroleum and products and was partly offset by a downward revision to travel services.
- For 2018, upward revisions to services were offset by downward revisions to goods.
- For 2019, the revision was due to a downward revision to goods that was partly offset by an upward revision to services.
| Share of current-dollar exports | Change from preceding period | Contribution to percent change in real exports | |||||||||
|---|---|---|---|---|---|---|---|---|---|---|---|
| (Percent) | (Percentage points) | ||||||||||
| 2019 | 2015 | 2016 | 2017 | 2018 | 2019 | 2015 | 2016 | 2017 | 2018 | 2019 | |
| Exports of goods and services1 | 100.0 | 0.4 | 0.3 | 3.9 | 3.0 | −0.1 | 0.4 | 0.3 | 3.9 | 3.0 | −0.1 |
| Exports of goods | 65.1 | −0.4 | 0.5 | 4.1 | 4.2 | −0.1 | −0.2 | 0.4 | 2.6 | 2.7 | −0.1 |
| Foods, feeds, and beverages | 5.2 | 1.9 | 5.8 | 0.4 | −0.1 | −1.3 | 0.1 | 0.3 | 0.0 | 0.0 | −0.1 |
| Industrial supplies and materials | 21.0 | 0.0 | 1.8 | 8.7 | 6.7 | 3.5 | 0.0 | 0.3 | 1.6 | 1.3 | 0.7 |
| Capital goods, except automotive | 21.8 | −1.3 | −2.1 | 2.5 | 4.6 | −3.2 | −0.3 | −0.5 | 0.6 | 1.0 | −0.7 |
| Automotive vehicles, engines, and parts | 6.5 | −4.9 | −0.2 | 4.7 | −0.2 | 1.9 | −0.3 | 0.0 | 0.3 | 0.0 | 0.1 |
| Consumer goods, except food and automotive | 8.2 | 1.6 | 0.2 | 3.4 | 3.2 | −0.6 | 0.1 | 0.0 | 0.3 | 0.3 | −0.1 |
| Other | 2.5 | 6.0 | 7.7 | −4.8 | 4.5 | −3.2 | 0.2 | 0.2 | −0.1 | 0.1 | −0.1 |
| Exports of services | 34.9 | 2.0 | −0.2 | 3.7 | 0.8 | −0.1 | 0.7 | −0.1 | 1.3 | 0.3 | −0.1 |
| Transport | 3.6 | −1.4 | −0.1 | 3.8 | 6.7 | −2.3 | −0.1 | 0.0 | 0.1 | 0.2 | −0.1 |
| Travel (for all purposes including education) | 7.7 | 1.1 | −0.7 | −1.4 | −0.9 | −3.4 | 0.1 | −0.1 | −0.1 | −0.1 | −0.3 |
| Charges for the use of intellectual property n.e.c. | 4.7 | −14.6 | 0.9 | 2.6 | −1.7 | −2.8 | −0.8 | 0.0 | 0.1 | −0.1 | −0.1 |
| Other business services | 17.2 | 10.7 | 0.6 | 6.8 | 0.6 | 2.7 | 1.5 | 0.1 | 1.1 | 0.1 | 0.5 |
| Government goods and services n.e.c. | 0.9 | 2.9 | −6.6 | 5.1 | 7.6 | 1.2 | 0.0 | −0.1 | 0.0 | 0.1 | 0.0 |
| Other | 0.9 | −4.0 | −9.7 | −1.6 | 1.3 | −3.1 | 0.0 | −0.1 | 0.0 | 0.0 | 0.0 |
| Revisions (percentage points) | |||||||||||
| Exports of goods and services | ... | −0.1 | 0.3 | 0.4 | 0.0 | −0.1 | −0.1 | 0.3 | 0.4 | 0.0 | −0.1 |
| Exports of goods | ... | 0.0 | −0.1 | 0.2 | −0.1 | −0.3 | 0.0 | 0.0 | 0.1 | −0.1 | −0.2 |
| Exports of services | ... | −0.2 | 0.9 | 1.0 | 0.1 | 0.3 | 0.0 | 0.3 | 0.3 | 0.0 | 0.1 |
- The estimates under the contribution columns are also percent changes.
Note. Percent changes are from NIPA table 4.2.1, contributions are from NIPA table 4.2.2, and shares are calculated from NIPA table 4.2.5.
The quarterly pattern of real exports is changed for 2 of the 21 quarters in the revision period, as highlighted in chart 6. The largest upward revision was to the first quarter of 2017; the largest downward revision was to the second quarter of 2018.

[Click chart to expand]
As with exports, the revisions to imports primarily reflect updated data from the ITAs. The percent change in real imports was revised down 0.1 percentage point for 2015, revised down 0.3 percentage point for 2016 and 2018, and revised up 0.1 percentage point for 2019; it was unrevised for 2017 (table 7).
- For 2015, the revision was due to downward revisions to imports of services, particularly travel services and intellectual property products, that were partly offset by an upward revision to other business services.
- For 2016, the revision was due to downward revisions to services, particularly transport services, and to goods.
- For 2018, the revision was due to downward revisions to imports of services, particularly “other” business services, and to goods.
- For 2019, the revision was primarily due to an upward revision to imports of goods, particularly consumer goods except food and automotive, capital goods except automotive, and petroleum and products, that was offset by a downward revision to imports of services, particularly charges for the use of intellectual property n.e.c.
| Share of current-dollar imports | Change from preceding period | Contribution to percent change in real imports | |||||||||
|---|---|---|---|---|---|---|---|---|---|---|---|
| (Percent) | (Percentage points) | ||||||||||
| 2019 | 2015 | 2016 | 2017 | 2018 | 2019 | 2015 | 2016 | 2017 | 2018 | 2019 | |
| Imports of goods and services1 | 100.0 | 5.2 | 1.7 | 4.7 | 4.1 | 1.1 | 5.2 | 1.7 | 4.7 | 4.1 | 1.1 |
| Imports of goods | 80.8 | 5.7 | 1.4 | 4.7 | 5.0 | 0.5 | 4.7 | 1.1 | 3.8 | 4.0 | 0.4 |
| Foods, feeds, and beverages | 4.8 | 4.0 | 1.4 | 2.3 | 7.8 | 2.7 | 0.2 | 0.1 | 0.1 | 0.4 | 0.1 |
| Industrial supplies and materials | 16.6 | 1.6 | 2.9 | 1.6 | 0.1 | −5.3 | 0.3 | 0.5 | 0.3 | 0.0 | −1.0 |
| Capital goods, except automotive | 21.8 | 4.3 | 1.0 | 9.4 | 8.2 | −0.6 | 0.9 | 0.2 | 2.0 | 1.8 | −0.1 |
| Automotive vehicles, engines, and parts | 12.1 | 8.4 | 1.0 | 2.8 | 3.7 | 1.9 | 1.0 | 0.1 | 0.4 | 0.4 | 0.2 |
| Consumer goods, except food and automotive | 21.0 | 9.3 | 0.2 | 4.5 | 7.7 | 3.3 | 1.9 | 0.0 | 1.0 | 1.6 | 0.7 |
| Other | 4.5 | 9.9 | 4.2 | 2.8 | −3.4 | 10.9 | 0.4 | 0.2 | 0.1 | −0.2 | 0.4 |
| Imports of services | 19.2 | 3.0 | 2.9 | 4.5 | 0.4 | 3.7 | 0.5 | 0.5 | 0.8 | 0.1 | 0.7 |
| Transport | 3.4 | 7.3 | −2.8 | 2.4 | 4.5 | 1.1 | 0.3 | −0.1 | 0.1 | 0.2 | 0.0 |
| Travel (for all purposes including education) | 4.3 | 1.1 | 8.6 | 6.8 | 5.1 | 6.4 | 0.0 | 0.3 | 0.3 | 0.2 | 0.3 |
| Charges for the use of intellectual property n.e.c. | 1.4 | −16.5 | 18.4 | 3.8 | −3.3 | −4.2 | −0.3 | 0.2 | 0.1 | −0.1 | −0.1 |
| Other business services | 8.7 | 7.3 | 1.8 | 4.7 | −3.1 | 5.0 | 0.6 | 0.2 | 0.4 | −0.3 | 0.4 |
| Government goods and services n.e.c. | 0.8 | −2.2 | −2.6 | −1.2 | −1.1 | 5.4 | 0.0 | 0.0 | 0.0 | 0.0 | 0.0 |
| Other | 0.6 | −11.2 | −10.8 | 7.3 | 10.7 | −0.3 | −0.1 | −0.1 | 0.0 | 0.1 | 0.0 |
| Revisions (percentage points) | |||||||||||
| Imports of goods and services | ... | −0.1 | −0.3 | 0.0 | −0.3 | 0.1 | −0.1 | −0.3 | 0.0 | −0.3 | 0.1 |
| Imports of goods | ... | 0.0 | −0.1 | −0.1 | 0.0 | 0.2 | 0.0 | −0.1 | −0.1 | 0.0 | 0.2 |
| Imports of services | ... | −0.5 | −1.5 | 0.1 | −1.2 | −0.5 | −0.1 | −0.3 | 0.0 | −0.2 | −0.1 |
- The estimates under the contribution columns are also percent changes.
Note. Percent changes are from NIPA table 4.2.1, contributions are from NIPA table 4.2.2, and shares are calculated from NIPA table 4.2.5.
The quarterly pattern of real imports was changed for 5 of the 21 quarters of the revision period, as highlighted in chart 7. The largest upward revision was to the second quarter of 2019; the largest downward revisions were to the first quarter of 2016 and the third quarter of 2019.

[Click chart to expand]
The revisions to the real estimates of state and local government spending primarily reflect revised and newly available source data from Census Bureau surveys of government finances, which are used to estimate most components of spending by state and local governments, revised BLS QCEW data for 2015–2018, and new QCEW data for 2019, which are used to prepare estimates of government compensation, and new Department of Health and Human Services Medical Expenditures Panel Survey data for 2018–2019.
Revisions to federal government spending primarily reflect revisions to revised allocations of Office of Management and Budget (OMB) data from the federal budget for fiscal year (FY) 2017 and FY 2018, revised FY 2019 OMB budget data for 2018 and 2019, and newly available preliminary OMB budget data for FY 2019. Prices were not significantly changed.
The percent change in real government spending was revised down 0.1 percentage point for 2015, was revised up 0.2 percentage point for 2017, and was revised up 0.1 percentage point for 2018; it was unrevised for 2016 and 2019 (table 8).
- For 2015, the revision was primarily due to a downward revision to state and local government consumption expenditures.
- For 2017 and 2018, the revisions were primarily due to upward revisions to state and local spending that were partly offset by downward revisions to federal government spending.
| Share of current-dollar CEGI | Change from preceding period | Contribution to percent change in real CEGI | |||||||||
|---|---|---|---|---|---|---|---|---|---|---|---|
| (Percent) | (Percentage points) | ||||||||||
| 2019 | 2015 | 2016 | 2017 | 2018 | 2019 | 2015 | 2016 | 2017 | 2018 | 2019 | |
| Government consumption expenditures and gross investment1 | 100.0 | 1.8 | 1.8 | 0.9 | 1.8 | 2.3 | 1.8 | 1.8 | 0.9 | 1.8 | 2.3 |
| Consumption expenditures | 79.9 | 1.6 | 1.8 | 0.6 | 1.5 | 1.8 | 1.3 | 1.4 | 0.5 | 1.3 | 1.4 |
| Gross investment | 20.1 | 2.8 | 2.1 | 2.2 | 2.9 | 4.4 | 0.5 | 0.4 | 0.4 | 0.6 | 0.9 |
| Federal | 37.9 | 0.0 | 0.6 | 0.3 | 2.8 | 4.0 | 0.0 | 0.2 | 0.1 | 1.1 | 1.5 |
| National defense | 22.7 | −2.1 | −0.5 | 0.8 | 3.3 | 5.6 | −0.5 | −0.1 | 0.2 | 0.7 | 1.2 |
| Consumption expenditures | 18.1 | −2.3 | 0.1 | 0.1 | 2.4 | 4.5 | −0.4 | 0.0 | 0.0 | 0.4 | 0.8 |
| Gross investment | 4.7 | −1.4 | −2.8 | 3.8 | 7.2 | 9.9 | −0.1 | −0.1 | 0.2 | 0.3 | 0.4 |
| Nondefense | 15.1 | 3.3 | 2.2 | −0.5 | 2.1 | 1.8 | 0.5 | 0.3 | −0.1 | 0.3 | 0.3 |
| Consumption expenditures | 11.2 | 3.0 | 1.4 | −1.2 | 2.6 | 1.1 | 0.3 | 0.2 | −0.1 | 0.3 | 0.1 |
| Gross investment | 3.9 | 4.0 | 4.3 | 1.9 | 0.8 | 3.9 | 0.2 | 0.2 | 0.1 | 0.0 | 0.2 |
| State and local | 62.1 | 2.9 | 2.6 | 1.2 | 1.2 | 1.3 | 1.8 | 1.6 | 0.8 | 0.8 | 0.8 |
| Consumption expenditures | 50.6 | 2.7 | 2.4 | 1.1 | 1.0 | 1.0 | 1.4 | 1.2 | 0.6 | 0.5 | 0.5 |
| Gross investment | 11.5 | 4.1 | 3.3 | 1.8 | 2.1 | 2.4 | 0.4 | 0.4 | 0.2 | 0.2 | 0.3 |
| Revisions (percentage points) | |||||||||||
| Government consumption expenditures and gross investment | --- | −0.1 | 0.0 | 0.2 | 0.1 | 0.0 | −0.1 | 0.0 | 0.2 | 0.1 | 0.0 |
| Federal | --- | 0.1 | 0.2 | −0.5 | −0.1 | 0.5 | 0.0 | 0.1 | −0.2 | 0.0 | 0.2 |
| National defense | --- | 0.0 | 0.1 | 0.1 | 0.0 | 0.7 | 0.0 | 0.0 | 0.0 | 0.0 | 0.2 |
| Nondefense | --- | 0.2 | 0.2 | −1.3 | −0.3 | 0.2 | 0.0 | 0.0 | −0.2 | −0.1 | 0.0 |
| State and local | --- | −0.3 | 0.0 | 0.6 | 0.2 | −0.3 | −0.2 | 0.0 | 0.4 | 0.2 | −0.2 |
- The estimates under the contribution columns are also percent changes.
Note. Percent changes are from NIPA table 3.9.1, contributions are from NIPA table 3.9.2, and shares are calculated from NIPA table 3.9.5.
The revised estimates changed the quarterly pattern of real government spending in 2 of the 21 quarters of the revision period, as highlighted in chart 8. The largest upward revisions were to the fourth quarter of 2017, the third quarter of 2018, and the third quarter of 2019; the largest downward revision was to the second quarter of 2015.

[Click chart to expand]
Revisions to BEA's various price measures—such as gross domestic purchases, GDP, and PCE—were small and reflect revised and newly available source data and the regular incorporation of annual weights for the most recent year (2019) (table 9). For the period 2014–2019, the average rate of increase in gross domestic purchases prices was 1.4 percent, the same as previously published.
- The percent change in the gross domestic purchases price index—a measure of the prices paid by consumers, businesses, and governments—was unrevised for 2015–2017, revised down by 0.1 percentage point for 2018, and revised up by 0.1 percentage point for 2019.
- The percent change in GDP prices was unrevised for all years.
- The percent change in PCE prices was unrevised for 2015–2018 and was revised up 0.1 percentage point for 2019.
- From the fourth quarter of 2014 to the first quarter of 2020, the average annual rate of increase in the price index for PCE was unrevised at 1.4 percent. The average annual rate of increase in the “core” PCE price index (which excludes food and energy) was revised up 0.1 percentage point to 1.7 percent.
| Change from preceding period | Contribution to percent change in prices | |||||||||
|---|---|---|---|---|---|---|---|---|---|---|
| (Percent) | (Percentage points) | |||||||||
| 2015 | 2016 | 2017 | 2018 | 2019 | 2015 | 2016 | 2017 | 2018 | 2019 | |
| Gross domestic purchases1 | 0.3 | 0.7 | 1.9 | 2.3 | 1.6 | 0.3 | 0.7 | 1.9 | 2.3 | 1.6 |
| Personal consumption expenditures | 0.2 | 1.0 | 1.8 | 2.1 | 1.5 | 0.1 | 0.7 | 1.2 | 1.4 | 1.0 |
| Goods | −3.1 | −1.6 | 0.3 | 0.7 | −0.5 | −0.7 | −0.4 | 0.1 | 0.1 | −0.1 |
| Durable goods | −2.2 | −2.4 | −2.3 | −1.7 | −1.2 | −0.2 | −0.2 | −0.2 | −0.1 | −0.1 |
| Nondurable goods | −3.5 | −1.3 | 1.6 | 1.9 | −0.1 | −0.5 | −0.2 | 0.2 | 0.3 | 0.0 |
| Services | 1.8 | 2.3 | 2.5 | 2.8 | 2.4 | 0.8 | 1.0 | 1.1 | 1.3 | 1.1 |
| Gross private domestic investment | 0.6 | 0.0 | 1.7 | 1.9 | 1.7 | 0.1 | 0.0 | 0.3 | 0.3 | 0.3 |
| Fixed investment | 0.9 | 0.1 | 1.7 | 1.9 | 1.7 | 0.1 | 0.0 | 0.3 | 0.3 | 0.3 |
| Nonresidential | 0.4 | −0.8 | 0.9 | 0.9 | 1.3 | 0.1 | −0.1 | 0.1 | 0.1 | 0.2 |
| Structures | 2.1 | 0.3 | 2.6 | 1.7 | 3.6 | 0.1 | 0.0 | 0.1 | 0.1 | 0.1 |
| Equipment | −0.5 | −1.1 | −0.1 | 0.1 | 0.2 | 0.0 | −0.1 | 0.0 | 0.0 | 0.0 |
| Intellectual property products | 0.6 | −1.1 | 0.8 | 1.3 | 1.3 | 0.0 | −0.1 | 0.0 | 0.1 | 0.1 |
| Residential | 2.7 | 3.5 | 4.5 | 5.6 | 2.8 | 0.1 | 0.1 | 0.2 | 0.2 | 0.1 |
| Change in private inventories | --- | --- | --- | --- | --- | 0.0 | 0.0 | 0.0 | 0.0 | 0.0 |
| Government consumption expenditures and gross investment | 0.2 | 0.3 | 2.4 | 3.6 | 1.9 | 0.0 | 0.1 | 0.4 | 0.6 | 0.3 |
| Federal | 0.5 | 0.6 | 2.1 | 3.1 | 1.9 | 0.0 | 0.0 | 0.1 | 0.2 | 0.1 |
| National defense | 0.3 | 0.4 | 1.7 | 2.9 | 1.7 | 0.0 | 0.0 | 0.1 | 0.1 | 0.1 |
| Nondefense | 0.8 | 0.9 | 2.6 | 3.3 | 2.1 | 0.0 | 0.0 | 0.1 | 0.1 | 0.1 |
| State and local | 0.0 | 0.2 | 2.5 | 4.0 | 1.9 | 0.0 | 0.0 | 0.3 | 0.4 | 0.2 |
| Addenda | ||||||||||
| Gross domestic purchases: | ||||||||||
| Food | 1.1 | −1.1 | −0.1 | 0.5 | 1.0 | 0.1 | −0.1 | 0.0 | 0.0 | 0.1 |
| Energy goods and services | −18.3 | −7.5 | 8.7 | 8.0 | −2.2 | −0.7 | −0.2 | 0.2 | 0.2 | −0.1 |
| Excluding food and energy | 1.0 | 1.1 | 1.8 | 2.3 | 1.7 | 0.9 | 1.0 | 1.7 | 2.1 | 1.6 |
| Personal consumption expenditures: | ||||||||||
| Food and beverages purchased for off-premises consumption | 1.1 | −1.0 | −0.1 | 0.5 | 1.0 | --- | --- | --- | --- | --- |
| Energy goods and services | −17.9 | −7.3 | 8.7 | 8.0 | −2.1 | --- | --- | --- | --- | --- |
| Excluding food and energy | 1.2 | 1.6 | 1.7 | 2.0 | 1.7 | --- | --- | --- | --- | --- |
| Gross domestic product (GDP) | 1.0 | 1.0 | 1.9 | 2.4 | 1.8 | --- | --- | --- | --- | --- |
| Exports of goods and services | −4.9 | −2.0 | 2.6 | 3.4 | −0.4 | --- | --- | --- | --- | --- |
| Imports of goods and services | −8.0 | −3.5 | 2.2 | 2.9 | −1.5 | --- | --- | --- | --- | --- |
| Revisions (percentage points) | ||||||||||
| Gross domestic purchases | 0.0 | 0.0 | 0.0 | −0.1 | 0.1 | −0.1 | 0.0 | 0.0 | 0.0 | 0.0 |
| Food | 0.0 | 0.0 | 0.0 | 0.0 | 0.0 | 0.0 | 0.0 | 0.0 | 0.0 | 0.0 |
| Energy goods and services | −0.1 | −0.1 | 0.0 | 0.1 | 0.1 | 0.0 | 0.0 | 0.0 | 0.0 | 0.0 |
| Excluding food and energy | 0.0 | 0.0 | 0.0 | 0.0 | 0.0 | 0.0 | 0.0 | 0.0 | 0.0 | 0.0 |
| PCE | 0.0 | 0.0 | 0.0 | 0.0 | 0.1 | --- | --- | --- | --- | --- |
| Food and beverages purchased for off-premises consumption | 0.0 | 0.0 | 0.0 | 0.0 | 0.0 | --- | --- | --- | --- | --- |
| Energy goods and services | 0.1 | 0.0 | 0.0 | 0.0 | 0.2 | --- | --- | --- | --- | --- |
| Excluding food and energy | 0.0 | 0.0 | 0.1 | 0.1 | 0.1 | --- | --- | --- | --- | --- |
| GDP | 0.0 | 0.0 | 0.0 | 0.0 | 0.0 | --- | --- | --- | --- | --- |
| Exports of goods and services | 0.0 | 0.0 | 0.0 | 0.0 | −0.2 | --- | --- | --- | --- | --- |
| Imports of goods and services | 0.1 | 0.1 | 0.0 | 0.0 | −0.1 | --- | --- | --- | --- | --- |
- The estimates under the contribution columns are also percent changes.
Note. Most percent changes are from NIPA table 1.6.7; percent changes for PCE for food and energy goods and services and for PCE excluding food and energy are from NIPA table 2.3.7. Contributions are from NIPA table 1.6.8. GDP, export, and import prices are from NIPA table 1.1.7.
The quarterly patterns of the price indexes for gross domestic purchases and for gross domestic purchases excluding food and energy are generally similar to the pattern reflected by the previously published estimates, as shown in chart 9.

[Click chart to expand]
Revisions to the components of national income reflect the incorporation of a variety of newly available and revised source data. For this annual update, major source data include IRS tabulations of tax return data for corporations, for sole proprietorships, and for partnerships, Census Bureau data on government finances, revised OMB federal budget data, FRB data from the Financial Accounts of the United States, revised BLS QCEW data, and revised data from BEA's ITAs.
For measures of income and saving, the annual update extends back to the first quarter of 1999 to incorporate revised measures from the ITAs of income flows between the United States and the rest of the world. Revisions to national income prior to 2015 were small; the revision for 2014 was 0.2 percent, and the largest revision prior to 2014 was .03 percent.
National income was revised down less than 0.1 percent for 2015; it was revised up 0.2 percent for 2016, up 0.9 percent for 2017, up 0.8 percent for 2018, and up 0.6 percent for 2019 (table 10).
- For 2015, the largest downward revisions were to business current transfer payments and taxes on production and imports. The largest offsetting upward revision was to compensation of employees.
- For 2016, upward revisions, particularly to net interest and miscellaneous payments and to corporate profits, were partly offset by downward revisions to business current transfer payments and the current surplus of government enterprises.
- For 2017, upward revisions to corporate profits, net interest and miscellaneous payments, compensation, business current transfer payments, and rental income of persons were partly offset by downward revisions to proprietors' income and the current surplus of government enterprises.
- For 2018, upward revisions to corporate profits, compensation, taxes and production and imports, business current transfer payments, and rental income of persons were partly offset by downward revisions to net interest and miscellaneous payments and proprietors' income.
- For 2019, upward revisions to corporate profits, rental income of persons, compensation, and the current surplus of government enterprises were partly offset by downward revisions to net interest and miscellaneous payments, business current transfer payments, and taxes on production and imports.
| Level | Change from preceding period | |||||||||
|---|---|---|---|---|---|---|---|---|---|---|
| 2015 | 2016 | 2017 | 2018 | 2019 | 2015 | 2016 | 2017 | 2018 | 2019 | |
| National income | 15,784.6 | 16,082.7 | 16,853.9 | 17,689.6 | 18,269.1 | 544.7 | 298.1 | 771.1 | 835.7 | 579.5 |
| Compensation of employees | 9,699.4 | 9,963.9 | 10,422.5 | 10,950.1 | 11,432.4 | 450.3 | 264.4 | 458.7 | 527.6 | 482.3 |
| Wages and salaries | 7,859.5 | 8,089.1 | 8,471.5 | 8,894.2 | 9,309.3 | 384.3 | 229.6 | 382.3 | 422.7 | 415.1 |
| Government | 1,275.8 | 1,308.2 | 1,347.7 | 1,402.5 | 1,450.8 | 38.9 | 32.4 | 39.5 | 54.8 | 48.3 |
| Other | 6,583.7 | 6,780.9 | 7,123.7 | 7,491.7 | 7,858.5 | 345.4 | 197.2 | 342.8 | 368.0 | 366.8 |
| Supplements to wages and salaries | 1,839.9 | 1,874.7 | 1,951.1 | 2,055.9 | 2,123.1 | 66.1 | 34.8 | 76.3 | 104.8 | 67.2 |
| Employer contributions for employee pension and insurance funds | 1,270.6 | 1,293.5 | 1,346.0 | 1,430.7 | 1,474.0 | 43.1 | 23.0 | 52.4 | 84.7 | 43.3 |
| Employer contributions for government social insurance | 569.4 | 581.2 | 605.1 | 625.2 | 649.1 | 22.9 | 11.8 | 23.9 | 20.1 | 23.9 |
| Proprietors' income with IVA and CCAdj | 1,423.0 | 1,424.8 | 1,509.0 | 1,585.9 | 1,657.7 | −24.8 | 1.8 | 84.2 | 77.0 | 71.7 |
| Farm | 56.2 | 36.0 | 41.5 | 43.0 | 49.7 | −13.6 | −20.2 | 5.5 | 1.5 | 6.6 |
| Nonfarm | 1,366.7 | 1,388.7 | 1,467.4 | 1,542.9 | 1,608.0 | −11.2 | 22.0 | 78.7 | 75.5 | 65.1 |
| Rental income of persons with CCAdj | 649.0 | 682.7 | 721.9 | 759.3 | 787.1 | 44.4 | 33.6 | 39.3 | 37.4 | 27.8 |
| Corporate profits with IVA and CCAdj | 2,060.5 | 2,023.7 | 2,114.5 | 2,243.0 | 2,250.5 | −59.7 | −36.8 | 90.8 | 128.5 | 7.6 |
| Taxes on corporate income | 396.3 | 376.2 | 311.3 | 282.9 | 298.7 | −10.8 | −20.1 | −64.8 | −28.4 | 15.8 |
| Profits after tax with IVA and CCAdj | 1,664.2 | 1,647.6 | 1,803.2 | 1,960.1 | 1,951.8 | −48.9 | −16.6 | 155.6 | 156.9 | −8.3 |
| Net dividends | 1,164.9 | 1,189.4 | 1,270.4 | 1,390.1 | 1,360.8 | 68.8 | 24.5 | 81.0 | 119.7 | −29.3 |
| Undistributed profits with IVA and CCAdj | 499.3 | 458.2 | 532.8 | 570.0 | 591.0 | −117.8 | −41.2 | 74.6 | 37.2 | 21.0 |
| Net interest and miscellaneous payments | 585.8 | 577.3 | 636.4 | 619.1 | 573.4 | 69.7 | −8.5 | 59.1 | −17.3 | −45.7 |
| Taxes on production and imports | 1,275.2 | 1,311.8 | 1,364.0 | 1,444.8 | 1,491.4 | 34.3 | 36.6 | 52.2 | 80.8 | 46.6 |
| Less: Subsidies | 57.2 | 61.7 | 59.9 | 63.3 | 73.9 | −0.9 | 4.6 | −1.9 | 3.4 | 10.6 |
| Business current transfer payments (net) | 154.2 | 164.6 | 150.7 | 156.6 | 158.0 | 23.8 | 10.4 | −13.9 | 5.9 | 1.4 |
| To persons (net) | 50.3 | 59.7 | 48.8 | 47.4 | 47.2 | 7.3 | 9.4 | −10.8 | −1.5 | −0.2 |
| To government (net) | 110.5 | 105.5 | 99.6 | 101.0 | 89.1 | 12.4 | −5.1 | −5.8 | 1.4 | −11.9 |
| To the rest of the world (net) | −6.6 | −0.5 | 2.2 | 8.2 | 21.7 | 4.0 | 6.1 | 2.7 | 6.0 | 13.5 |
| Current surplus of government enterprises | −5.3 | −4.3 | −5.3 | −5.8 | −7.6 | 5.7 | 0.9 | −0.9 | −0.6 | −1.8 |
| Revisions | ||||||||||
| National income | −3.2 | 29.1 | 145.0 | 143.7 | 107.0 | −0.7 | 32.3 | 115.9 | −1.4 | −36.6 |
| Compensation of employees | 1.3 | 3.5 | 10.9 | 21.6 | 4.7 | 1.3 | 2.3 | 7.4 | 10.7 | −16.9 |
| Proprietors' income with IVA and CCAdj | 0.8 | 1.1 | −9.2 | −2.8 | −0.6 | 0.8 | 0.3 | −10.3 | 6.4 | 2.3 |
| Rental income of persons with CCAdj | 0.9 | 1.2 | 3.1 | 2.5 | 9.2 | 0.9 | 0.3 | 1.9 | −0.6 | 6.7 |
| Corporate profits with IVA and CCAdj | −1.0 | 12.3 | 108.6 | 168.3 | 175.9 | −1.0 | 13.3 | 96.3 | 59.8 | 7.5 |
| Net interest and miscellaneous payments | −1.0 | 17.3 | 28.4 | −53.6 | −71.5 | −1.0 | 18.3 | 11.1 | −81.9 | −18.0 |
| Taxes on production and imports | −2.0 | −1.0 | −0.5 | 3.0 | −3.4 | −2.0 | 1.0 | 0.5 | 3.5 | −6.4 |
| Less: Subsidies | −0.1 | −0.1 | −1.3 | −1.1 | −0.9 | −0.1 | 0.0 | −1.2 | 0.2 | 0.2 |
| Business current transfer payments (net) | −2.5 | −3.6 | 5.3 | 2.9 | −12.7 | 0.0 | −1.0 | 8.9 | −2.4 | −15.6 |
| Current surplus of government enterprises | 0.3 | −1.7 | −2.8 | 0.6 | 4.6 | 0.3 | −2.0 | −1.0 | 3.4 | 3.9 |
- CCADj
- Capital consumption adjustment
- IVA
- Inventory valuation adjustment
Note. Dollar levels are from NIPA table 1.12.
Current-dollar GDI was revised down by less than 0.1 percent for 2015 and up by less than 0.1 percent for 2016; it was revised up by 0.4 percent for 2017 and 2019; and it was revised up by 0.5 percent for 2018. Current-dollar GDP is revised by less than 0.1 percent for 2015 and 2019 and by more than 0.1 percent for 2016–2018 (table 11 and chart 10).
The percent change in real GDI was unrevised for 2015, revised up 0.1 percentage point for 2016, revised up 0.4 percentage point for 2017, revised up 0.1 percentage point for 2018, and revised down 0.1 percentage point for 2019. From 2014 to 2019, the average of real GDI and real GDP increased at an average annual rate of 2.3 percent, up 0.1 percentage point from the previously published estimates.
The statistical discrepancy—current-dollar GDP less current-dollar GDI as a percentage of GDP—was −1.3 percent for 2015, −0.5 percent for 2016, −0.7 percent for 2017, −0.3 percent for 2018, and 0.1 percent for 2019 (table 11); the quarterly pattern of the statistical discrepancy is provided in chart 11.
| Level | Change from preceding period | |||||||||
|---|---|---|---|---|---|---|---|---|---|---|
| 2015 | 2016 | 2017 | 2018 | 2019 | 2015 | 2016 | 2017 | 2018 | 2019 | |
| Gross domestic product | 18,238.3 | 18,745.1 | 19,543.0 | 20,611.9 | 21,433.2 | 711.0 | 506.8 | 797.9 | 1,068.9 | 821.4 |
| Less: Statistical discrepancy | −237.3 | −92.2 | −131.4 | −58.0 | 12.8 | 49.3 | 145.1 | −39.3 | 73.4 | 70.8 |
| Equals: Gross domestic income | 18,475.6 | 18,837.3 | 19,674.4 | 20,669.9 | 21,420.4 | 661.7 | 361.6 | 837.2 | 995.4 | 750.5 |
| Plus: Income receipts from the rest of the world | 860.8 | 893.5 | 1,032.7 | 1,142.9 | 1,169.8 | 7.2 | 32.8 | 139.2 | 110.1 | 27.0 |
| Less: Income payments to the rest of the world | 640.4 | 661.5 | 740.4 | 858.2 | 900.2 | 27.9 | 21.1 | 79.0 | 117.7 | 42.1 |
| Equals: Gross national income | 18,696.0 | 19,069.3 | 19,966.7 | 20,954.6 | 21,690.0 | 641.1 | 373.3 | 897.4 | 987.9 | 735.4 |
| Less: Consumption of fixed capital | 2,911.4 | 2,986.6 | 3,112.9 | 3,265.0 | 3,420.9 | 96.4 | 75.2 | 126.3 | 152.2 | 155.9 |
| Equals: National income | 15,784.6 | 16,082.7 | 16,853.9 | 17,689.6 | 18,269.1 | 544.7 | 298.1 | 771.1 | 835.7 | 579.5 |
| Less: | ||||||||||
| Corporate profits with IVA and CCAdj | 2,060.5 | 2,023.7 | 2,114.5 | 2,243.0 | 2,250.5 | −59.7 | −36.8 | 90.8 | 128.5 | 7.6 |
| Taxes on production and imports less subsidies | 1,218.0 | 1,250.0 | 1,304.1 | 1,381.5 | 1,417.5 | 35.2 | 32.1 | 54.1 | 77.4 | 36.1 |
| Contributions for government social insurance, domestic | 1,204.7 | 1,239.1 | 1,298.4 | 1,360.4 | 1,418.8 | 51.2 | 34.3 | 59.3 | 62.0 | 58.4 |
| Net interest and miscellaneous payments on assets | 585.8 | 577.3 | 636.4 | 619.1 | 573.4 | 69.7 | −8.5 | 59.1 | −17.3 | −45.7 |
| Business current transfer payments (net) | 154.2 | 164.6 | 150.7 | 156.6 | 158.0 | 23.8 | 10.4 | −13.9 | 5.9 | 1.4 |
| Current surplus of government enterprises | −5.3 | −4.3 | −5.3 | −5.8 | −7.6 | 5.7 | 0.9 | −0.9 | −0.6 | −1.8 |
| Plus: Personal income receipts on assets | 2,472.2 | 2,551.7 | 2,738.5 | 2,946.7 | 2,967.9 | 169.9 | 79.6 | 186.8 | 208.2 | 21.2 |
| Plus: Personal current transfer receipts | 2,685.4 | 2,776.8 | 2,855.1 | 2,970.3 | 3,125.2 | 143.9 | 91.4 | 78.3 | 115.2 | 154.9 |
| Equals: Personal income | 15,724.2 | 16,160.7 | 16,948.6 | 17,851.8 | 18,551.5 | 732.5 | 436.5 | 787.9 | 903.2 | 699.7 |
| Revisions | ||||||||||
| Gross domestic product | 13.5 | 30.0 | 23.6 | 31.6 | 5.5 | 13.5 | 16.5 | −6.5 | 8.1 | −26.1 |
| Statistical discrepancy | 17.6 | 19.8 | −63.9 | −68.8 | −85.4 | 15.1 | 2.2 | −83.7 | −4.9 | −16.6 |
| Gross domestic income | −4.1 | 10.3 | 87.4 | 100.4 | 90.9 | −1.5 | 14.3 | 77.2 | 13.0 | −9.5 |
- CCADj
- Capital consumption adjustment
- IVA
- Inventory valuation adjustment
Note. Dollar levels are from NIPA table 1.12.

[Click chart to expand]

[Click chart to expand]
Most of the components of personal income are also components of national income and of GDI, and the revisions reflect the incorporation of much of the same newly available and revised source data, including tabulations of tax return data from the IRS, FRB data from the Financial Accounts of the United States, and wage and salary data from BLS' QCEW.
Personal income was revised up for 2015–2018; it was revised down for 2019 (table 12).
- For 2015, the revision was primarily due to upward revisions to personal current transfer receipts, compensation, and personal interest income; these were partly offset by a downward revision to employer contributions for employee pension and insurance funds.
- For 2016, the revision was primarily due to upward revisions to personal interest income and personal dividend income; compensation and personal current transfer receipts also contributed.
- For 2017, the upward revision was primarily due to upward revisions to personal dividend income and personal interest income; upward revisions to compensation and to personal current transfer receipts also contributed. These revisions were partly offset by a downward revision to proprietors' income.
- For 2018, the primary contributors to the upward revision were personal dividend income and compensation; downward revisions to personal interest income and to proprietors' income partly offset these impacts.
- For 2019, the revision primarily reflected downward revisions to personal current transfer receipts, particularly Medicare and Medicaid, and to personal interest income; these were partly offset by upward revisions to personal dividend income, rental income, and compensation.
- Personal saving was revised down for 2015 and 2019. For 2015, personal outlays were revised up by more than personal income; for 2019, personal income was revised down, and personal taxes were revised up. For 2016 and 2017, personal saving was revised up, as upward revisions to income more than offset upward revisions to outlays and taxes. For 2018, upward revisions to income more than offset the upward revision to taxes.
- The personal saving rate (personal saving as a percentage of disposable personal income) was revised down to 7.5 percent in 2015, revised up to 6.9 percent in 2016, revised up to 7.2 percent in 2017, revised up to 7.8 percent in 2018, and revised down to 7.5 percent in 2019 (a downward revision of 0.4 percentage point).
- For the first quarter of 2015 through the first quarter of 2020, the personal saving rate was revised up for 10 quarters, revised down for 10 quarters, and was unrevised for 1 quarter. The average quarterly saving rate over this period was unrevised at 7.5 percent.
| Level | Change from preceding period | |||||||||
|---|---|---|---|---|---|---|---|---|---|---|
| 2015 | 2016 | 2017 | 2018 | 2019 | 2015 | 2016 | 2017 | 2018 | 2019 | |
| Personal income | 15,724.2 | 16,160.7 | 16,948.6 | 17,851.8 | 18,551.5 | 732.5 | 436.5 | 787.9 | 903.2 | 699.7 |
| Compensation of employees | 9,699.4 | 9,963.9 | 10,422.5 | 10,950.1 | 11,432.4 | 450.3 | 264.4 | 458.7 | 527.6 | 482.3 |
| Wages and salaries | 7,859.5 | 8,089.1 | 8,471.5 | 8,894.2 | 9,309.3 | 384.3 | 229.6 | 382.3 | 422.7 | 415.1 |
| Private industries | 6,583.7 | 6,780.9 | 7,123.7 | 7,491.7 | 7,858.5 | 345.4 | 197.2 | 342.8 | 368.0 | 366.8 |
| Government | 1,275.8 | 1,308.2 | 1,347.7 | 1,402.5 | 1,450.8 | 38.9 | 32.4 | 39.5 | 54.8 | 48.3 |
| Supplements to wages and salaries | 1,839.9 | 1,874.7 | 1,951.1 | 2,055.9 | 2,123.1 | 66.1 | 34.8 | 76.3 | 104.8 | 67.2 |
| Proprietors' income with IVA and CCAdj | 1,423.0 | 1,424.8 | 1,509.0 | 1,585.9 | 1,657.7 | −24.8 | 1.8 | 84.2 | 77.0 | 71.7 |
| Farm | 56.2 | 36.0 | 41.5 | 43.0 | 49.7 | −13.6 | −20.2 | 5.5 | 1.5 | 6.6 |
| Nonfarm | 1,366.7 | 1,388.7 | 1,467.4 | 1,542.9 | 1,608.0 | −11.2 | 22.0 | 78.7 | 75.5 | 65.1 |
| Rental income of persons with CCAdj | 649.0 | 682.7 | 721.9 | 759.3 | 787.1 | 44.4 | 33.6 | 39.3 | 37.4 | 27.8 |
| Personal income receipts on assets | 2,472.2 | 2,551.7 | 2,738.5 | 2,946.7 | 2,967.9 | 169.9 | 79.6 | 186.8 | 208.2 | 21.2 |
| Personal interest income | 1,439.1 | 1,474.3 | 1,577.6 | 1,641.6 | 1,677.4 | 90.1 | 35.2 | 103.4 | 63.9 | 35.8 |
| Personal dividend income | 1,033.1 | 1,077.4 | 1,160.8 | 1,305.1 | 1,290.4 | 79.9 | 44.4 | 83.4 | 144.2 | −14.6 |
| Personal current transfer receipts | 2,685.4 | 2,776.8 | 2,855.1 | 2,970.3 | 3,125.2 | 143.9 | 91.4 | 78.3 | 115.2 | 154.9 |
| Government social benefits to persons | 2,635.1 | 2,717.1 | 2,806.2 | 2,922.9 | 3,078.0 | 136.5 | 82.0 | 89.1 | 116.7 | 155.1 |
| Other current transfer receipts, from business (net) | 50.3 | 59.7 | 48.8 | 47.4 | 47.2 | 7.3 | 9.4 | −10.8 | −1.5 | −0.2 |
| Less: Contributions for government social insurance | 1,204.7 | 1,239.1 | 1,298.4 | 1,360.4 | 1,418.8 | 51.2 | 34.3 | 59.3 | 62.0 | 58.4 |
| Less: Personal current taxes | 1,939.9 | 1,957.9 | 2,046.7 | 2,085.3 | 2,202.9 | 155.4 | 17.9 | 88.8 | 38.6 | 117.6 |
| Equals: Disposable personal income (DPI) | 13,784.3 | 14,202.8 | 14,901.9 | 15,766.5 | 16,348.6 | 577.2 | 418.5 | 699.0 | 864.7 | 582.1 |
| Less: Personal outlays | 12,745.6 | 13,227.8 | 13,830.9 | 14,529.2 | 15,117.4 | 509.4 | 482.2 | 603.1 | 698.3 | 588.2 |
| Equals: Personal saving | 1,038.7 | 975.0 | 1,071.0 | 1,237.3 | 1,231.2 | 67.7 | −63.7 | 95.9 | 166.3 | −6.1 |
| Personal saving as a percentage of DPI (percent) | 7.5 | 6.9 | 7.2 | 7.8 | 7.5 | 0.1 | −0.6 | 0.3 | 0.6 | −0.3 |
| Revisions | ||||||||||
| Personal income | 6.5 | 39.5 | 69.8 | 32.7 | −56.8 | 6.5 | 33.1 | 30.3 | −37.1 | −89.5 |
| Less: Personal current taxes | 2.2 | 1.8 | 0.9 | 7.6 | 19.7 | 1.6 | −0.4 | −0.9 | 6.7 | 12.1 |
| Equals: DPI | 4.3 | 37.7 | 68.9 | 25.0 | −76.5 | 4.9 | 33.4 | 31.1 | −43.8 | −101.6 |
| Less: Personal outlays | 14.4 | 21.5 | 28.8 | −1.9 | −4.9 | 15.2 | 7.1 | 7.3 | −30.7 | −3.0 |
| Equals: Personal saving | −10.1 | 16.2 | 40.1 | 26.9 | −71.6 | −10.3 | 26.3 | 23.8 | −13.1 | −98.5 |
| Personal saving as a percentage of DPI (percentage points) | −0.1 | 0.1 | 0.2 | 0.1 | −0.4 | −0.2 | 0.2 | 0.1 | −0.1 | −0.5 |
- CCADj
- Capital consumption adjustment
- IVA
- Inventory valuation adjustment
Note. Dollar levels are from NIPA table 2.1.

[Click chart to expand]
Table 13 presents the updated NIPA components with revisions of $5.0 billion or more (in absolute value) and lists the major source data that were incorporated as part of this year's update. Note that the incorporation of newly available and revised source data for a given year usually results in a revision to the level of an estimate both for that year and for subsequent years.
| Line | NIPA component and major source data incorporated1 | Billions of dollars | |||||
|---|---|---|---|---|---|---|---|
| Revision in level | Level | ||||||
| 2015 | 2016 | 2017 | 2018 | 2019 | 2019 | ||
| 1 | Gross domestic product | 13.5 | 30.0 | 23.6 | 31.6 | 5.5 | 21,433.2 |
| 2 | Personal consumption expenditures | 13.2 | 21.5 | 28.3 | −5.4 | −18.1 | 14,544.6 |
| 3 | Goods | 2.7 | 2.4 | 7.2 | 7.1 | 7.2 | 4,512.2 |
| 4 | Durable goods | 1.7 | −2.4 | −1.9 | 6.0 | 7.5 | 1,534.4 |
| 5 | Motor vehicles and parts | 1.1 | 1.9 | 1.4 | 1.7 | −9.3 | 521.8 |
| Of which: | |||||||
| 6 | Net purchases of used motor vehicles
Revised trade source data on cars and trucks in operation for 2015–2018; new Census Bureau Annual Retail Trade Survey (ARTS) data for retail and wholesale margins for 2018; new trade source data on cars and trucks in operation for 2019; revised Census Bureau Monthly Retail Trade Survey (MRTS) and Monthly Wholesale Trade Report data on retail sales and wholesale sales of used motor vehicle dealers for 2019. |
1.0 | 1.9 | 1.4 | 4.3 | −6.3 | 158.5 |
| 7 | Furnishings and durable household equipment | 0.1 | 0.4 | 0.0 | 2.1 | 3.8 | 357.4 |
| 8 | Recreational goods and vehicles | 0.5 | −5.3 | −4.6 | 4.4 | 15.6 | 433.4 |
| Of which: | |||||||
| 9 | Video, audio, photographic, and information processing equipment and media
Revised ARTS data for 2016–2017; new ARTS data for 2018; revised MRTS data for 2019; revised trade source retail scanner data for 2017–2018; new trade source retail scanner data for 2019; Census e-commerce report for 2015–2018; revised trade source data on prerecorded discs, vinyl, and permanent digital downloads for 2018; new trade source data on prerecorded discs, vinyl, and permanent digital downloads for 2019. |
0.5 | −4.5 | −3.7 | 1.8 | 11.3 | 256.3 |
| 10 | Other durable goods | 0.0 | 0.5 | 1.2 | −2.3 | −2.5 | 221.7 |
| 11 | Nondurable goods | 0.9 | 4.9 | 9.1 | 1.1 | −0.3 | 2,977.9 |
| 12 | Food and beverages purchased for off-premises consumption | 0.9 | 2.0 | 2.7 | −4.6 | −6.5 | 1,025.7 |
| Of which: | |||||||
| 13 | Food and nonalcoholic beverages purchased for off-premises consumption
Revised ARTS data for 2016–2017; new ARTS data for 2018; revised MRTS data for 2019; revised trade source retail scanner data for 2018; new trade source retail scanner data for 2019. |
0.8 | 1.6 | 2.3 | −5.5 | −8.6 | 878.1 |
| 14 | Clothing and footwear | −0.1 | 1.7 | 3.6 | 2.7 | 4.5 | 403.5 |
| 15 | Gasoline and other energy goods | 0.0 | 0.0 | 1.0 | −0.4 | −2.3 | 335.4 |
| 16 | Other nondurable goods | 0.1 | 1.1 | 1.8 | 3.4 | 4.0 | 1,213.3 |
| Of which: | |||||||
| 17 | Recreational items
Revised ARTS data for 2016–2017; new ARTS data for 2018; revised MRTS data for 2019; Census e-commerce report for 2015–2018. |
−0.2 | 0.5 | 0.8 | 3.4 | 5.3 | 183.2 |
| 18 | Services | 10.5 | 19.0 | 21.1 | −12.5 | −25.3 | 10,032.4 |
| 19 | Household consumption expenditures (for services) | 10.4 | 15.8 | 18.1 | −8.3 | −19.1 | 9,593.2 |
| 20 | Housing and utilities | 2.2 | 3.2 | 4.5 | 3.0 | 10.8 | 2,681.2 |
| 21 | Housing | 2.2 | 2.9 | 3.1 | 0.1 | 7.2 | 2,330.6 |
| 22 | Household utilities | 0.0 | 0.3 | 1.4 | 2.9 | 3.6 | 350.6 |
| 23 | Health care | 0.1 | 5.0 | 4.9 | −7.6 | −19.2 | 2,450.8 |
| 24 | Outpatient services | 0.1 | 5.1 | 8.9 | 3.2 | 1.9 | 1,104.2 |
| Of which: | |||||||
| 25 | Physician services
Revised Census Bureau Service Annual Survey (SAS) taxable and tax-exempt revenue data for 2015 through 2018; new SAS data for 2019. |
0.0 | 1.7 | 1.5 | −0.8 | −5.1 | 572.0 |
| 26 | Paramedical services
Revised SAS taxable revenue data for 2015 through 2018; new SAS data for 2019. |
0.1 | 3.6 | 7.1 | 5.0 | 8.9 | 397.4 |
| 27 | Hospital and nursing home services | 0.1 | −0.1 | −4.0 | −10.8 | −21.1 | 1,346.6 |
| Of which: | |||||||
| 28 | Nursing homes
Revised SAS taxable and tax-exempt revenue data for 2015 and 2018; new SAS data for 2019. |
0.0 | −0.1 | 0.0 | −6.8 | −17.9 | 190.1 |
| 29 | Transportation services | 0.1 | 0.4 | 0.9 | 4.5 | 5.2 | 483.4 |
| 30 | Motor vehicle services | 0.1 | −0.8 | −2.1 | −3.0 | −5.5 | 306.0 |
| 31 | Public transportation | 0.0 | 1.2 | 3.0 | 7.4 | 10.7 | 177.4 |
| Of which: | |||||||
| 32 | Air transportation
Revised SAS taxable revenue data for 2015 through 2018; new SAS data for 2019. |
0.0 | 1.2 | 1.6 | 3.4 | 5.9 | 114.7 |
| 33 | Recreation services | −0.4 | −1.3 | −1.4 | −1.4 | −7.4 | 580.4 |
| Of which: | |||||||
| 34 | Membership clubs, sports centers, parks, theaters, and museums
Revised SAS taxable and tax-exempt revenue data for 2015 through 2018; new SAS data for 2019. |
−0.2 | 0.2 | −1.5 | −2.1 | −6.2 | 218.2 |
| 35 | Food services and accommodations | 0.0 | 0.8 | −0.1 | −12.1 | −19.5 | 999.5 |
| Of which: | |||||||
| 36 | Food services | 0.0 | 0.0 | −0.7 | −11.3 | −19.2 | 843.2 |
| Of which: | |||||||
| 37 | Purchased meals and beverages
Revised SAS taxable revenue data for 2015 through 2018; new SAS data for 2019. |
0.0 | 0.0 | −0.7 | −11.3 | −19.1 | 820.7 |
| 38 | Financial services and insurance | 0.4 | 6.4 | 12.0 | 8.5 | 19.0 | 1,176.1 |
| 39 | Financial services | 0.2 | 6.4 | 4.3 | −4.5 | −4.5 | 733.4 |
| 40 | Financial services furnished without payment
Revised Federal Reserve Board (FRB) Financial Accounts of the United States data for 2015 to 2018; new FRB data for 2019; revised Internal Revenue Service (IRS) tabulations of corporate tax return data for 2017; new IRS tabulations of corporate and of sole proprietorship and partnership tax return data for 2018; new Federal Deposit Insurance Corporation data for 2019; new trade source data on credit unions and on investment companies for 2019. |
2.3 | 8.3 | 15.4 | 13.9 | 16.4 | 370.0 |
| 41 | Financial service charges, fees, and commissions
Revised SAS taxable revenue data for 2015 through 2018; new SAS data for 2019. |
−2.1 | −1.9 | −11.0 | −18.3 | –20.9 | 363.4 |
| 42 | Insurance | 0.2 | 0.1 | 7.6 | 13.0 | 23.5 | 442.7 |
| Of which: | |||||||
| 43 | Life insurance
Revised and newly available trade source data on life insurance company expenses for 2017 and 2018; new Bureau of Labor Statistics (BLS) Qarterly Census of Employment and Wages (QCEW) data for 2019. |
0.0 | 0.0 | 7.8 | 9.1 | 13.4 | 99.6 |
| 44 | Net health insurance
Revised benefits-to premiums ratio based on new trade source data on medical insurance for 2018; new Medical Expenditure Panel Survey (MEPS) data for 2019. |
0.1 | 0.0 | −0.2 | 4.2 | 5.3 | 245.7 |
| 45 | Other services | 8.0 | 1.2 | −2.7 | −3.1 | −8.0 | 1,221.8 |
| Of which: | |||||||
| 46 | Education services | 1.2 | 0.8 | −3.0 | −4.5 | −6.1 | 299.6 |
| 47 | Social services and religious activities
Revised SAS taxable and tax-exempt revenue data for 2015 through 2018; new SAS data for 2019. |
0.0 | 0.0 | 0.2 | 0.0 | −7.1 | 212.4 |
| 48 | Net foreign travel2 | 6.7 | 0.2 | 1.3 | −0.9 | 6.1 | −14.0 |
| 49 | Foreign travel by U.S. residents
Revised Bureau of Economic Analysis (BEA) International Transactions Accounts (ITAs) data for 2015–2019. |
−8.0 | −14.0 | −16.0 | −19.6 | −17.1 | 181.8 |
| 50 | Less: Expenditures in the United States by nonresidents
Revised BEA ITAs data for 2015–2019. |
−14.7 | −14.2 | −17.3 | −18.7 | −23.2 | 195.8 |
| 51 | Final consumption expenditures of nonprofit institutions serving households | 0.2 | 3.2 | 2.9 | −4.2 | −6.2 | 439.2 |
| 52 | Gross output of nonprofit institutions
Revised SAS tax-exempt expenses data for 2015 through 2018; new SAS data for 2019. |
0.0 | 3.3 | 1.8 | −0.9 | −14.2 | 1,658.1 |
| 53 | Less: Receipts from sales of goods and services by nonprofit institutions
Revised SAS tax-exempt expenses data for 2015 through 2018; new SAS data for 2019. |
−0.1 | 0.1 | −1.1 | 3.3 | −8.0 | 1,218.9 |
| 54 | Gross private domestic investment | 14.1 | 9.6 | −19.5 | 4.6 | 7.3 | 3,751.2 |
| 55 | Fixed investment | 9.2 | 8.4 | −5.7 | 1.6 | 26.5 | 3,702.1 |
| 56 | Nonresidential | 9.1 | 7.4 | −10.3 | −10.3 | 16.9 | 2,895.0 |
| 57 | Structures | 11.8 | 14.5 | 12.3 | −1.8 | 23.2 | 650.2 |
| 58 | Commercial and health care | 2.1 | 1.0 | 1.0 | 3.7 | 9.0 | 195.6 |
| Of which: | |||||||
| 59 | Office
Revised Census Bureau construction spending (value put in place) data for 2015–2019. |
0.5 | 0.2 | 1.6 | 3.9 | 7.7 | 85.0 |
| 60 | Manufacturing
Revised Census Bureau construction spending (value put in place) data for 2015–2019. |
0.4 | 0.6 | 1.9 | 4.9 | 7.2 | 77.1 |
| 61 | Power and communication | 8.0 | 10.5 | 6.0 | 0.0 | 10.7 | 129.2 |
| Of which: | |||||||
| 62 | Power | 8.0 | 10.5 | 7.2 | 0.1 | 11.5 | 107.1 |
| 63 | Electric
Revised Census Bureau construction spending (value put in place) data for 2015–2019. |
8.0 | 10.5 | 3.2 | −0.5 | 6.0 | 76.9 |
| 64 | Other power
Revised Census Bureau construction spending (value put in place) data for 2015–2019. |
0.0 | 0.0 | 3.9 | 0.6 | 5.5 | 30.2 |
| 65 | Mining exploration, shafts, and wells | 0.3 | 1.1 | −0.7 | −13.0 | −5.7 | 120.6 |
| Of which: | |||||||
| 66 | Petroleum and natural gas
Revised trade source data on footage drilled for 2015–2019; revised 2017 and new 2018 Census Bureau Annual Capital Expenditures Survey Data. |
0.3 | 1.1 | −0.7 | −13.5 | −6.1 | 113.7 |
| 67 | Other structures | 1.1 | 1.4 | 4.0 | 2.6 | 2.1 | 127.7 |
| 68 | Equipment | −2.1 | −5.0 | −21.4 | −9.2 | −0.1 | 1,241.0 |
| 69 | Information processing equipment | −1.0 | −2.1 | −9.7 | −12.7 | −15.5 | 397.2 |
| Of which: | |||||||
| 70 | Communication equipment
For 2017, new Census Bureau Economic Census data. For 2018, new Census Bureau Annual Survey of Manufactures (ASM) data; revised Census Bureau monthly industry shipments data for 2019. |
−0.4 | −0.9 | −3.5 | −10.7 | −14.1 | 119.2 |
| 71 | Industrial equipment | −0.3 | −0.8 | −2.8 | 5.6 | 8.5 | 260.9 |
| 72 | Transportation equipment | −0.4 | −1.0 | 9.0 | 7.7 | 8.4 | 310.3 |
| Of which: | |||||||
| 73 | Aircraft
For 2017, new Census Bureau Economic Census data. For 2018, new Census Bureau ASM data; revised Census Bureau monthly industry shipments data for 2019. |
−0.1 | −0.1 | 9.2 | 12.4 | 11.2 | 45.0 |
| 74 | Other equipment | −0.6 | −1.5 | −18.2 | −9.4 | −1.5 | 282.4 |
| Of which: | |||||||
| 75 | Agricultural machinery
For 2017, new Census Bureau Economic Census data. For 2018, new Census Bureau ASM data; revised Census Bureau monthly industry shipments data for 2019. |
0.0 | −0.1 | −3.9 | 2.8 | 5.6 | 45.8 |
| 76 | Other
For 2017, new Census Bureau Economic Census data. For 2018, new Census Bureau ASM data; revised Census Bureau monthly industry shipments data for 2019. |
0.0 | −0.1 | −2.7 | −5.4 | −3.3 | 64.5 |
| 77 | Intellectual property products | −0.6 | −2.2 | −1.1 | 0.7 | −6.3 | 1,003.8 |
| 78 | Software | 0.0 | −0.3 | 1.3 | 2.7 | −4.3 | 411.2 |
| Of which: | |||||||
| 79 | Custom
Revised Census Bureau Service Annual Survey (SAS) revenue data for 2016–2018; revised quarterly services survey revenue data for 2019. |
0.0 | 0.1 | −0.8 | −1.2 | −6.4 | 161.5 |
| 80 | Research and development
New National Science Foundation (NSF) business research and development survey data for 2018; revised data on expenses and receipts of tax-exempt scientific research and development services establishments for 2016–2018; new public financial reports on research and development expenses data for 2019. |
−0.6 | −1.8 | −2.0 | −0.4 | 0.3 | 501.9 |
| Of which: | |||||||
| 81 | Business | −0.4 | 0.0 | −0.7 | 1.6 | 2.4 | 475.1 |
| Of which: | |||||||
| 82 | Manufacturing | −0.2 | 0.1 | 0.3 | 2.2 | 0.1 | 293.6 |
| Of which: | |||||||
| 83 | Pharmaceutical and medicine manufacturing | 0.6 | 0.8 | 0.4 | 8.1 | 9.0 | 89.8 |
| 84 | Entertainment, literary, and artistic originals | 0.0 | 0.0 | −0.3 | −1.6 | −2.4 | 90.7 |
| 85 | Residential | 0.0 | 1.0 | 4.6 | 11.8 | 9.6 | 807.1 |
| 86 | Structures | 0.0 | 1.0 | 4.6 | 11.8 | 9.5 | 793.9 |
| 87 | Permanent site | −0.1 | 0.8 | 2.5 | 10.6 | 12.2 | 347.6 |
| 88 | Single-family structures
Revised Census Bureau construction spending (value put in place) data for 2015–2019. |
0.0 | 0.0 | 0.0 | 5.3 | 7.5 | 280.0 |
| 89 | Multifamily structures
Revised Census Bureau construction spending (value put in place) data for 2015–2019. |
−0.1 | 0.8 | 2.5 | 5.3 | 4.7 | 67.6 |
| 90 | Other structures | 0.1 | 0.2 | 2.1 | 1.2 | −2.7 | 446.3 |
| 91 | Residential equipment | 0.0 | 0.0 | 0.0 | 0.0 | 0.1 | 13.2 |
| 92 | Change in private inventories | 4.9 | 1.3 | −13.9 | 3.0 | −19.2 | 49.1 |
| 93 | Farm
Revised U.S. Department of Agriculture (USDA) data for 2015–2019. |
−0.1 | −0.1 | −1.4 | 1.0 | −7.0 | −14.5 |
| 94 | Nonfarm
New Economic Census data for 2017; revised Census Bureau monthly inventory data for 2019. |
5.0 | 1.4 | −12.4 | 2.0 | −12.2 | 63.6 |
| 95 | Change in book value
New ASM, AWTS, ARTS, SAS, and Statistics of Income (SOI) data for 2018; revised Census Bureau monthly inventory data for 2019. |
0.6 | 1.4 | −3.6 | 9.6 | −6.3 | 63.2 |
| 96 | Mining, utilities, and construction
New SOI data for 2018. |
0.0 | 0.0 | −0.1 | −10.8 | 0.3 | −1.8 |
| 97 | Manufacturing
New ASM data for 2018. |
0.0 | 0.0 | −1.5 | 16.4 | −1.7 | 20.0 |
| 98 | Wholesale trade
Revised Census Bureau monthly inventory data for 2019. |
−1.4 | 2.7 | −1.5 | 2.9 | −6.7 | 16.8 |
| 99 | Merchant wholesale
Revised Census Bureau monthly inventory data for 2019. |
−0.1 | 0.2 | −1.9 | −3.5 | −6.2 | 10.7 |
| 100 | Nonmerchant wholesale
New AWTS data for 2018. |
−1.3 | 2.5 | 0.4 | 6.5 | −0.5 | 6.1 |
| 101 | Retail trade
New ARTS data for 2018. |
2.0 | −1.4 | −0.1 | 7.2 | 3.6 | 18.6 |
| 102 | Other industries
New SAS and SOI data for 2018. |
0.0 | 0.0 | −0.4 | −6.1 | −1.8 | 9.6 |
| 103 | Inventory valuation adjustment (IVA)
New Economic Census data for 2017; new ASM data for 2018. |
4.4 | 0.0 | −8.8 | −7.6 | −6.6 | −0.2 |
| 104 | Net exports of goods and services2
Revised ITAs data for 2015–2019. |
−6.7 | 6.3 | 19.8 | 28.8 | 21.4 | −610.5 |
| 105 | Exports of goods and services | −0.9 | 6.6 | 17.8 | 18.5 | 10.5 | 2,514.8 |
| 106 | Exports of goods | 0.0 | 0.0 | 3.4 | 2.6 | −7.0 | 1,636.7 |
| 107 | Exports of services | −0.9 | 6.6 | 14.4 | 15.8 | 17.5 | 878.0 |
| Of which: | |||||||
| 108 | Travel (for all purposes including education) | −14.3 | −13.8 | −16.8 | −18.2 | −22.7 | 193.3 |
| 109 | Charges for the use of intellectual property not elsewhere classified (n.e.c.) | −13.6 | −11.4 | −8.4 | −9.9 | −6.2 | 117.4 |
| 110 | Other business services | 31.6 | 36.2 | 42.6 | 43.7 | 47.0 | 432.1 |
| 111 | Imports of goods and services | 5.8 | 0.3 | −2.0 | −10.3 | −10.9 | 3,125.2 |
| 112 | Imports of goods | 0.0 | 0.0 | −2.9 | −5.0 | −4.5 | 2,525.6 |
| 113 | Imports of services | 5.8 | 0.3 | 1.0 | −5.3 | −6.5 | 599.6 |
| 114 | Transport | 2.6 | −4.6 | −5.2 | −1.9 | −1.9 | 107.5 |
| 115 | Travel (for all purposes including education) | −11.9 | −14.4 | −16.9 | −18.5 | −18.3 | 134.6 |
| 116 | Charges for the use of intellectual property n.e.c. | −5.4 | −5.0 | −9.0 | −12.2 | −16.2 | 42.7 |
| 117 | Other business services | 14.0 | 18.0 | 25.5 | 20.1 | 22.7 | 272.4 |
| 118 | Government goods and services n.e.c. | 0.0 | 0.0 | 0.0 | 0.0 | 0.1 | 24.1 |
| 119 | Other | 6.6 | 6.2 | 6.6 | 7.2 | 7.1 | 18.4 |
| 120 | Government consumption expenditures and gross investment | −7.0 | −7.4 | −5.0 | 3.7 | −5.1 | 3,747.9 |
| 121 | Federal government | −0.7 | 0.6 | −5.5 | −7.8 | −3.8 | 1,419.2 |
| 122 | Consumption expenditures
Revised allocations of fiscal year (FY) 2017 and FY 2018 Office of Management and Budget (OMB) budget data for 2017 and 2018; revised FY 2019 OMB budget data for 2018 and 2019; new preliminary FY 2020 OMB budget data for 2019. |
−2.1 | −1.9 | −7.4 | −13.4 | −16.7 | 1,097.3 |
| Of which: | |||||||
| 123 | Nondurable goods
Revised allocations of FY 2017 and FY 2018 OMB budget data for 2017 and 2018; revised FY 2019 OMB budget data for 2018 and 2019; new preliminary FY 2020 OMB budget data for 2019. |
−0.3 | −1.1 | −2.0 | −3.6 | −5.5 | 52.0 |
| 124 | Services
Revised allocations of FY 2017 and FY 2018 OMB budget data for 2017 and 2018; revised FY 2019 OMB budget data for 2018 and 2019; new preliminary FY 2020 OMB budget data for 2019. |
−0.6 | 0.0 | −5.0 | −8.3 | −6.9 | 300.8 |
| 125 | Gross investment | 1.4 | 2.5 | 2.0 | 5.6 | 12.9 | 321.9 |
| Of which: | |||||||
| 126 | Intellectual property products | 0.7 | 1.5 | 3.4 | 4.9 | 8.9 | 186.1 |
| Of which: | |||||||
| 127 | Research and development
Revised FY 2019 OMB budget data for 2018 and 2019; new preliminary FY 2020 OMB budget data for 2019. |
0.7 | 1.5 | 3.4 | 4.9 | 9.5 | 145.8 |
| 128 | National defense
Revised allocations of FY 2017 and FY 2018 OMB budget data for 2017 and 2018; revised FY 2019 OMB budget data for 2018 and 2019; new preliminary FY 2020 OMB budget data for 2019. |
−0.4 | 0.3 | 1.0 | 0.8 | 6.2 | 852.4 |
| 129 | Consumption expenditures | −0.5 | 1.6 | 2.2 | −1.1 | −1.3 | 676.5 |
| 130 | Gross investment
Revised FY 2019 OMB budget data for 2018 and 2019; new preliminary FY 2020 OMB budget data for 2019. |
0.2 | −1.3 | −1.3 | 1.8 | 7.5 | 175.9 |
| 131 | Nondefense
Revised allocations of FY 2017 and FY 2018 OMB budget data for 2017 and 2018; revised FY 2019 OMB budget data for 2018 and 2019; new preliminary FY 2020 OMB budget data for 2019. |
−0.4 | 0.3 | −6.5 | −8.6 | −10.0 | 566.7 |
| 132 | Consumption expenditures
Revised allocations of FY 2017 and FY 2018 OMB budget data for 2017 and 2018; revised FY 2019 OMB budget data for 2018 and 2019; new preliminary FY 2020 OMB budget data for 2019. |
−1.6 | −3.6 | −9.7 | −12.4 | −15.4 | 420.8 |
| Of which: | |||||||
| 133 | Services
Revised allocations of FY 2017 and FY 2018 OMB budget data for 2017 and 2018; revised FY 2019 OMB budget data for 2018 and 2019; new preliminary FY 2020 OMB budget data for 2019. |
0.0 | 0.2 | −5.0 | −7.0 | −7.7 | 99.2 |
| 134 | Gross investment | 1.2 | 3.9 | 3.2 | 3.8 | 5.4 | 146.0 |
| Of which: | |||||||
| 135 | Intellectual property products | 1.3 | 4.4 | 6.7 | 5.7 | 7.1 | 111.1 |
| Of which: | |||||||
| 136 | Research and development
Revised allocations of FY 2017 and FY 2018 NSF survey data for 2017 and 2018; revised FY 2019 OMB budget data for 2018 and 2019; new preliminary FY 2020 OMB budget data for 2019. |
1.3 | 4.4 | 6.7 | 5.7 | 7.6 | 83.3 |
| 137 | State and local | −6.3 | −8.0 | 0.5 | 11.5 | −1.3 | 2,328.7 |
| Of which: | |||||||
| 138 | Consumption expenditures | −6.5 | −8.6 | −7.1 | 0.4 | −6.7 | 1,897.8 |
| Of which: | |||||||
| 139 | Compensation of general government employees
Revised BLS QCEW data for 2015–2018. New QCEW for 2019. MEPS health insurance data for 2018. |
−0.1 | 0.1 | −0.2 | 6.1 | 8.8 | 1,443.4 |
| 140 | Nondurable goods
Revised Census Bureau government finances FY 2012–FY 2017 tabulations for 2015–2017; new government finances FY 2018 tabulations for 2017 and 2018. |
−1.0 | −0.5 | −1.2 | −4.1 | −7.9 | 273.3 |
| 141 | Services
Revised Census Bureau government finances FY 2012–FY 2017 tabulations for 2015–2017; new government finances FY 2018 tabulations for 2017 and 2018. |
−3.0 | −2.9 | −3.2 | −6.9 | −17.8 | 501.4 |
| 142 | Less: Sales to other sectors
Revised Census Bureau government finances FY 2012–FY 2017 tabulations for 2015–2017; new government finances FY 2018 tabulations for 2017 and 2018. |
2.1 | 5.1 | 1.4 | −6.5 | −12.1 | 525.7 |
| Of which: | |||||||
| 143 | Health and hospital charges
Revised Census Bureau government finances FY 2012–FY 2017 tabulations for 2015–2017; new government finances FY 2018 tabulations for 2017 and 2018. |
−0.4 | 1.6 | −0.9 | −7.4 | −11.4 | 261.6 |
| 144 | Gross investment
Revised Census Bureau government finances FY 2012–FY 2017 tabulations for 2014–2017; new government finances FY 2018 tabulations for 2017 and 2018. |
0.2 | 0.7 | 7.6 | 11.1 | 5.5 | 431.0 |
| Of which: | |||||||
| 145 | Structures
Revised Census Bureau government finances FY 2012–FY 2017 tabulations for 2015–2017; new government finances FY 2018 tabulations for 2017 and 2018. |
1.3 | 1.6 | 6.5 | 9.5 | 6.4 | 339.1 |
| 146 | Gross domestic product | 13.5 | 30.0 | 23.6 | 31.6 | 5.5 | 21,433.2 |
| 147 | Less: Statistical discrepancy3 | 17.6 | 19.8 | −63.9 | −68.8 | −85.4 | 12.8 |
| 148 | Equals: Gross domestic income | −4.1 | 10.3 | 87.4 | 100.4 | 90.9 | 21,420.4 |
| 149 | Compensation of employees, paid
See entries for components under compensation of employees, line 171, and additional source data below. |
0.3 | 2.1 | 8.6 | 19.2 | 3.4 | 11,444.5 |
| 150 | Wages and salaries | 1.8 | 4.2 | 7.1 | 3.3 | 3.9 | 9,321.4 |
| 151 | To persons
Revised SAS data for 2015 through 2018; new SAS data for 2019. Revised local education wages for 2017. |
2.8 | 5.6 | 9.2 | 5.7 | 5.3 | 9,302.6 |
| 152 | To the rest of the world | −1.0 | −1.4 | −2.1 | −2.5 | −1.4 | 18.8 |
| 153 | Supplements to wages and salaries
See line 176. |
−1.5 | −2.1 | 1.5 | 15.9 | −0.4 | 2,123.1 |
| 154 | Taxes on production and imports | −2.0 | −1.0 | −0.5 | 3.0 | −3.4 | 1,491.4 |
| 155 | Less: Subsidies | −0.1 | −0.1 | −1.3 | −1.1 | −0.9 | 73.9 |
| 156 | Net operating surplus | 2.6 | 14.0 | 86.6 | 103.6 | 132.0 | 5,137.4 |
| 157 | Private enterprises | 2.3 | 15.8 | 89.4 | 103.0 | 127.4 | 5,145.0 |
| 158 | Current surplus of government enterprises | 0.3 | −1.7 | −2.8 | 0.6 | 4.6 | −7.6 |
| 159 | Consumption of fixed capital | −5.1 | −5.0 | −8.6 | −26.4 | −42.0 | 3,420.9 |
| 160 | Private | −5.2 | −4.9 | −8.6 | −26.8 | −43.5 | 2,832.7 |
| 161 | Domestic business
Revised BEA fixed investment and price estimates for 2015–2019. |
−4.9 | −4.9 | −9.2 | −26.4 | −40.7 | 2,233.6 |
| 162 | Capital consumption allowances
Revised IRS tabulations of corporate tax return data for 2017; new IRS tabulations of corporate and of sole proprietorship and partnership tax return data for 2018; revised Office of Tax Analysis bonus depreciation estimates for 2015–2019; revised BEA fixed investment estimates for 2015–2019. |
0.0 | 0.0 | 55.6 | 17.3 | −35.7 | 2,586.3 |
| 163 | Less: Capital consumption adjustment (CCAdj) | 4.9 | 4.8 | 64.8 | 43.6 | 5.0 | 352.6 |
| 164 | Households and institutions | −0.3 | 0.0 | 0.6 | −0.4 | −2.8 | 599.0 |
| 165 | Government | 0.1 | −0.1 | 0.0 | 0.4 | 1.4 | 588.3 |
| 166 | Plus: Income receipts from the rest of the world
Revised ITA data for 2015–2019. |
23.1 | 31.8 | 74.8 | 36.6 | 11.0 | 1,169.8 |
| 167 | Less: Income payments to the rest of the world
Revised ITA data for 2015–2019. |
27.3 | 18.0 | 25.8 | 19.8 | 36.9 | 900.2 |
| 168 | Equals: Gross national income | −8.3 | 24.1 | 136.4 | 117.2 | 65.0 | 21,690.0 |
| 169 | Less: Consumption of fixed capital | −5.1 | −5.0 | −8.6 | −26.4 | −42.0 | 3,420.9 |
| 170 | Equals: National income | −3.2 | 29.1 | 145.0 | 143.7 | 107.0 | 18,269.1 |
| 171 | Compensation of employees | 1.3 | 3.5 | 10.9 | 21.6 | 4.7 | 11,432.4 |
| 172 | Wages and salaries | 2.8 | 5.6 | 9.4 | 5.7 | 5.2 | 9,309.3 |
| 173 | Government | 0.1 | 0.2 | −0.2 | −0.1 | −1.0 | 1,450.8 |
| 174 | Other
Revised SAS data for 2015 through 2018; new SAS data for 2019. Revised local education wages for 2017. |
2.7 | 5.4 | 9.6 | 5.8 | 6.1 | 7,858.5 |
| 175 | Supplements to wages and salaries | −1.5 | −2.1 | 1.5 | 15.9 | −0.4 | 2,123.1 |
| 176 | Employer contributions for employee pension and insurance funds
New Department of Labor pension data for 2017 affecting 2018 extrapolations; new Pension Benefit Guaranty Corporation data for 2018; revised FRB Financial Accounts of the United States data for 2016 and 2017; new FRB data for 2018; new Department of Health and Human Services MEPS data for 2018 and 2019. |
−1.7 | −2.1 | 2.1 | 13.5 | 0.8 | 1,474.0 |
| 177 | Employer contributions for government social insurance | 0.1 | 0.0 | −0.6 | 2.4 | −1.2 | 649.1 |
| 178 | Proprietors’ income with IVA and CCAdj | 0.8 | 1.1 | −9.2 | −2.8 | −0.6 | 1,657.7 |
| 179 | Farm | 0.2 | 0.4 | 3.4 | 15.8 | 17.7 | 49.7 |
| 180 | Proprietors’ income with IVA
Revised USDA data for 2015–2019. |
0.2 | 0.4 | 3.4 | 15.8 | 17.7 | 56.3 |
| 181 | CCAdj | 0.0 | 0.0 | 0.0 | 0.0 | 0.0 | −6.6 |
| 182 | Nonfarm | 0.6 | 0.6 | −12.7 | −18.6 | −18.2 | 1,608.0 |
| 183 | Proprietors’ income
Revised IRS tabulations of corporate tax return data for the posttabulation adjustments for 2017; new IRS tabulations of sole proprietorship and partnership tax return data for 2018; new Census Bureau nonfiler income data for 2017. |
0.1 | 0.3 | −16.1 | −13.8 | −9.4 | 1,245.3 |
| 184 | IVA | 0.0 | 0.0 | 0.8 | −0.2 | −0.3 | −0.6 |
| 185 | CCAdj | 0.4 | 0.4 | 2.6 | −4.7 | −8.5 | 363.3 |
| 186 | Rental income of persons with CCAdj | 0.9 | 1.2 | 3.1 | 2.5 | 9.2 | 787.1 |
| 187 | Rental income of persons
New Census Bureau Current Population Survey/Housing Vacancy Survey (CPS/HVS) data on units for 2019; revised CPS/HVS data on units for 2017–2018; revised FRB Financial Accounts of the United States data on residential mortgage loan liabilities for 2018–2019; revised Freddie Mac data on the value of mortgage originations for 2017–2019. |
0.9 | 1.2 | 3.1 | 2.5 | 9.0 | 809.7 |
| 188 | CCAdj | 0.0 | 0.0 | 0.0 | 0.0 | 0.2 | −22.6 |
| 189 | Corporate profits with IVA and CCAdj
Revised IRS tabulations of corporate tax return data for 2017; new IRS tabulations for 2018; revised Census Bureau Quarterly Financial Report data for 2019; regulatory agency and public financial reports profits data for 2019. |
−1.0 | 12.3 | 108.6 | 168.3 | 175.9 | 2,250.5 |
| 190 | Domestic industries | 6.3 | 4.2 | 65.4 | 157.4 | 201.4 | 1,745.1 |
| 191 | Financial | −0.6 | −0.6 | 29.3 | 24.3 | 55.1 | 462.0 |
| 192 | Nonfinancial | 6.9 | 4.8 | 36.1 | 133.2 | 146.3 | 1,283.0 |
| 193 | Rest of the world
Revised BEA ITA estimates for 2015–2019. |
−7.3 | 8.1 | 43.1 | 10.9 | −25.5 | 505.4 |
| 194 | Less: CCAdj
See entries under Consumption of fixed capital, line 159. |
4.5 | 4.4 | 62.1 | 48.3 | 13.3 | 18.5 |
| 195 | Equals: Corporate profits with IVA | −5.5 | 7.8 | 46.5 | 120.1 | 162.6 | 2,232.0 |
| 196 | Domestic industries | 1.8 | −0.2 | 3.3 | 109.2 | 188.1 | 1,726.5 |
| 197 | Financial | −0.9 | −1.0 | 22.1 | 13.2 | 51.5 | 470.5 |
| 198 | Federal Reserve banks | 0.0 | 0.0 | 0.0 | 4.5 | 0.8 | 52.4 |
| 199 | Other financial | −0.9 | −1.0 | 22.1 | 8.7 | 50.7 | 418.1 |
| 200 | Nonfinancial | 2.7 | 0.8 | −18.8 | 96.0 | 136.6 | 1,256.0 |
| 201 | Utilities | 0.1 | 0.1 | 2.4 | 25.7 | 29.7 | 27.2 |
| 202 | Manufacturing | 2.4 | 0.5 | −10.8 | 53.9 | 63.8 | 336.5 |
| 203 | Durable goods | −0.2 | 0.3 | 0.4 | 39.0 | 43.9 | 181.3 |
| 204 | Nondurable goods | 2.6 | 0.1 | −11.2 | 15.0 | 19.9 | 155.2 |
| 205 | Wholesale trade | 0.4 | 0.0 | −2.2 | −3.1 | −9.1 | 111.3 |
| 206 | Retail trade | 0.0 | 0.1 | −7.8 | 13.4 | 4.1 | 168.0 |
| 207 | Transportation and warehousing | 0.0 | 0.0 | 0.5 | 7.9 | 15.8 | 56.4 |
| 208 | Information | −0.1 | 0.0 | −3.0 | 17.5 | 29.2 | 130.8 |
| 209 | Other nonfinancial | −0.1 | 0.2 | 2.0 | −19.2 | 3.2 | 425.8 |
| 210 | Rest of the world | −7.3 | 8.1 | 43.1 | 10.9 | −25.5 | 505.4 |
| 211 | Less: IVA | 3.2 | 0.2 | −3.8 | −3.1 | −6.5 | −5.3 |
| 212 | Equals: Corporate profits before tax without IVA and CCAdj | −8.7 | 7.6 | 50.2 | 123.2 | 169.1 | 2,237.3 |
| 213 | Domestic industries | −1.3 | −0.5 | 7.1 | 112.3 | 194.6 | 1,731.8 |
| 214 | Financial | −0.9 | −1.0 | 22.1 | 13.2 | 51.5 | 470.5 |
| 215 | Nonfinancial | −0.5 | 0.5 | −15.0 | 99.1 | 143.1 | 1,261.3 |
| 216 | Rest of the world | −7.3 | 8.1 | 43.1 | 10.9 | −25.5 | 505.4 |
| 217 | Receipts from the rest of the world | −5.0 | 3.5 | 51.3 | 14.2 | −13.0 | 871.2 |
| 218 | Less: Payments to the rest of the world | 2.3 | −4.6 | 8.1 | 3.3 | 12.6 | 365.7 |
| 219 | Less: Taxes on corporate income | −0.3 | −1.4 | −8.1 | 63.1 | 80.5 | 298.7 |
| 220 | Equals: Profits after tax | −8.4 | 9.0 | 58.3 | 60.1 | 88.5 | 1,938.6 |
| 221 | Domestic industries | −1.0 | 0.9 | 15.2 | 49.2 | 114.1 | 1,433.1 |
| 222 | Rest of the world | −7.3 | 8.1 | 43.1 | 10.9 | −25.5 | 505.4 |
| 223 | Less: Net corporate dividend payments, National income and product accounts | 0.0 | 13.5 | 30.8 | 77.5 | 20.0 | 1,360.8 |
| 224 | Domestic industries | 0.0 | 0.0 | 15.3 | 7.8 | 56.4 | 895.8 |
| 225 | Rest of the world | 0.0 | 13.5 | 15.5 | 69.8 | −36.5 | 465.1 |
| 226 | Equals: Undistributed corporate profits | −8.4 | −4.5 | 27.6 | −17.5 | 68.6 | 577.7 |
| 227 | Domestic industries | −1.0 | 0.9 | −0.1 | 41.4 | 57.6 | 537.4 |
| 228 | Rest of the world | −7.3 | −5.4 | 27.7 | −58.9 | 10.9 | 40.4 |
| 229 | Net interest and miscellaneous payments
Newly available corporate SOI for 2016 and 2017; newly available sole proprietors and partnerships SOI for 2017. Updated extrapolation for 2018 with newly available SOI. |
−1.0 | 17.3 | 28.4 | −53.6 | −71.5 | 573.4 |
| 230 | Net interest | −0.5 | 17.6 | 28.5 | −52.8 | −69.5 | 553.1 |
| 231 | Domestic business | −4.5 | 12.7 | 25.9 | −55.8 | ... | 475.1 |
| 232 | Monetary interest paid
Newly available corporate SOI for 2018; revised corporate SOI for 2017; newly available sole proprietors and partnerships SOI for 2017. |
4.2 | 7.3 | 69.1 | 65.3 | ... | 1,937.4 |
| 233 | Less: Monetary interest received
Newly available corporate SOI for 2018; revised corporate SOI for 2017; newly available sole proprietors and partnerships SOI for 2017. |
−0.1 | −5.5 | 49.7 | 121.7 | ... | 2,382.5 |
| 234 | Imputed interest paid, depositor, insurance, and pension services
Revised implicit and direct commissions received by regulated investment companies; newly available American Council for Life Insurers (ACLI) data on net investment income; revised imputed interest paid by state and local pension plans for 2018. |
−2.4 | −2.3 | −3.6 | −15.9 | ... | 1,165.7 |
| 235 | Financial
Revised implicit and direct commissions received by regulated investment companies; newly available ACLI data on net investment income; revised imputed interest paid by state and local pension plans for 2018. |
−2.4 | −2.3 | −1.0 | −10.2 | ... | 1,161.7 |
| Of which: | |||||||
| 236 | Employee pension plans | 0.0 | −0.8 | −2.2 | −11.1 | ... | 496.9 |
| 237 | Nonfinancial | 0.0 | 0.0 | −2.6 | −5.8 | ... | 4.1 |
| 238 | Less: Imputed interest received, depositor, insurance, and pension services | −0.9 | −7.3 | −13.4 | −17.8 | ... | 393.0 |
| 239 | Imputed interest paid, borrower services | −0.8 | −5.5 | −10.3 | −15.8 | ... | −166.9 |
| 240 | Less: Imputed interest received, borrower services | 6.4 | −0.5 | −6.9 | −14.5 | ... | −314.4 |
| 241 | Owner-occupied housing | 1.8 | 0.6 | −0.6 | 0.1 | ... | 296.4 |
| 242 | Nonprofit institutions | 0.1 | −0.2 | −0.4 | −0.6 | ... | 5.4 |
| 243 | Rest of the world
New treatment of borrower and depositor imputed interest flows to and from the rest of the world for 2015–2019; revised monetary payments and receipts from the ITAs for 2015–2019. |
2.1 | 4.4 | 3.5 | 3.5 | −1.7 | −223.8 |
| 244 | Miscellaneous payments | −0.5 | −0.3 | −0.1 | −0.8 | −2.1 | 20.3 |
| 245 | Federal rents and royalties | −0.1 | −0.2 | 0.0 | −0.5 | −2.0 | 8.5 |
| 246 | State and local rents and royalties | −0.4 | −0.1 | −0.1 | −0.2 | −0.1 | 11.8 |
| 247 | Taxes on production and imports | −2.0 | −1.0 | −0.5 | 3.0 | −3.4 | 1,491.4 |
| 248 | Federal | 0.0 | 0.0 | 2.2 | 1.9 | 4.6 | 173.7 |
| 249 | State and local
Revised Census Bureau government finances FY 2012–FY 2017 tabulations for 2015–2017; new government finances FY 2018 tabulations for 2017 and 2018. |
−1.9 | −1.0 | −2.7 | 1.1 | −8.0 | 1,317.7 |
| 250 | Less: Subsidies | −0.1 | −0.1 | −1.3 | −1.1 | −0.9 | 73.9 |
| 251 | Federal | −0.1 | −0.1 | −1.3 | −1.1 | −0.9 | 73.3 |
| 252 | State and local | 0.0 | 0.0 | 0.0 | 0.0 | 0.0 | 0.6 |
| 253 | Business current transfer payments (net) | −2.5 | −3.6 | 5.3 | 2.9 | −12.7 | 158.0 |
| 254 | To persons (net)
Revised trade source data on insurance benefits for 2015–2019; revised IRS tabulations of corporate gifts for 2017 and new tabulations for 2018. |
0.0 | 0.0 | 0.8 | −5.8 | −7.4 | 47.2 |
| 255 | To government (net) | 1.0 | 1.7 | 2.5 | −0.5 | −2.8 | 89.1 |
| 256 | To the rest of the world (net)
Revised ITA data for 2015–2019. |
−3.6 | −5.3 | 2.0 | 9.1 | −2.5 | 21.7 |
| 257 | Current surplus of government enterprises | 0.3 | −1.7 | −2.8 | 0.6 | 4.6 | −7.6 |
| 258 | Federal
Revised FY 2019 OMB budget data for 2018 and 2019; new preliminary FY 2020 OMB budget data for 2019. |
0.3 | 0.1 | −0.1 | 1.9 | 5.8 | −1.9 |
| 259 | State and local | 0.0 | −1.9 | −2.7 | −1.2 | −1.2 | −5.7 |
| Addenda: | |||||||
| 260 | Gross national product | 9.3 | 43.9 | 72.6 | 48.4 | −20.4 | 21,702.9 |
| 261 | Gross saving | −1.5 | 27.0 | 128.9 | 131.7 | 111.1 | 3,988.4 |
| 262 | Personal income | 6.5 | 39.5 | 69.8 | 32.7 | −56.8 | 18,551.5 |
| 263 | Compensation of employees | 1.3 | 3.5 | 10.9 | 21.6 | 4.7 | 11,432.4 |
| 264 | Proprietors’ income with IVA and CCAdj | 0.8 | 1.1 | −9.2 | −2.8 | −0.6 | 1,657.7 |
| 265 | Rental income of persons with CCAdj | 0.9 | 1.2 | 3.1 | 2.5 | 9.2 | 787.1 |
| 266 | Personal income receipts on assets | 1.4 | 30.3 | 56.9 | 16.5 | −25.0 | 2,967.9 |
| 267 | Personal interest income | 1.2 | 16.9 | 26.1 | −61.1 | −43.1 | 1,677.4 |
| 268 | Monetary interest received by persons | −0.4 | 11.0 | 15.5 | −60.1 | ... | 635.0 |
| 269 | Imputed interest received by persons, depositor, insurance, and pension services | 1.7 | 5.9 | 10.6 | −1.0 | ... | 1,041.4 |
| 270 | From banks, credit agencies, and investment companies | 2.8 | 7.1 | 12.7 | 12.2 | ... | 245.1 |
| 271 | From life insurance carriers | −1.2 | −0.4 | 0.1 | −2.7 | ... | 287.6 |
| 272 | From property and casualty insurance companies | 0.0 | 0.0 | 0.0 | 0.6 | ... | 11.8 |
| 273 | From employee pension plans | 0.0 | −0.8 | −2.2 | −11.1 | ... | 496.8 |
| 274 | Imputed interest received by nonprofit institutions | 0.0 | 0.0 | 0.0 | 0.1 | 0.1 | 1.0 |
| 275 | Personal dividend income | 0.2 | 13.5 | 30.8 | 77.6 | 18.1 | 1,290.4 |
| 276 | Personal current transfer receipts | 2.1 | 2.6 | 7.0 | −1.2 | −46.7 | 3,125.2 |
| 277 | Government social benefits to persons | 2.1 | 2.6 | 6.2 | 4.6 | −39.3 | 3,078.0 |
| 278 | Federal
Revised CMS data on incurred Medicare benefits for 2015–2018; new data for 2019. Revised FY 2019 OMB budget data for 2018 and 2019; new preliminary FY 2020 OMB budget data for 2019. Reclassification of federal spending from nondefense CE to social benefits for 2017–2018. |
2.4 | 3.6 | 10.9 | 14.0 | −18.5 | 2,323.5 |
| 279 | State and local
Revised Census Bureau government finances FY 2015–FY 2017 tabulations for 2015–2017; new government finances FY 2017 tabulations for 2016 and 2017; revised CMS data on Medicaid benefits for 2016–2019 and new CMS data on Children's Health Insurance Program for 2018; new Alaska dividends data for 2018–2019. |
−0.2 | −1.0 | −4.7 | −9.4 | −20.8 | 754.6 |
| 280 | Other current transfer receipts, from business (net)
Revised ITAs for 2015–2019. |
0.0 | 0.0 | 0.8 | −5.8 | −7.4 | 47.2 |
| 281 | Less: Contributions for government social insurance, domestic | 0.0 | −0.8 | −1.2 | 4.0 | −1.6 | 1,418.8 |
| 282 | Federal
Revised Social Security Administration data on wages subject to Federal Insurance Contributions Act taxes and earnings subject to Self-Employment Contributions Act taxes. |
0.0 | −0.3 | −0.2 | 5.2 | −0.8 | 1,402.2 |
| 283 | State and local | 0.1 | −0.1 | −0.8 | −1.2 | −1.0 | 21.7 |
| 284 | Less: Personal current taxes | 2.2 | 1.8 | 0.9 | 7.6 | 19.7 | 2,202.9 |
| 285 | Federal
Treasury Department tax receipts and tax refunds data for 2019. |
1.9 | 1.4 | 1.5 | −2.7 | 12.8 | 1,713.0 |
| 286 | State and local
Revised Census Bureau government finances FY 2012–FY 2017 tabulations for 2015–2017; new FY 2018 tabulations for 2017 and 2018; revised FY 2012–FY 2018 Census Bureau state government tax collections tabulations for 2015 and 2018; new FY 2019 tabulations for 2018 and 2019; new quarterly summary of tax revenue for 2019; revised for 2018. |
0.2 | 0.4 | −0.6 | 10.4 | 7.0 | 489.9 |
| 287 | Equals: Disposable personal income | 4.3 | 37.7 | 68.9 | 25.0 | −76.5 | 16,348.6 |
| 288 | Less: Personal outlays | 14.4 | 21.5 | 28.8 | −1.9 | −4.9 | 15,117.4 |
| 289 | Personal consumption expenditures | 13.2 | 21.5 | 28.3 | −5.4 | −18.1 | 14,544.6 |
| 290 | Personal interest payments | 0.5 | −0.7 | −2.0 | −3.8 | 2.4 | 362.3 |
| 291 | Monetary interest paid by persons | 0.0 | 0.3 | 0.3 | 0.5 | 7.3 | 428.0 |
| 292 | Imputed interest paid by persons, borrower services
Revised FRB Financial Accounts of the United States for imputed interest received by commercial banks from persons for 2015 to 2019. |
0.6 | −1.0 | −2.3 | −4.3 | −4.9 | −65.6 |
| 293 | Personal current transfer payments | 0.6 | 0.8 | 2.5 | 7.3 | 10.7 | 210.5 |
| 294 | To government | 0.9 | 1.4 | 3.5 | 4.5 | 6.3 | 115.2 |
| 295 | To the rest of the world (net) | −0.3 | −0.6 | −1.0 | 2.8 | 4.4 | 95.3 |
| 296 | Equals: Personal saving | −10.1 | 16.2 | 40.1 | 26.9 | −71.6 | 1,231.2 |
- ACLI
- American Council for Life Insurers
- ARTS
- Annual Retail Trade Survey
- ASM
- Annual Survey of Manufactures
- BEA
- Bureau of Economic Analysis
- BLS
- Bureau of Labor Statistics
- CCAdj
- Capital consumption adjustment
- CPS/HVS
- Current Population Survey/Housing Vacancy Survey
- FRB
- Federal Reserve Board
- FY
- Fiscal year
- IRS
- Internal Revenue Service
- ITAs
- International Transactions Accounts
- IVA
- Inventory valuation adjustment
- MEPS
- Medical Expenditure Panel Survey
- MRTS
- Monthly Retail Trade Survey
- n.e.c.
- Not elsewhere classified
- NIPAs
- National Income and Product Accounts
- NSF
- National Science Foundation
- OMB
- Office of Management and Budget
- QCEW
- Quarterly Census of Employment and Wages
- SAS
- Service Annual Survey
- SOI
- Statistics of Income
- USDA
- U.S. Department of Agriculture
- In these descriptions, “new” indicates this is the first time that data from the specific source are being incorporated into the component estimate for the given year, and “revised” indicates that data from the specific source were incorporated previously and now revised data from that source are being incorporated.
- Revisions reflect the annual revision of BEA's international transactions accounts (ITAs). For more information, see Rudy Telles Jr., Nick Martinez, and Ted Peck, “Annual Update of the U.S. International Transactions Accounts,” in the July 2020 Survey of Current Business.
- The statistical discrepancy is gross domestic product (GDP) less gross domestic income (GDI); it is also the difference between gross national product (GNP) and gross national income (GNI), which is GDI plus net income receipts from the rest of the world. The statistical discrepancy arises because the product-side measures of GDP and GNP are estimated independently from the income-side measures of GDI and GNI.
| Account 1. Domestic Income and Product Account | |||||
|---|---|---|---|---|---|
| Line | Line | ||||
| 1 | Compensation of employees, paid | 11,444.5 | 15 | Personal consumption expenditures (3–3) | 14,544.6 |
| 2 | Wages and salaries | 9,321.4 | 16 | Goods | 4,512.2 |
| 3 | Domestic (3–12) | 9,302.6 | 17 | Durable goods | 1,534.4 |
| 4 | Rest of the world (5–15) | 18.8 | 18 | Nondurable goods | 2,977.9 |
| 5 | Supplements to wages and salaries (3–14) | 2,123.1 | 19 | Services | 10,032.4 |
| 6 | Taxes on production and imports (4–15) | 1,491.4 | 20 | Gross private domestic investment | 3,751.2 |
| 7 | Less: Subsidies (4–8) | 73.9 | 21 | Fixed investment (6–2) | 3,702.1 |
| 8 | Net operating surplus | 5,137.4 | 22 | Nonresidential | 2,895.0 |
| 9 | Private enterprises (2–19) | 5,145.0 | 23 | Structures | 650.2 |
| 10 | Current surplus of government enterprises (4–28) | −7.6 | 24 | Equipment | 1,241.0 |
| 11 | Consumption of fixed capital (6–14) | 3,420.9 | 25 | Intellectual property products | 1,003.8 |
| 26 | Residential | 807.1 | |||
| 12 | Gross domestic income | 21,420.4 | 27 | Change in private inventories (6–4) | 49.1 |
| 28 | Net exports of goods and services | −610.5 | |||
| 13 | Less: Statistical discrepancy (6–20) | 12.8 | 29 | Exports (5–1) | 2,514.8 |
| 30 | Imports (5–13) | 3,125.2 | |||
| 31 | Government consumption expenditures and gross investment (4–1 plus 6–3) | 3,747.9 | |||
| 32 | Federal | 1,419.2 | |||
| 33 | National defense | 852.4 | |||
| 34 | Nondefense | 566.7 | |||
| 35 | State and local | 2,328.7 | |||
| 14 | Gross domestic product | 21,433.2 | 36 | Gross domestic product | 21,433.2 |
| Account 2. Private Enterprise Income Account | |||||
|---|---|---|---|---|---|
| Line | Line | ||||
| 1 | Income payments on assets | 3,625.5 | 19 | Net operating surplus, private enterprises (1–9) | 5,145.0 |
| 2 | Interest and miscellaneous payments (2–21 and 3–20 and 4–22 and 5–17) | 3,259.8 | 20 | Income receipts on assets | 3,333.8 |
| 3 | Dividend payments to the rest of the world (5–18) | 218.3 | 21 | Interest (2–2 and 3–4 and 4–7 and 5–5) | 2,462.6 |
| 4 | Reinvested earnings on foreign direct investment in the United States (5–19) | 147.5 | 22 | Dividend receipts from the rest of the world (5–6) | 683.3 |
| 5 | Business current transfer payments (net) | 158.0 | 23 | Reinvested earnings on U.S. direct investment abroad (5–7) | 187.9 |
| 6 | To persons (net) (3–24) | 47.2 | |||
| 7 | To government (net) (4–25) | 89.1 | |||
| 8 | To the rest of the world (net) (5–23 less 5–11 less 2–14) | 21.7 | |||
| 9 | Proprietors' income with IVA and CCAdj (3–17) | 1,657.7 | |||
| 10 | Rental income of persons with IVA and CCAdj (3–18) | 787.1 | |||
| 11 | Corporate profits with IVA and CCAdj | 2,250.5 | |||
| 12 | Taxes on corporate income | 298.7 | |||
| 13 | To government (4–16) | 286.8 | |||
| 14 | To the rest of the world (5–23) | 11.9 | |||
| 15 | Profits after tax with IVA and CCAdj | 1,951.8 | |||
| 16 | Net dividends (3–21 plus 4–23) | 1,360.8 | |||
| 17 | Undistributed corporate profits with IVA and CCAdj (6–12) | 591.0 | |||
| 18 | Uses of private enterprise income | 8,478.8 | 24 | Sources of private enterprise income | 8,478.8 |
| Account 3. Personal Income and Outlay Account | |||||
|---|---|---|---|---|---|
| Line | Line | ||||
| 1 | Personal current taxes (4–14) | 2,202.9 | 10 | Compensation of employees | 11,432.4 |
| 2 | Personal outlays | 15,117.4 | 11 | Wages and salaries | 9,309.3 |
| 3 | Personal consumption expenditures (1–15) | 14,544.6 | 12 | Domestic (1–3) | 9,302.6 |
| 4 | Personal interest payments (2–21 and 3–20 and 4–22 and 5–17) | 362.3 | 13 | Rest of the world (5–3) | 6.7 |
| 5 | Personal current transfer payments | 210.5 | 14 | Supplements to wages and salaries (1–5) | 2,123.1 |
| 6 | To government (4–26) | 115.2 | 15 | Employer contributions for employee pension and insurance funds | 1,474.0 |
| 7 | To the rest of the world (net) (5–21 less 5–9) | 95.3 | 16 | Employer contributions for government social insurance | 649.1 |
| 8 | Personal saving (6–11) | 1,231.2 | 17 | Proprietors' income with IVA and CCAdj (2–9) | 1,657.7 |
| 18 | Rental income of persons with CCAdj (2–10) | 787.1 | |||
| 19 | Personal income receipts on assets | 2,967.9 | |||
| 20 | Personal interest income (2–2 plus 3–4 plus 4–7 plus 5–5 less 2–21 less 4–22 less 5–17) | 1,677.4 | |||
| 21 | Personal dividend income (2–16 less 4–23) | 1,290.4 | |||
| 22 | Personal current transfer receipts | 3,125.2 | |||
| 23 | Government social benefits (4–4) | 3,078.0 | |||
| 24 | From business (net) (2–6) | 47.2 | |||
| 25 | Less: Contributions for government social insurance, domestic (4–19) | 1,418.8 | |||
| 9 | Personal taxes, outlays, and saving | 18,551.5 | 26 | Personal income | 18,551.5 |
| Account 4. Government Receipts and Expenditures Account | |||||
|---|---|---|---|---|---|
| Line | Line | ||||
| 1 | Consumption expenditures (1–31) | 2,995.1 | 13 | Current tax receipts | 4,008.8 |
| 2 | Current transfer payments | 3,152.4 | 14 | Personal current taxes (3–1) | 2,202.9 |
| 3 | Government social benefits | 3,102.0 | 15 | Taxes on production and imports (1–6) | 1,491.4 |
| 4 | To persons (3–23) | 3,078.0 | 16 | Taxes on corporate income (2–13) | 286.8 |
| 5 | To the rest of the world (5–22) | 24.0 | 17 | Taxes from the rest of the world (5–10) | 27.7 |
| 6 | Other current transfer payments to the rest of the world (5–22) | 50.4 | 18 | Contributions for government social insurance | 1,424.0 |
| 7 | Interest payments (2–21 and 3–20 and 4–22 and 5–17) | 879.4 | 19 | From persons (3–25) | 1,418.8 |
| 8 | Subsidies (1–7) | 73.9 | 20 | From the rest of the world (5–10) | 5.2 |
| 9 | Net government saving (6–13) | −1,254.7 | 21 | Income receipts on assets | 208.1 |
| 10 | Federal | −1,047.0 | 22 | Interest and miscellaneous receipts (2–2 and 3–4 and 4–7 and 5–5) | 137.7 |
| 11 | State and local | −207.7 | 23 | Dividends (2–16 less 3–21) | 70.4 |
| 24 | Current transfer receipts | 212.7 | |||
| 25 | From business (net) (2–7) | 89.1 | |||
| 26 | From persons (3–6) | 115.2 | |||
| 27 | From the rest of the world (5–10) | 8.5 | |||
| 28 | Current surplus of government enterprises (1–10) | −7.6 | |||
| 12 | Government current expenditures and net saving | 5,846.0 | 29 | Government current receipts | 5,846.0 |
| Account 5. Foreign Transactions Current Account | |||||
|---|---|---|---|---|---|
| Line | Line | ||||
| 1 | Exports of goods and services (1–29) | 2,514.8 | 13 | Imports of goods and services (1–30) | 3,125.2 |
| 2 | Income receipts from the rest of the world | 1,169.8 | 14 | Income payments to the rest of the world | 900.2 |
| 3 | Wage and salary receipts (3–13) | 6.7 | 15 | Wage and salary payments (1–4) | 18.8 |
| 4 | Income receipts on assets | 1,163.1 | 16 | Income payments on assets | 881.4 |
| 5 | Interest (2–21 and 3–20 and 4–22) | 291.9 | 17 | Interest (2–2 and 3–4 and 4–7) | 515.7 |
| 6 | Dividends (2–22) | 683.3 | 18 | Dividends (2–3) | 218.3 |
| 7 | Reinvested earnings on U.S. direct investment abroad (2–23) | 187.9 | 19 | Reinvested earnings on foreign direct investment in the United States (2–4) | 147.5 |
| 8 | Current taxes, contributions for government social insurance, and transfer receipts from the rest of the world | 147.2 | 20 | Current taxes and transfer payments to the rest of the world | 309.1 |
| 9 | To persons (3–7) | 7.6 | 21 | From persons (3–7) | 102.9 |
| 10 | To government (4–17 plus 4–20 plus 4–27) | 41.3 | 22 | From government (4–5 plus 4–6) | 74.4 |
| 11 | To business (2–8) | 98.2 | 23 | From business (2–8 and 2–14) | 131.8 |
| 24 | Balance on current account, national income and product accounts (7–1) | −502.8 | |||
| 12 | Current receipts from the rest of the world | 3,831.8 | 25 | Current payments to the rest of the world and balance on current account, NIPAs | 3,831.8 |
| Account 6. Domestic Capital Account | |||||
|---|---|---|---|---|---|
| Line | Line | ||||
| 1 | Gross domestic investment | 4,504.0 | 10 | Net saving | 567.5 |
| 2 | Private fixed investment (1–21) | 3,702.1 | 11 | Personal saving (3–8) | 1,231.2 |
| 3 | Government fixed investment (1–31) | 752.8 | 12 | Undistributed corporate profits with IVA and CCAdj (2–17) | 591.0 |
| 4 | Change in private inventories (1–27) | 49.1 | 13 | Net government saving (4–9) | −1,254.7 |
| 5 | Capital account transactions (net) | 6.7 | 14 | Plus: Consumption of fixed capital (1–11) | 3,420.9 |
| 6 | Transfer payments for catastrophic losses (net) (7–3) | 6.6 | 15 | Private | 2,832.7 |
| 7 | Other capital account transactions (7–4) | 0.1 | 16 | Government | 588.3 |
| 8 | Net lending or net borrowing (−), national income and product accounts (7–5) | −509.5 | 17 | General government | 508.1 |
| 18 | Government enterprises | 80.1 | |||
| 19 | Equals: Gross saving | 3,988.4 | |||
| 20 | Statistical discrepancy (1–13) | 12.8 | |||
| 9 | Gross domestic investment, capital account transactions (net), and net lending, NIPAs | 4,001.2 | 21 | Gross saving and statistical discrepancy | 4,001.2 |
| Account 7. Foreign Transactions Capital Account | |||||
|---|---|---|---|---|---|
| Line | Line | ||||
| 2 | Capital account transactions (net) (6–5) | 6.7 | |||
| 3 | Transfer payments for catastrophic losses (net) (6–6) | 6.6 | |||
| 4 | Other capital account transactions (6–7) | 0.1 | |||
| 5 | Net lending or net borrowing (−), national income and product accounts (6–8) | −509.5 | |||
| 1 | Balance on current account, NIPAs (5–24) | −502.8 | 6 | Capital account transactions (net) and net lending, NIPAs (6–5) | −502.8 |
- CCAdj
- Capital consumption adjustment
- IVA
- Inventory valuation adjustment
- NIPAs
- National Income and Product Accounts
Note. The seven summary accounts constitute a double-entry accounting system in which each of the entries in a summary account appears again in that account or in one of the other summary accounts. The numbers in parentheses indicate these “counterentries.” In some cases, an entry may be equal to another entry in the summary accounts. For example, supplements to wages and salaries appears in account 1, line 5 and in account 3, line 14. In other cases, an entry may be equal to a combination of other entries (or of parts of other entries). For example, for private enterprise interest payments (account 2, line 2), the counterentry includes parts of private enterprise interest receipts (account 2, line 21), of personal interest income (account 3, line 20), of government interest receipts (account 4, line 22), and of interest payments to the rest of the world (account 5, line 17).
| 2015 | 2016 | 2017 | 2018 | 2019 | Seasonally adjusted at annual rates | ||||||
|---|---|---|---|---|---|---|---|---|---|---|---|
| 2019 | 2020 | ||||||||||
| Q1 | Q2 | Q3 | Q4 | Q1 | |||||||
| Production in the United States: | |||||||||||
| 1 | Gross domestic product (GDP) | 3.1 | 1.7 | 2.3 | 3.0 | 2.2 | 2.9 | 1.5 | 2.6 | 2.4 | −5.0 |
| 2 | Gross domestic income (GDI) | 2.7 | 0.9 | 2.5 | 2.6 | 1.8 | 2.2 | 1.2 | 0.8 | 3.3 | −2.5 |
| 3 | Average of GDP and GDI1 | 2.9 | 1.3 | 2.4 | 2.8 | 2.0 | 2.6 | 1.3 | 1.7 | 2.8 | −3.7 |
| 4 | Net domestic product2 | 3.1 | 1.5 | 2.3 | 3.0 | 2.0 | 2.9 | 1.2 | 2.5 | 2.2 | −6.4 |
| 5 | Net domestic income2 | 2.7 | 0.6 | 2.5 | 2.6 | 1.6 | 2.0 | 0.8 | 0.4 | 3.4 | −3.4 |
| Production by labor and capital supplied by U.S. residents: | |||||||||||
| 6 | Gross national product | 2.9 | 1.7 | 2.6 | 2.9 | 2.0 | 2.4 | 1.9 | 2.7 | 2.3 | −5.6 |
| 7 | Gross national income | 2.6 | 0.9 | 2.8 | 2.5 | 1.7 | 1.7 | 1.6 | 1.0 | 3.3 | −3.1 |
| 8 | Net national product2 | 3.0 | 1.6 | 2.6 | 2.9 | 1.8 | 2.2 | 1.7 | 2.6 | 2.2 | −7.1 |
| Final expenditures by U.S. residents: | |||||||||||
| 9 | Gross domestic purchases | 3.7 | 1.9 | 2.5 | 3.2 | 2.3 | 2.3 | 2.2 | 2.5 | 0.8 | −5.9 |
| 10 | Final sales to domestic purchasers3 | 3.5 | 2.4 | 2.5 | 3.0 | 2.3 | 2.1 | 3.2 | 2.6 | 1.6 | −4.6 |
| 11 | Final sales to private domestic purchasers4 | 3.8 | 2.6 | 2.9 | 3.2 | 2.3 | 2.0 | 2.8 | 2.7 | 1.5 | −5.8 |
| Purchasing power of income:5 | |||||||||||
| 12 | Command-basis gross domestic product | 3.8 | 2.0 | 2.3 | 3.1 | 2.4 | 2.9 | 1.9 | 2.7 | 2.5 | −4.8 |
| 13 | Command-basis net domestic product2 | 4.0 | 1.9 | 2.3 | 3.1 | 2.2 | 2.9 | 1.7 | 2.6 | 2.4 | −6.2 |
| 14 | Command-basis gross national product | 3.6 | 2.1 | 2.6 | 2.9 | 2.2 | 2.4 | 2.3 | 2.8 | 2.5 | −5.4 |
| 15 | Command-basis net national product2 | 3.8 | 2.0 | 2.6 | 3.0 | 2.1 | 2.2 | 2.2 | 2.8 | 2.4 | −6.9 |
| After-tax income received by the personal sector: | |||||||||||
| 16 | Disposable personal income | 4.2 | 2.0 | 3.1 | 3.6 | 2.2 | 3.3 | −1.0 | 2.1 | 1.9 | 2.6 |
- The arithmetic average of gross domestic product and of gross domestic income, deflated by the implicit price deflator for GDP.
- In this table, the net measures are the corresponding gross measures excluding the depreciation of fixed assets as measured by the consumption of fixed capital.
- Gross domestic purchases excluding change in private inventories.
- Final sales to domestic purchasers less government consumption expenditures and gross investment.
- The command-basis estimates (lines 12–15) measure the purchasing power of the income generated by the sale of goods and services produced; they reflect gains or losses in real income resulting from changes in the terms of trade for exports and imports. For more detail on the command-basis measures, see NIPA table 1.8.3 and table 1.8.6.
| 2015 | 2016 | 2017 | 2018 | 2019 | Seasonally adjusted at annual rates | ||||||
|---|---|---|---|---|---|---|---|---|---|---|---|
| 2019 | 2020 | ||||||||||
| Q1 | Q2 | Q3 | Q4 | Q1 | |||||||
| Production in the United States: | |||||||||||
| 1 | Gross domestic product (GDP) | 17,432.2 | 17,730.5 | 18,144.1 | 18,687.8 | 19,091.7 | 18,950.3 | 19,020.6 | 19,141.7 | 19,254.0 | 19,010.8 |
| 2 | Gross domestic income (GDI) | 17,659.0 | 17,817.7 | 18,266.1 | 18,740.4 | 19,080.2 | 18,979.5 | 19,036.1 | 19,075.1 | 19,230.7 | 19,111.2 |
| 3 | Average of GDP and GDI1 | 17,545.6 | 17,774.1 | 18,205.1 | 18,714.1 | 19,085.9 | 18,964.9 | 19,028.3 | 19,108.4 | 19,242.4 | 19,061.0 |
| 4 | Net domestic product2 | 14,633.0 | 14,858.4 | 15,200.0 | 15,661.5 | 15,971.8 | 15,866.7 | 15,912.6 | 16,009.6 | 16,098.4 | 15,835.0 |
| 5 | Net domestic income2 | 14,859.6 | 14,945.3 | 15,321.6 | 15,713.8 | 15,960.4 | 15,895.8 | 15,928.0 | 15,943.3 | 16,075.3 | 15,934.9 |
| Production by labor and capital supplied by U.S. residents: | |||||||||||
| 6 | Gross national product | 17,647.6 | 17,955.4 | 18,421.0 | 18,951.9 | 19,338.4 | 19,177.9 | 19,269.0 | 19,397.0 | 19,509.6 | 19,232.1 |
| 7 | Gross national income | 17,874.5 | 18,042.7 | 18,543.1 | 19,004.5 | 19,326.9 | 19,207.1 | 19,284.5 | 19,330.3 | 19,486.4 | 19,332.5 |
| 8 | Net national product2 | 14,848.5 | 15,083.3 | 15,476.8 | 15,925.5 | 16,218.6 | 16,094.4 | 16,161.0 | 16,264.8 | 16,354.0 | 16,056.3 |
| Final expenditures by U.S. residents: | |||||||||||
| 9 | Gross domestic purchases | 18,141.1 | 18,480.6 | 18,939.0 | 19,537.1 | 19,981.0 | 19,827.8 | 19,937.4 | 20,059.1 | 20,099.6 | 19,797.8 |
| 10 | Final sales to domestic purchasers3 | 17,998.6 | 18,437.9 | 18,903.0 | 19,463.5 | 19,910.9 | 19,710.2 | 19,866.8 | 19,993.1 | 20,073.6 | 19,838.5 |
| 11 | Final sales to private domestic purchasers4 | 14,913.2 | 15,296.6 | 15,734.3 | 16,238.2 | 16,611.7 | 16,455.1 | 16,571.1 | 16,680.0 | 16,740.6 | 16,493.4 |
| Purchasing power of income:5 | |||||||||||
| 12 | Command-basis gross domestic product | 17,636.8 | 17,993.8 | 18,416.2 | 18,979.3 | 19,426.7 | 19,261.7 | 19,353.7 | 19,483.5 | 19,605.6 | 19,367.9 |
| 13 | Command-basis net domestic product2 | 14,837.2 | 15,121.5 | 15,472.0 | 15,953.3 | 16,306.6 | 16,178.1 | 16,245.5 | 16,351.0 | 16,449.7 | 16,190.6 |
| 14 | Command-basis gross national product | 17,849.9 | 18,216.5 | 18,691.6 | 19,241.5 | 19,671.1 | 19,486.5 | 19,599.8 | 19,736.5 | 19,859.0 | 19,586.4 |
| 15 | Command-basis net national product2 | 15,050.5 | 15,344.2 | 15,747.3 | 16,215.2 | 16,550.7 | 16,402.8 | 16,491.3 | 16,603.8 | 16,702.8 | 16,408.7 |
| After-tax income received by the personal sector: | |||||||||||
| 16 | Disposable personal income | 13,377.2 | 13,640.8 | 14,060.5 | 14,566.4 | 14,882.5 | 14,853.5 | 14,817.8 | 14,895.4 | 14,964.5 | 15,059.2 |
- The arithmetic average of gross domestic product and of gross domestic income, deflated by the implicit price deflator for GDP.
- In this table, the net measures are the corresponding gross measures excluding the depreciation of fixed assets as measured by the consumption of fixed capital.
- Gross domestic purchases excluding change in private inventories.
- Final sales to domestic purchasers less government consumption expenditures and gross investment.
- The command-basis estimates (lines 12–15) measure the purchasing power of the income generated by the sale of goods and services produced; they reflect gains or losses in real income resulting from changes in the terms of trade for exports and imports. For more detail on the command-basis measures, see NIPA table 1.8.3 and table 1.8.6.
| 2015 | 2016 | 2017 | 2018 | 2019 | Seasonally adjusted at annual rates | ||||||
|---|---|---|---|---|---|---|---|---|---|---|---|
| 2019 | 2020 | ||||||||||
| Q1 | Q2 | Q3 | Q4 | Q1 | |||||||
| Production in the United States: | |||||||||||
| 1 | Gross domestic product (GDP) | 18,238.3 | 18,745.1 | 19,543.0 | 20,611.9 | 21,433.2 | 21,115.3 | 21,329.9 | 21,540.3 | 21,747.4 | 21,561.1 |
| 2 | Gross domestic income (GDI) | 18,475.6 | 18,837.3 | 19,674.4 | 20,669.9 | 21,420.4 | 21,147.8 | 21,347.2 | 21,465.3 | 21,721.2 | 21,675.0 |
| 3 | Average of GDP and GDI1 | 18,357.0 | 18,791.2 | 19,608.7 | 20,640.9 | 21,426.8 | 21,131.6 | 21,338.6 | 21,502.8 | 21,734.3 | 21,618.1 |
| 4 | Net domestic product2 | 15,326.9 | 15,758.5 | 16,430.1 | 17,346.8 | 18,012.3 | 17,753.7 | 17,925.5 | 18,097.0 | 18,272.9 | 18,052.2 |
| 5 | Net domestic income2 | 15,564.2 | 15,850.7 | 16,561.6 | 17,404.9 | 17,999.5 | 17,786.2 | 17,942.8 | 18,022.0 | 18,246.7 | 18,166.0 |
| Production by labor and capital supplied by U.S. residents: | |||||||||||
| 6 | Gross national product | 18,458.7 | 18,977.1 | 19,835.3 | 20,896.6 | 21,702.9 | 21,361.8 | 21,601.0 | 21,820.1 | 22,028.5 | 21,804.3 |
| 7 | Gross national income | 18,696.0 | 19,069.3 | 19,966.7 | 20,954.6 | 21,690.0 | 21,394.3 | 21,618.4 | 21,745.1 | 22,002.3 | 21,918.1 |
| 8 | Net national product2 | 15,547.3 | 15,990.5 | 16,722.4 | 17,631.6 | 18,281.9 | 18,000.2 | 18,196.6 | 18,376.8 | 18,554.0 | 18,295.3 |
| 9 | National income3 | 15,784.6 | 16,082.7 | 16,853.9 | 17,689.6 | 18,269.1 | 18,032.7 | 18,214.0 | 18,301.8 | 18,527.8 | 18,409.2 |
| Final expenditures by U.S. residents: | |||||||||||
| 10 | Gross domestic purchases | 18,764.9 | 19,257.6 | 20,098.5 | 21,221.3 | 22,043.7 | 21,730.9 | 21,974.6 | 22,172.2 | 22,297.2 | 22,055.4 |
| 11 | Final sales to domestic purchasers4 | 18,628.1 | 19,229.2 | 20,082.2 | 21,163.6 | 21,994.6 | 21,632.2 | 21,921.6 | 22,130.8 | 22,293.7 | 22,107.6 |
| 12 | Final sales to private domestic purchasers5 | 15,397.9 | 15,930.0 | 16,675.2 | 17,568.4 | 18,246.7 | 17,950.8 | 18,183.9 | 18,363.8 | 18,488.4 | 18,273.4 |
| After-tax income received by the personal sector: | |||||||||||
| 13 | Disposable personal income | 13,784.3 | 14,202.8 | 14,901.9 | 15,766.5 | 16,348.6 | 16,196.0 | 16,258.4 | 16,400.5 | 16,539.6 | 16,697.4 |
- The arithmetic average of gross domestic product and of gross domestic income.
- In this table, net measures are the corresponding gross measures excluding the depreciation of fixed assets as measured by the consumption of fixed capital.
- Equals gross national income less the depreciation of fixed assets as measured by the consumption of fixed capital.
- Equals gross domestic purchases less change in private inventories.
- Final sales to domestic purchasers less government consumption expenditures and gross investment.
- As part of the 2018 comprehensive update of the NIPAs, the typical period for revision during annual updates was expanded to 5 years. See Pamela A. Kelly, Stephanie H. McCulla, and David B. Wasshausen, “Improved Estimates of the National Income and Product Accounts: Results of the 2018 Comprehensive Update,” Survey of Current Business 98 (September 2018).
- For more information on the source data used to prepare the successive vintages of the NIPA estimates, see the chapters for each component in BEA's NIPA Handbook: Concepts and Methods of the U.S. National Income and Product Accounts, which is available on BEA's website, and see Alyssa E. Holdren, “Gross Domestic Product and Gross Domestic Income: Revisions and Source Data,” Survey 94 (June 2014).
- Previously, the ITAs did not separately identify exports and imports of these services; the associated interest flows were included in measures of primary income. The newly recorded ITA measures are derived using the reference rate approach that underlies the NIPA measure of these services. For more information on the sources and methods underlying the ITA measures of exports and imports of services furnished without payment by financial intermediaries, see Elye Bliss, “Preview of the 2020 Annual Update of the International Economic Accounts,” Survey of Current Business, 100 (April 2020).
- The NIPAs will incorporate measures of imports of implicit financial services for previous years in a future update. For more information on the NIPA treatment of financial services furnished without payment by financial intermediaries, see Kyle K. Hood, “Measuring the Services of Commercial Banks in the National Income and Product Accounts: Changes in Concepts and Methods in the 2013 Comprehensive Revision,” Survey 83. (February 2013): 8–19.
- International banking facilities are domestically located facilities established by U.S. banks to promote U.S. banking services with nonresidents.
- The quarterly average of the 25th percentile of this rate is used for the deposit-like resale rate, and the quarterly average of the 75th percentile is used as the loan-like repurchase rate.
- TIPS are issued with maturity terms of 5, 10, or 30 years and with semiannual interest payments that are determined by the application of a fixed interest rate, determined at auction, to the inflation-adjusted value of the principal using the BLS' Consumer Price Index. Upon maturity, TIPS holders receive the original principal or the inflation-adjusted principal, whichever is greater. Additional information on TIPS can be found on the TreasuryDirect website.
- For more information on the treatment of TIPS interest in the ITAs, see Elye Bliss, “Preview of the 2020 Annual Update of the International Economic Accounts,” Survey of Current Business, 100 (April 2020).
- See Rudy Telles Jr., Nick Martinez, and Ted Peck, “Annual Update of the U.S. International Transactions Accounts,” Survey 100 (July 2020).