

The statistics discussed in this Regional Quarterly Report include the following: (1) state gross domestic product (GDP) statistics for 2020, (2) state personal income statistics for 2020, and (3) personal consumption expenditures (PCE) by state statistics for 2020.
Real gross domestic product (GDP) growth slowed in all states and the District of Columbia in 2020. The largest declines in GDP were in Hawaii (−10.8 percent), Nevada (−7.4 percent), Connecticut (−6.2 percent), Wyoming (−6.1 percent), and Alaska (−6.0 percent). Real GDP decreased in 48 states and the District of Columbia, with only Utah (0.1 percent) and South Dakota (0.1 percent) experiencing positive growth rates (table A).
Chart 1 displays growth in real GDP for the years 2014 to 2020 in four states (Hawaii, Nevada, Wyoming, and Utah) each alongside real GDP growth in the entire United States. Hawaii, which experienced the largest drop in real GDP in 2020, also experienced a decline in 2019, and lagged behind the rest of the country in 2018. In contrast, real GDP growth in Nevada, which was significantly negative in 2020, exceeded that of the United States from 2015 to 2019, with the 2020 decline thus representing a substantial decrease. Real GDP growth in Wyoming has been more volatile, with declines in 2016 and 2017, increases in 2018 and 2019, and an even larger decline in 2020. Finally, Utah, which showed a small uptick in 2020, has grown at a consistently faster rate than the entire United States from 2014 to 2020.

[Click chart to expand]
The sources of these declines suggest a substantial impact of the COVID-19 pandemic on different state GDP growth rates. Large declines in expenditures on restaurants, accommodation, and gasoline at the onset of the pandemic1 corroborate declines in specific service industries between 2019 and 2020.
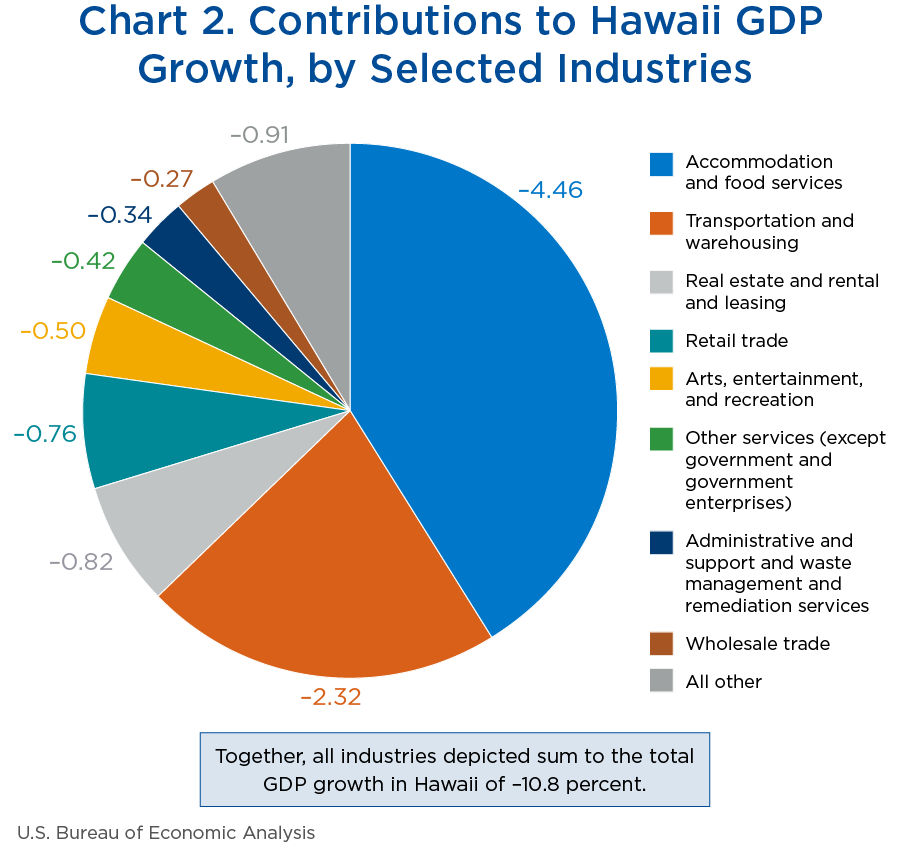
Many of largest declines in GDP at the state level were driven by one or a few industries that are directly linked to pandemic-driven drops in spending at the national level. For example, nearly half of Hawaii's 10.8 percent drop in real GDP was accounted for by accommodation and food services, which contributed a drop of 4.5 percent. Chart 2 shows the top industries contributing to the 2020 decline in Hawaii GDP. This chart suggests that only a few industries drove most of the decline, while the remainder contributed very little to it. Nevada shows a similar pattern, where a drop in accommodation and food services accounted for 4.4 percent of the 7.4 percent decline in real GDP. See chart 3.
[Click chart to expand]

[Click chart to expand]
The contrasting story of Wyoming's drop in GDP is shown in chart 4. In Wyoming, the largest contributors to the decrease in output were transportation and warehousing (including pipeline transportation) and mining, quarrying, and oil and gas extraction. These industries also substantially contributed to the large declines in real GDP in Alaska, Louisiana, and Oklahoma. These declines correlate with a large and sustained reduction in demand for gasoline at the outset of the COVID-19 pandemic. In contrast to Hawaii and Nevada, accommodation and food services accounts for only 0.63 percent of the drop in Wyoming's GDP, as it makes up a substantially smaller part of Wyoming's economy.

[Click chart to expand]
Value added by industry
While the largest declines at the state level correlate with the direct impacts of the COVID-19 pandemic on consumer spending, decelerations or declines at the national level were broadly shared across many industries.
Table B shows real GDP by industry at the national level. In 2020, GDP fell in 43 of the 65 industries and decelerated in 50 of 65 industries. Eight industries experienced declines of above 20 percent: air transportation (−51.4 percent); support activities for mining (−45.2 percent); performing arts, spectator sports, museums, and related activities (−39.6 percent); accommodation (−32.8 percent); amusement, gambling, and recreation industries (−28.9 percent); transit and ground passenger transportation (−27.8 percent); food services and drinking places (−26.0 percent); and other transportation equipment manufacturing (−22.9 percent). In contrast, there were increases in GDP of at least 10 percent in only three industries, with none exceeding 20 percent.
Pandemic-related production declines have been linked to global supply chain disruptions, affecting industries that use imported products (inputs and final goods), and industries that export their output.2 These disruptions could have affected many industries including wholesale and retail trade and manufacturing. However, while there were declines in the output of the wholesale and retail trade industries, declines in GDP were not shared by all manufacturing industries. In 6 of the 19 manufacturing industries in table B, GDP growth accelerated, while in 12 manufacturing industries, GDP fell.
2020 annual update
Each fall, BEA typically revises the preliminary estimates of annual GDP by state released in the spring in order to incorporate the results of the annual updates of the National Income and Product Accounts (NIPAs),3 the GDP by industry statistics, the state personal income statistics, and to incorporate state source data that are more complete and more detailed than those previously available. This year, the annual estimates from 1997 to 2020 were revised. The newly available and revised source data, which became available after last year's annual update, include the following:
- U.S. Census Bureau, Economic Census for 2017 (construction, manufacturing, and mining industries only; service-related industries were incorporated in 2020)
- U.S. Census Bureau Census American Community Survey, 1-year PUMS file (2001–2019)
- U.S. Census Bureau, Annual Survey of State and Local Government Finances for fiscal years 2016–2018 (revised) and 2019 (new)
- Energy Information Administration, gas and electricity consumption for 2019 (revised) and 2020 (new)
- Energy Information Administration, oil, gas production and prices, and coal reports for 2019 (revised) and 2020 (new)
- Federal Deposit Insurance Corporation, branch office deposits for 2020 (new)
- Federal Home Loan Bank Board, income and expenses for 2020 (new)
- Federal Reserve Banks, income and expenses for 2020 (new)
- National Association of Insurance Commissioners, premiums and losses for 2020 (new)
- National Science Foundation, Business Research and Development Survey for 2019 (new)
- U.S. Department of Agriculture, Economic Research Service, farm income and expenses for 2016–2019 (revised) and 2020 (new)
- U.S. Department of Transportation, Bureau of Transportation Statistics, transportation finance, passengers, and freight for 2020 (new)
- U.S. Geological Survey, mineral resources for 2020 (new)
- BEA, compensation of employees, proprietors' income, and rental income from state personal income for 2016–2019 (revised) and 2020 (new)
| Region | Current dollars | Quantity index for real GDP | ||
|---|---|---|---|---|
| 2019 | 2020 | 2019 | 2020 | |
| United States | 4.1 | −2.2 | 2.3 | −3.4 |
| Alabama | 3.2 | −1.8 | 1.3 | −3.2 |
| Alaska | −0.3 | −8.7 | 0.2 | −6.0 |
| Arizona | 5.7 | 1.0 | 3.3 | −1.0 |
| Arkansas | 2.8 | −0.1 | 0.7 | −1.6 |
| California | 5.4 | −1.5 | 3.6 | −2.8 |
| Colorado | 5.6 | −2.5 | 4.2 | −3.0 |
| Connecticut | 2.6 | −4.1 | 0.6 | −6.2 |
| Delaware | 6.3 | −1.6 | 4.1 | −3.4 |
| District of Columbia | 3.3 | 0.1 | 0.9 | −2.1 |
| Florida | 5.5 | −0.9 | 3.0 | −2.8 |
| Georgia | 5.9 | −2.4 | 3.5 | −3.9 |
| Hawaii | 1.7 | −9.7 | −0.9 | −10.8 |
| Idaho | 6.4 | 1.7 | 4.0 | −0.3 |
| Illinois | 2.6 | −3.6 | 0.5 | −5.1 |
| Indiana | 2.0 | −1.5 | 0.4 | −2.5 |
| Iowa | 2.1 | 0.0 | 0.0 | −2.0 |
| Kansas | 2.6 | −0.9 | 0.8 | −2.1 |
| Kentucky | 3.8 | −1.6 | 1.7 | −3.0 |
| Louisiana | −0.5 | −7.5 | −0.1 | −5.8 |
| Maine | 4.5 | 1.2 | 2.2 | −1.1 |
| Maryland | 2.6 | −2.6 | 0.3 | −4.5 |
| Massachusetts | 5.2 | −1.8 | 2.9 | −3.7 |
| Michigan | 2.0 | −3.1 | −0.1 | −4.6 |
| Minnesota | 2.6 | −2.4 | 0.5 | −4.0 |
| Mississippi | 2.1 | −0.8 | 0.4 | −1.8 |
| Missouri | 4.0 | −0.9 | 1.7 | −2.8 |
| Montana | 1.7 | −0.5 | 0.4 | −1.3 |
| Nebraska | 3.5 | 1.6 | 1.2 | −0.5 |
| Nevada | 6.7 | −5.9 | 4.1 | −7.4 |
| New Hampshire | 4.4 | 0.1 | 2.1 | −2.1 |
| New Jersey | 4.2 | −3.3 | 2.1 | −4.6 |
| New Mexico | 4.8 | −3.4 | 4.3 | −2.3 |
| New York | 4.9 | −3.0 | 2.5 | −5.0 |
| North Carolina | 4.5 | −1.0 | 2.1 | −2.9 |
| North Dakota | −0.1 | −7.0 | 0.6 | −3.0 |
| Ohio | 3.9 | −2.3 | 2.0 | −3.5 |
| Oklahoma | 0.6 | −7.7 | 1.7 | −4.9 |
| Oregon | 4.0 | −1.2 | 2.0 | −3.0 |
| Pennsylvania | 3.5 | −3.5 | 1.7 | −4.5 |
| Rhode Island | 3.7 | −1.2 | 1.4 | −3.4 |
| South Carolina | 4.7 | 0.1 | 2.3 | −1.9 |
| South Dakota | 2.9 | 1.6 | 0.4 | 0.1 |
| Tennessee | 4.3 | −1.9 | 2.0 | −3.9 |
| Texas | 3.0 | −4.7 | 3.2 | −2.9 |
| Utah | 6.8 | 1.3 | 4.8 | 0.1 |
| Vermont | 3.3 | −2.0 | 1.0 | −4.2 |
| Virginia | 4.2 | −0.9 | 2.0 | −2.8 |
| Washington | 5.9 | 1.1 | 3.9 | −0.6 |
| West Virginia | 0.1 | −4.2 | −0.8 | −3.9 |
| Wisconsin | 3.8 | −2.0 | 1.5 | −4.0 |
| Wyoming | 1.5 | −8.3 | 1.7 | −6.1 |
| Industry | Percent change | Contribution to percent change | Change (millions of 2012 chained dollars) | |||
|---|---|---|---|---|---|---|
| 2019 | 2020 | 2019 | 2020 | 2019 | 2020 | |
| All industry total | 2.3 | −3.4 | 2.30 | −3.40 | 425,885 | −647,985 |
| Farms | −8.6 | 18.7 | −0.06 | 0.10 | −17,436 | 34,832 |
| Forestry, fishing, and related activities | 2.5 | 0.2 | 0.00 | 0.00 | 855 | 59 |
| Oil and gas extraction | 20.4 | 2.7 | 0.17 | 0.01 | 67,629 | 10,713 |
| Mining (except oil and gas) | 1.9 | −7.1 | 0.01 | −0.02 | 1,186 | −4,578 |
| Support activities for mining | −4.5 | −45.2 | −0.01 | −0.11 | −2,771 | −26,337 |
| Utilities | 1.2 | 4.2 | 0.02 | 0.06 | 3,446 | 12,006 |
| Construction | 1.4 | −3.6 | 0.06 | −0.15 | 9,057 | −24,307 |
| Wood product manufacturing | 7.0 | −3.6 | 0.01 | −0.01 | 1,941 | −1,070 |
| Nonmetallic mineral product manufacturing | 1.2 | −0.6 | 0.00 | 0.00 | 600 | −317 |
| Primary metal manufacturing | 9.5 | 14.2 | 0.03 | 0.04 | 6,903 | 11,353 |
| Fabricated metal product manufacturing | −0.5 | −12.9 | 0.00 | −0.10 | −755 | −18,267 |
| Machinery manufacturing | −1.4 | −8.8 | −0.01 | −0.07 | −1,978 | −12,310 |
| Computer and electronic product manufacturing | 1.3 | 3.0 | 0.02 | 0.04 | 4,447 | 10,273 |
| Electrical equipment, appliance, and component manufacturing | −4.0 | −2.3 | −0.01 | −0.01 | −2,475 | −1,333 |
| Motor vehicles, bodies and trailers, and parts manufacturing | 1.1 | −2.2 | 0.01 | −0.02 | 1,486 | −3,149 |
| Other transportation equipment manufacturing | 2.4 | −22.9 | 0.02 | −0.18 | 3,547 | −34,040 |
| Furniture and related product manufacturing | −2.0 | −6.1 | 0.00 | −0.01 | −575 | −1,740 |
| Miscellaneous manufacturing | −2.3 | 0.7 | −0.01 | 0.00 | −2,058 | 593 |
| Food and beverage and tobacco product manufacturing | 2.3 | −2.5 | 0.03 | −0.03 | 5,662 | −6,366 |
| Textile mills and textile product mills | −0.5 | −9.0 | 0.00 | −0.01 | −85 | −1,454 |
| Apparel, leather, and allied product manufacturing | −2.7 | 5.2 | 0.00 | 0.00 | −225 | 424 |
| Paper manufacturing | 1.1 | 6.0 | 0.00 | 0.02 | 580 | 3,113 |
| Printing and related support activities | −3.3 | −6.0 | −0.01 | −0.01 | −1,279 | −2,260 |
| Petroleum and coal products manufacturing | 8.8 | 0.7 | 0.07 | 0.00 | 19,822 | 1,802 |
| Chemical manufacturing | 3.2 | 1.5 | 0.06 | 0.03 | 9,964 | 4,965 |
| Plastics and rubber products manufacturing | −1.1 | −3.9 | 0.00 | −0.02 | −887 | −3,030 |
| Wholesale trade | −0.5 | −1.9 | −0.03 | −0.11 | −5,191 | −20,776 |
| Retail trade | 2.5 | −2.9 | 0.14 | −0.16 | 27,355 | −32,405 |
| Air transportation | 1.6 | −51.4 | 0.01 | −0.32 | 1,945 | −62,971 |
| Rail transportation | −9.0 | −15.3 | −0.02 | −0.03 | −3,548 | −5,474 |
| Water transportation | −2.0 | 5.2 | 0.00 | 0.00 | −186 | 477 |
| Truck transportation | −0.5 | −3.4 | 0.00 | −0.03 | −646 | −4,646 |
| Transit and ground passenger transportation | 14.0 | −27.8 | 0.03 | −0.07 | 6,089 | −13,838 |
| Pipeline transportation | −10.8 | −9.0 | −0.02 | −0.02 | −3,989 | −2,996 |
| Other transportation and support activities | 4.0 | 3.6 | 0.02 | 0.02 | 4,135 | 3,867 |
| Warehousing and storage | 11.2 | 6.2 | 0.04 | 0.02 | 7,731 | 4,781 |
| Publishing industries (except internet) | 7.4 | 9.6 | 0.10 | 0.13 | 21,413 | 29,795 |
| Motion picture and sound recording industries | 1.9 | −17.1 | 0.01 | −0.07 | 1,655 | −15,304 |
| Broadcasting (except internet) and telecommunications | 2.3 | −0.6 | 0.05 | −0.01 | 12,020 | −3,500 |
| Data processing, hosting, and other information services | 17.1 | 10.2 | 0.20 | 0.14 | 45,428 | 31,574 |
| Monetary authorities—central bank, credit intermediation, and related services | 0.4 | 7.3 | 0.01 | 0.25 | 1,824 | 31,733 |
| Securities, commodity contracts, and other financial investments and related activities | 3.0 | −1.7 | 0.05 | −0.03 | 6,442 | −3,767 |
| Insurance carriers and related activities | 3.6 | 0.7 | 0.10 | 0.02 | 19,552 | 3,975 |
| Funds, trusts, and other financial vehicles | −20.1 | −2.6 | −0.03 | 0.00 | −5,186 | −529 |
| Real estate | 1.4 | −0.4 | 0.16 | −0.05 | 28,601 | −9,035 |
| Rental and leasing services and lessors of nonfinancial intangible assets | 9.5 | −10.0 | 0.11 | −0.12 | 23,623 | −27,118 |
| Legal services | 0.9 | −6.1 | 0.01 | −0.08 | 1,866 | −13,299 |
| Computer systems design and related services | 5.3 | 0.2 | 0.09 | 0.00 | 20,561 | 642 |
| Miscellaneous professional, scientific, and technical services | 5.0 | −1.5 | 0.23 | −0.07 | 43,590 | −13,320 |
| Management of companies and enterprises | 7.1 | 1.5 | 0.13 | 0.03 | 28,854 | 6,317 |
| Administrative and support services | 3.9 | −5.8 | 0.11 | −0.17 | 20,210 | −30,923 |
| Waste management and remediation services | −0.3 | −5.2 | 0.00 | −0.01 | −130 | −2,427 |
| Educational services | 2.8 | −11.3 | 0.04 | −0.15 | 6,165 | −25,830 |
| Ambulatory health care services | 4.5 | −6.9 | 0.16 | −0.25 | 32,369 | −52,244 |
| Hospitals | 1.0 | −2.5 | 0.02 | −0.06 | 4,244 | −10,751 |
| Nursing and residential care facilities | −0.7 | −6.4 | 0.00 | −0.05 | −867 | −8,334 |
| Social assistance | 4.8 | −7.9 | 0.03 | −0.05 | 5,313 | −9,220 |
| Performing arts, spectator sports, museums, and related activities | 2.9 | −39.6 | 0.02 | −0.27 | 3,437 | −48,718 |
| Amusement, gambling, and recreation industries | 1.7 | −28.9 | 0.01 | −0.13 | 1,381 | −23,498 |
| Accommodation | 2.1 | −32.8 | 0.02 | −0.27 | 3,066 | −48,465 |
| Food services and drinking places | 1.8 | −26.0 | 0.04 | −0.61 | 6,696 | −99,538 |
| Other services (except government and government enterprises) | 0.0 | −12.4 | 0.00 | −0.27 | 24 | −45,866 |
| Federal civilian | 0.5 | 3.3 | 0.01 | 0.08 | 2,312 | 14,186 |
| Military | 0.9 | 2.1 | 0.01 | 0.03 | 2,540 | 6,062 |
| State and local | 0.6 | −2.6 | 0.05 | −0.22 | 8,442 | −39,277 |
Personal income grew in every state and the District of Colombia in 2020, and accelerated in all states except Alaska, Oklahoma, and Wyoming (tables C and E). Personal income growth across states ranged from 10.3 percent in Arizona to 1.7 percent in Wyoming. Substantial growth in personal current transfer receipts was the leading contributor to personal income growth across all states and the District of Columbia.
Personal current transfer receipts were the category affected the most by policy responses to the pandemic. These policies included various increases and extensions of unemployment benefits, an increase in Medicare reimbursement rates, economic income payments, and other programs.4 Personal current transfer receipts increased in all states and the District of Columbia in 2020, with states experiencing a range of growth from 18.2 percent in Alaska to 52.6 percent in Hawaii. For the United States, personal current transfer receipts increased 35.1 percent in 2020 ($1.1 trillion), up from 5.5 percent in 2019. Of the $1.1 trillion increase in personal current transfer receipts, $394.7 billion is attributable to various unemployment insurance programs created in response to the COVID-19 pandemic, and $274.7 billion to economic impact payments. In all, the various components of transfer payments associated with the policy response to the COVID-19 pandemic constitute $819.0 billion of the $1.1 trillion increase in transfer payments.
Property income (dividends, interest, and rent) decreased 1.1 percent in 2020, down from a 3.1 percent increase in 2019. Dividend, interest, and rent also declined in 47 states and the District of Columbia.
Compensation of employees, the largest component of personal income, grew 1.0 percent in the United States in 2020, down from 4.5 percent in 2019. The percent change in compensation across states ranged from 6.5 percent in Idaho to −5.7 percent in Hawaii. In terms of growth rates, compensation of employees decelerated in all states except Idaho and in the District of Columbia in 2020, and showed a decline in 15 states.
Many of the state-level changes in compensation correspond with the effects of the COVID-19 pandemic on businesses, and on the policy response to the COVID-19 pandemic. In April 2020 (immediately following the March 2020 pandemic declaration), the unemployment rate peaked at 14.8 percent, up from 3.5 percent in February, indicating substantial job losses.5 These job losses were concentrated in certain industries, leading to different impacts on compensation of employees across industries. Because state industry compositions vary, this effected variation in state-level employee compensation growth rates.
Table D shows the annual percentage change in compensation by industry in the entire United States for the years 2017 to 2020. These data reveal historically large drops in compensation in 2020 for mining industries (oil and gas extraction, mining (except oil and gas), and support activities for mining); many durable goods manufacturing industries (fabricated metal product manufacturing; machinery manufacturing; motor vehicles, bodies and trailers, and parts manufacturing; other transportation equipment manufacturing; and furniture and related product manufacturing); certain transportation industries (air transportation and pipeline transportation showing the largest declines); motion picture and sound recording industries; arts, entertainment, and recreation industries (performing arts, spectator sports, and related industries; museums, historical sites, and similar institutions; and amusement, gambling, and recreation industries); and accommodation and foods services industries. In Wyoming, which experienced the smallest percent increase in personal income in 2020, compensation is heavily concentrated in mining, quarrying, and oil and gas extraction (12.1 percent of total compensation in 2019), pipeline transportation (5.5 percent of total compensation in 2019), and the accommodation industry (2.5 percent of total compensation in 2019). In contrast, Arizona experienced the largest percent increase in personal income in 2020, and its compensation is not concentrated in mining, quarrying, and oil and gas extraction (0.7 percent of total compensation in 2019), pipeline transportation (0.0 percent of total compensation in 2019), or accommodation (0.9 percent of total compensation in 2019). Large declines in compensation in these major industries in Wyoming thus contributed to a drop in compensation of 3.2 percent in 2020, while compensation in Arizona increased 4.7 percent over the same period.
Earnings are comprised of compensation (wages and salaries and supplements to wages and salaries) and proprietors' income. Proprietors' income, which represents the income earned from current production by unincorporated businesses that is received by persons, grew 3.7 percent for the United States in 2020, up from 1.4 percent growth in 2019. U.S. farm proprietors' income rose 97.6 percent ($39.2 billion) in 2020 after increasing 8.7 percent ($3.2 billion) in 2019. $20.4 billion of the $39.2 billion increase in U.S. farm proprietors' income is attributable to the Coronavirus Food Assistance Program6 and $4.4 billion is attributable to Paycheck Protection Program (PPP) loans to businesses.7 U.S. nonfarm proprietors' income grew 1.2 percent in 2020 ($19.4 billion), the same rate as in 2019. However, $140.9 billion of the change in U.S. nonfarm proprietors' income in 2020 was associated with PPP loans to businesses. Without PPP loans, proprietors' income decreased by $121.5 billion.
Industry-level compensation changes discussed above explain some variation in earnings. However, the proprietors' income component also explains some variation. As noted above, proprietors' income was impacted by two coronavirus assistance programs: The Coronavirus Food Assistance Program and PPP loans to businesses. Charts 5–7 show a breakdown of earnings in 2019 and 2020 for the entire United States, and for the states of Arizona and Wyoming. Panel A shows the two components of earnings: Compensation (wages, salaries, and supplements to wages and salaries) and proprietors' income. Panel B shows a further decomposition of proprietors' income into the contributions from the Coronavirus Food Assistance Program, from PPP loans to businesses, and from all other sources.
For the entire United States (chart 5), there was a small increase in compensation and in proprietors' income between 2019 and 2020. The small increase in proprietors' income can be explained by income from PPP loans of $145.3 billion and by $20.4 billion from the Coronavirus Food Assistance Program; netting out these sources, proprietors' income decreased by $107.1 billion. The effects of these two programs compare with an increase in personal current transfer receipts of $1.1 trillion.

[Click chart to expand]
Arizona, which saw the largest increase in personal income among all states, is shown in chart 6. In Arizona, compensation increased by $9.6 billion, while proprietors' income increased $2.1 billion. Panel B shows that PPP loans contributed an increase of $3.0 billion to proprietors' income, while the Coronavirus Food Assistance Program added $0.1 billion; netting out these sources, Arizona's proprietors' income decreased $1.1 billion. These compare to an increase in personal current transfer receipts of $24.2 billion.

[Click chart to expand]
Chart 7 shows the same breakdown of earnings for Wyoming. The most noticeable contrast to Arizona is the decrease in compensation of $0.6 billion. Proprietors' income increased by $0.1 billion. Panel B shows that PPP loans contributed an increase of $0.2 billion to proprietors' income, while the Coronavirus Food Assistance Program added $0.1 billion; netting out these sources, Wyoming's proprietors' income decreased $0.2 billion. These compare to an increase in personal current transfer receipts of $1.4 billion.

[Click chart to expand]
Arizona and Wyoming are examples of a larger trend across states and the District of Columbia. Compensation increased in some states and decreased in others based on industry composition, but generally slowed from 2019. Netting out COVID-19 programs, proprietors' income also decreased from 2019, but this slowdown was more than made up for by the Coronavirus Food Assistance Program and the Paycheck Protection Program, each of which had a positive but relatively small effect on income in most states and the District of Columbia. In contrast, the increase in current transfer receipts was large relative to income: The increase in current transfer receipts between 2019 and 2020 in Wyoming was equal to about 4 percent of 2019 personal income, while in Arizona, it equaled more than 7 percent of 2019 personal income. In addition, because many of the various programs enacted in the wake of the COVID-19 pandemic did not link payments to changes in compensation or other sources of income, they did not serve to offset losses in income from these other sources. Thus, a significant proportion of the variation in changes in personal income across states and the District of Columbia in 2020 is attributable to a combination of industry-specific decreases in earnings and variation in changes in personal current transfer receipts.
| Region | 2019 | 2020 | ||||||||||
|---|---|---|---|---|---|---|---|---|---|---|---|---|
| Personal income | Compensation of employees | Proprietors' income with IVA and CCAdj | Dividends, interest, and rent | Personal current transfer receipts | Contributions for government social insurance | Personal income | Compensation of employees | Proprietors' income with IVA and CCAdj | Dividends, interest, and rent | Personal current transfer receipts | Contributions for government social insurance | |
| United States | 4.1 | 4.5 | 1.4 | 3.1 | 5.5 | 4.5 | 6.6 | 1.0 | 3.7 | −1.0 | 35.1 | 2.7 |
| Alabama | 4.3 | 4.4 | −1.2 | 4.2 | 5.2 | 2.6 | 5.9 | 2.2 | 1.5 | −1.4 | 23.1 | 5.5 |
| Alaska | 2.7 | 2.9 | −4.5 | 2.7 | 5.4 | 3.2 | 2.5 | −1.1 | 4.8 | −1.9 | 18.2 | −0.2 |
| Arizona | 5.8 | 5.8 | 8.0 | 4.0 | 7.1 | 6.7 | 10.3 | 4.7 | 8.9 | 1.0 | 36.2 | 6.8 |
| Arkansas | 3.4 | 3.6 | −2.4 | 2.5 | 5.4 | 3.8 | 5.8 | 2.5 | 2.4 | −1.6 | 22.4 | 7.3 |
| California | 4.6 | 5.4 | 1.0 | 3.0 | 6.5 | 5.8 | 8.6 | 2.8 | 2.1 | −0.5 | 47.3 | 2.8 |
| Colorado | 5.6 | 6.8 | 2.7 | 4.0 | 5.3 | 6.4 | 5.7 | 2.1 | 2.9 | −1.0 | 35.0 | 2.9 |
| Connecticut | 2.3 | 2.4 | −4.0 | 1.9 | 2.4 | 2.8 | 3.5 | −0.1 | −0.7 | −2.2 | 32.2 | 0.8 |
| Delaware | 2.4 | 3.9 | −17.1 | 1.3 | 6.0 | 3.0 | 5.4 | 0.4 | −2.5 | −1.1 | 24.4 | 3.5 |
| District of Columbia | 1.2 | 2.9 | −14.6 | −0.8 | 6.0 | 2.3 | 7.8 | 1.6 | 7.9 | −2.1 | 47.7 | 1.0 |
| Florida | 4.8 | 5.4 | 1.5 | 4.1 | 6.0 | 6.2 | 6.2 | 1.6 | 11.1 | −0.2 | 26.3 | 4.7 |
| Georgia | 5.1 | 4.7 | 9.7 | 4.0 | 5.2 | 5.1 | 7.0 | 1.6 | 3.5 | −1.3 | 37.4 | 3.7 |
| Hawaii | 3.1 | 2.6 | 6.3 | 2.9 | 4.3 | 4.7 | 5.1 | −5.7 | 1.3 | −1.1 | 52.6 | −4.3 |
| Idaho | 6.7 | 5.5 | 16.5 | 4.1 | 7.5 | 5.4 | 8.9 | 6.5 | 8.6 | −0.1 | 27.5 | 10.0 |
| Illinois | 2.8 | 2.7 | 3.6 | 2.4 | 4.0 | 3.5 | 5.8 | −0.5 | 7.9 | −1.7 | 40.2 | 1.0 |
| Indiana | 4.1 | 3.0 | 8.4 | 3.0 | 5.9 | 4.7 | 6.4 | 0.9 | 7.1 | −1.2 | 28.9 | 4.8 |
| Iowa | 2.3 | 2.5 | −7.3 | 3.1 | 5.9 | 3.6 | 6.0 | 1.6 | 5.2 | −1.7 | 28.1 | 4.6 |
| Kansas | 4.0 | 3.6 | 5.6 | 2.9 | 6.0 | 4.2 | 5.5 | 1.5 | 6.6 | −1.7 | 29.0 | 3.8 |
| Kentucky | 4.2 | 3.7 | 9.5 | 3.0 | 4.2 | 2.0 | 8.0 | 0.9 | 5.4 | −0.6 | 32.5 | 5.7 |
| Louisiana | 3.2 | 2.1 | 4.5 | 3.4 | 4.9 | 2.0 | 6.4 | −2.3 | 12.4 | −1.8 | 32.2 | 2.3 |
| Maine | 4.2 | 4.7 | 3.7 | 1.7 | 5.1 | 4.3 | 7.9 | 2.9 | 3.4 | −1.0 | 29.3 | 5.0 |
| Maryland | 2.5 | 3.4 | −11.1 | 2.2 | 4.8 | 3.2 | 6.1 | 1.5 | 4.6 | −1.0 | 35.3 | 1.4 |
| Massachusetts | 4.2 | 5.0 | 7.3 | 2.7 | 2.8 | 5.7 | 6.8 | 0.7 | −1.0 | −0.9 | 46.1 | 0.7 |
| Michigan | 3.3 | 2.5 | 3.5 | 3.0 | 5.6 | 2.9 | 7.9 | −2.0 | 7.8 | −0.7 | 41.3 | −0.3 |
| Minnesota | 3.1 | 3.4 | −2.5 | 3.1 | 4.7 | 3.8 | 6.5 | 0.0 | 20.7 | −1.8 | 34.2 | 1.9 |
| Mississippi | 3.1 | 2.9 | 2.9 | 1.8 | 4.6 | 2.8 | 7.4 | 1.8 | 2.5 | −1.6 | 26.4 | 5.6 |
| Missouri | 3.8 | 4.0 | 3.9 | 3.2 | 4.3 | 3.8 | 5.8 | 1.0 | 9.5 | −1.2 | 25.3 | 4.8 |
| Montana | 5.1 | 3.9 | 11.0 | 4.1 | 6.2 | 2.6 | 7.5 | 3.8 | 9.6 | −1.1 | 29.2 | 7.2 |
| Nebraska | 3.2 | 3.6 | −2.5 | 3.3 | 5.5 | 3.7 | 6.8 | 2.3 | 18.4 | −1.3 | 26.9 | 5.8 |
| Nevada | 6.1 | 5.6 | 17.2 | 4.1 | 6.9 | 7.8 | 6.1 | −2.9 | −1.3 | −1.2 | 48.0 | 0.9 |
| New Hampshire | 4.4 | 4.1 | 9.9 | 1.4 | 4.0 | 4.9 | 5.6 | 2.9 | −2.2 | −0.3 | 32.6 | 3.4 |
| New Jersey | 3.7 | 3.8 | 2.1 | 1.8 | 4.4 | 3.7 | 5.4 | 0.2 | 3.0 | −0.7 | 38.5 | 1.0 |
| New Mexico | 4.6 | 4.9 | 9.9 | 2.1 | 4.4 | 4.9 | 7.8 | −0.1 | 7.1 | −2.0 | 32.9 | 2.7 |
| New York | 3.4 | 4.3 | −3.9 | 2.6 | 7.2 | 4.0 | 5.8 | −1.2 | −1.5 | −1.4 | 40.3 | −0.7 |
| North Carolina | 5.3 | 5.1 | 8.8 | 4.1 | 5.5 | 5.4 | 6.5 | 2.6 | 2.1 | −0.3 | 27.1 | 4.8 |
| North Dakota | 3.7 | 4.1 | 3.0 | 1.9 | 5.6 | 2.8 | 6.0 | −3.5 | 37.3 | −4.6 | 34.9 | 0.9 |
| Ohio | 3.1 | 3.5 | −2.9 | 2.9 | 4.6 | 3.9 | 6.8 | 0.4 | 9.0 | −1.5 | 33.0 | 2.6 |
| Oklahoma | 4.8 | 3.7 | 9.1 | 3.2 | 6.6 | 3.8 | 3.8 | −0.8 | −1.4 | −2.4 | 26.2 | 2.2 |
| Oregon | 4.6 | 4.9 | 1.8 | 3.9 | 5.7 | 4.9 | 8.0 | 2.2 | 7.1 | −0.1 | 33.4 | 3.4 |
| Pennsylvania | 2.9 | 4.1 | −4.4 | 2.7 | 3.8 | 3.2 | 7.0 | −0.6 | 1.0 | −0.6 | 37.2 | 0.3 |
| Rhode Island | 4.4 | 3.1 | 6.8 | 1.9 | 5.0 | 3.3 | 7.3 | 0.5 | 3.7 | −0.7 | 35.1 | 0.9 |
| South Carolina | 5.3 | 5.0 | 6.0 | 5.2 | 6.3 | 5.0 | 6.9 | 0.8 | 6.6 | 1.3 | 25.6 | 2.4 |
| South Dakota | 5.5 | 4.5 | 11.4 | 3.9 | 5.9 | 5.1 | 9.0 | 4.3 | 25.9 | −2.2 | 26.7 | 10.0 |
| Tennessee | 4.6 | 4.1 | 7.4 | 2.5 | 5.9 | 4.3 | 5.0 | 2.2 | −5.8 | −0.8 | 25.3 | 5.5 |
| Texas | 4.1 | 5.6 | −2.5 | 3.2 | 5.4 | 4.5 | 4.8 | 0.4 | −0.2 | −2.0 | 35.2 | 2.5 |
| Utah | 7.5 | 6.7 | 13.7 | 7.2 | 8.2 | 7.1 | 7.8 | 5.9 | 6.6 | 0.9 | 30.6 | 7.6 |
| Vermont | 3.4 | 2.9 | 8.6 | 0.7 | 4.5 | 1.6 | 6.7 | −0.2 | 1.3 | −0.9 | 34.2 | 2.1 |
| Virginia | 3.6 | 4.1 | 7.0 | 1.6 | 5.9 | 4.2 | 5.9 | 2.6 | 3.7 | −1.8 | 33.3 | 3.7 |
| Washington | 5.6 | 6.5 | 1.7 | 3.6 | 6.1 | 4.1 | 7.6 | 3.6 | 8.2 | −0.3 | 34.9 | 4.1 |
| West Virginia | 2.0 | 0.3 | 2.1 | 1.9 | 3.1 | −0.3 | 5.2 | −2.9 | 6.1 | −3.1 | 23.4 | 2.8 |
| Wisconsin | 3.5 | 3.4 | 3.3 | 3.1 | 4.8 | 4.0 | 5.2 | 0.4 | 11.2 | −0.8 | 26.5 | 3.0 |
| Wyoming | 2.1 | 3.9 | −0.1 | −1.1 | 5.1 | 4.2 | 1.7 | −3.2 | 3.2 | −3.4 | 28.5 | −0.5 |
- CCAdj
- Capital consumption adjustment
- IVA
- Inventory valuation adjustment
| Description | 2017 | 2018 | 2019 | 2020 |
|---|---|---|---|---|
| Farm compensation | 6.3 | −7.9 | 0.7 | 1.5 |
| Forestry and logging | −4.3 | 4.2 | −0.8 | 9.3 |
| Fishing, hunting, and trapping | 5.7 | 7.8 | −1.6 | 1.9 |
| Support activities for agriculture and forestry | 4.1 | 5.6 | 4.0 | 10.4 |
| Oil and gas extraction | −13.1 | 1.9 | 3.2 | −8.0 |
| Mining (except oil and gas) | 7.6 | 7.9 | 0.0 | −7.5 |
| Support activities for mining | 22.8 | 19.8 | 1.3 | −31.4 |
| Utilities | 0.2 | 3.6 | 4.1 | 6.6 |
| Construction of buildings | 7.3 | 7.3 | 6.6 | −0.2 |
| Heavy and civil engineering construction | 8.1 | 8.1 | 7.0 | −0.3 |
| Specialty trade contractors | 6.7 | 7.0 | 7.2 | −0.3 |
| Wood product manufacturing | 5.7 | 5.7 | 4.8 | 3.9 |
| Nonmetallic mineral product manufacturing | 5.2 | 4.3 | 3.5 | −0.3 |
| Primary metal manufacturing | 4.5 | 7.0 | 1.0 | −7.7 |
| Fabricated metal product manufacturing | 3.9 | 6.0 | 1.5 | −4.4 |
| Machinery manufacturing | 4.4 | 6.0 | 1.4 | −4.9 |
| Computer and electronic product manufacturing | 5.6 | 4.9 | 1.9 | 5.8 |
| Electrical equipment, appliance, and component manufacturing | 4.3 | 3.2 | 2.0 | 0.3 |
| Motor vehicles, bodies and trailers, and parts manufacturing | 4.1 | 5.9 | 0.8 | −7.8 |
| Other transportation equipment manufacturing | 2.0 | 6.2 | 4.8 | −2.1 |
| Furniture and related product manufacturing | 4.7 | 2.8 | −0.9 | −2.2 |
| Miscellaneous manufacturing | 4.0 | 4.8 | 2.7 | −2.0 |
| Food manufacturing | 5.4 | 3.5 | 2.0 | 5.6 |
| Beverage and tobacco product manufacturing | 5.6 | 3.6 | 4.1 | 2.0 |
| Textile mills | 1.9 | 1.7 | −2.1 | −8.0 |
| Textile product mills | 2.5 | 2.4 | −0.4 | −5.5 |
| Apparel manufacturing | −2.4 | −1.7 | −1.6 | −13.0 |
| Leather and allied product manufacturing | −1.3 | −0.5 | 0.5 | −3.1 |
| Paper manufacturing | 1.4 | 1.4 | 3.5 | 0.0 |
| Printing and related support activities | 0.3 | 1.2 | 0.5 | −7.8 |
| Petroleum and coal products manufacturing | 0.0 | 2.4 | 5.4 | −0.6 |
| Chemical manufacturing | 2.7 | 2.8 | 5.7 | 4.5 |
| Plastics and rubber products manufacturing | 5.0 | 4.6 | 2.7 | 0.5 |
| Wholesale trade | 4.3 | 2.4 | 2.4 | 0.8 |
| Motor vehicle and parts dealers | 2.9 | 3.3 | 5.3 | 0.1 |
| Furniture and home furnishings stores | 3.8 | 4.1 | 3.4 | −3.9 |
| Electronics and appliance stores | 0.0 | 1.6 | 1.2 | −1.3 |
| Building material and garden equipment and supplies dealers | 2.9 | 4.0 | 4.0 | 11.4 |
| Food and beverage stores | 3.2 | 2.5 | 4.6 | 9.5 |
| Health and personal care stores | 2.7 | 2.2 | 2.1 | 0.6 |
| Gasoline stations | 4.3 | 4.7 | 6.7 | 4.6 |
| Clothing and clothing accessories stores | 3.8 | 2.5 | 2.2 | −16.4 |
| Sporting goods, hobby, musical instrument, and book stores | 0.0 | −0.1 | −0.3 | −1.4 |
| General merchandise stores | 1.5 | 2.9 | 1.1 | 4.5 |
| Miscellaneous store retailers | 2.6 | 4.1 | 5.1 | −3.6 |
| Nonstore retailers | 12.9 | 10.9 | 7.2 | 11.7 |
| Air transportation | 7.2 | 4.7 | 4.3 | −6.9 |
| Rail transportation | −0.1 | 5.9 | −0.8 | −3.8 |
| Water transportation | 1.3 | 2.9 | 5.3 | −6.8 |
| Truck transportation | 3.9 | 7.4 | 7.1 | −1.1 |
| Transit and ground passenger transportation | 8.2 | 10.1 | 21.8 | −29.1 |
| Pipeline transportation | 5.4 | 2.0 | 10.0 | −0.5 |
| Scenic and sightseeing transportation | 4.1 | 5.6 | 7.1 | −38.5 |
| Support activities for transportation | 5.7 | 8.0 | 11.1 | −3.0 |
| Couriers and messengers | 7.4 | 8.1 | 8.8 | 17.9 |
| Warehousing and storage | 10.6 | 12.4 | 6.9 | 18.5 |
| Publishing industries (except internet) | 6.9 | 10.0 | 9.2 | 9.6 |
| Motion picture and sound recording industries | −0.6 | 4.4 | 5.9 | −14.2 |
| Broadcasting (except internet) | 2.2 | 5.2 | 2.0 | −3.3 |
| Telecommunications | −1.3 | −0.8 | 0.0 | 2.2 |
| Data processing, hosting, and related services | 9.5 | 16.7 | 8.1 | 9.4 |
| Other information services | 21.0 | 14.4 | 9.6 | 19.8 |
| Monetary authorities-Central bank | 5.7 | 8.2 | 2.4 | 5.1 |
| Credit intermediation and related activities | 6.1 | 3.9 | 5.8 | 10.4 |
| Securities, commodity contracts, and other financial investments and related activities | 9.9 | 2.4 | 1.5 | 5.1 |
| Insurance carriers and related activities | 6.0 | 5.4 | 4.5 | 6.0 |
| Funds, trusts, and other financial vehicles | 27.8 | 23.8 | 12.6 | 19.2 |
| Real estate | 6.1 | 7.0 | 7.1 | 3.4 |
| Rental and leasing services | 4.1 | 8.1 | 5.1 | −10.9 |
| Lessors of nonfinancial intangible assets (except copyrighted works) | 10.0 | −4.7 | 3.4 | −1.3 |
| Professional, scientific, and technical services | 5.5 | 7.0 | 6.6 | 4.1 |
| Management of companies and enterprises | 6.5 | 5.5 | 4.9 | 0.1 |
| Administrative and support services | 7.0 | 5.4 | 5.4 | −0.1 |
| Waste management and remediation services | 10.8 | 8.1 | 4.1 | 2.4 |
| Educational services | 1.0 | 5.1 | 5.4 | 0.6 |
| Ambulatory health care services | 4.9 | 5.7 | 5.5 | 1.9 |
| Hospitals | 4.0 | 3.9 | 3.8 | 3.3 |
| Nursing and residential care facilities | 2.2 | 4.4 | 3.4 | 5.9 |
| Social assistance | 6.1 | 6.8 | 8.3 | 6.2 |
| Performing arts, spectator sports, and related industries | 5.9 | 6.9 | 4.7 | −18.4 |
| Museums, historical sites, and similar institutions | 5.0 | 5.9 | 4.3 | −8.7 |
| Amusement, gambling, and recreation industries | 3.6 | 5.6 | 3.8 | −20.4 |
| Accommodation | 4.1 | 5.0 | 6.1 | −27.8 |
| Food services and drinking places | 5.6 | 5.7 | 5.0 | −21.0 |
| Repair and maintenance | 3.7 | 4.4 | 5.0 | −1.3 |
| Personal and laundry services | 6.8 | 5.6 | 2.9 | −22.4 |
| Religious, grantmaking, civic, professional, and similar organizations | 3.6 | 5.0 | 4.0 | 6.8 |
| Private households | −6.8 | 17.6 | 4.8 | −1.9 |
| Federal civilian | 3.3 | 4.0 | 2.5 | 4.9 |
| Military | 1.0 | −1.7 | 3.5 | 4.6 |
| State government | 3.2 | 3.2 | 3.3 | 2.2 |
| Local government | 2.5 | 4.5 | 2.7 | 1.5 |
| State | 2019 | 2020 | ||||||||||||||
|---|---|---|---|---|---|---|---|---|---|---|---|---|---|---|---|---|
| Personal income | Compensation of employees | Proprietors' income with IVA and CCAdj | Dividends, interest, and rent | Personal current transfer receipts | Contributions for government social insurance | Adjustment for residence | Personal income | Compensation of employees | Proprietors' income with IVA and CCAdj | Dividends, interest, and rent | Personal current transfer receipts | Contributions for government social insurance | Adjustment for residence | |||
| Farm | Nonfarm | Farm | Nonfarm | |||||||||||||
| United States | 720,845 | 487,255 | 3,220 | 18,977 | 109,338 | 162,766 | 60,813 | 102 | 1,205,443 | 119,232 | 39,167 | 19,391 | −36,531 | 1,102,037 | 37,997 | 144 |
| Alabama | 8,877 | 5,333 | −140 | −24 | 1,599 | 2,453 | 426 | 82 | 12,818 | 2,730 | −126 | 340 | −531 | 11,477 | 923 | −149 |
| Alaska | 1,191 | 814 | 2 | −151 | 227 | 406 | 101 | −6 | 1,136 | −314 | 44 | 109 | −164 | 1,449 | −6 | 5 |
| Arizona | 18,292 | 11,216 | 343 | 1,392 | 2,441 | 4,418 | 1,663 | 145 | 34,435 | 9,646 | 403 | 1,686 | 630 | 24,193 | 1,796 | −329 |
| Arkansas | 4,437 | 2,541 | −550 | 372 | 817 | 1,627 | 362 | −7 | 7,845 | 1,850 | −88 | 263 | −538 | 7,075 | 726 | 9 |
| California | 112,413 | 83,308 | −1,932 | 4,356 | 14,667 | 22,798 | 10,612 | −172 | 219,077 | 44,970 | 5,961 | −886 | −2,748 | 177,290 | 5,366 | −144 |
| Colorado | 18,435 | 13,896 | 344 | 577 | 2,921 | 2,288 | 1,632 | 41 | 20,002 | 4,607 | 678 | 333 | −782 | 15,972 | 797 | −8 |
| Connecticut | 6,020 | 3,469 | 68 | −1,224 | 1,074 | 868 | 486 | 2,251 | 9,330 | −168 | 25 | −218 | −1,255 | 11,675 | 144 | −585 |
| Delaware | 1,227 | 1,309 | 26 | −769 | 131 | 628 | 125 | 27 | 2,820 | 151 | −122 | 33 | −115 | 2,721 | 152 | 304 |
| District of Columbia | 667 | 2,761 | 0 | −966 | −79 | 409 | 246 | −1,212 | 4,466 | 1,614 | 0 | 448 | −214 | 3,432 | 106 | −708 |
| Florida | 52,611 | 30,965 | 90 | 877 | 12,858 | 12,299 | 4,543 | 64 | 70,197 | 9,946 | 736 | 6,529 | −601 | 57,265 | 3,665 | −15 |
| Georgia | 25,103 | 14,799 | 252 | 3,859 | 3,689 | 4,289 | 1,922 | 137 | 36,288 | 5,230 | −293 | 1,917 | −1,271 | 32,258 | 1,478 | −74 |
| Hawaii | 2,332 | 1,266 | −2 | 403 | 434 | 525 | 294 | 0 | 4,011 | −2,867 | 53 | 37 | −166 | 6,673 | −281 | 0 |
| Idaho | 5,153 | 2,326 | 669 | 664 | 693 | 1,060 | 327 | 68 | 7,244 | 2,892 | 1,046 | −232 | −17 | 4,155 | 635 | 36 |
| Illinois | 20,445 | 12,565 | −841 | 2,794 | 3,562 | 4,316 | 1,926 | −24 | 43,324 | −2,209 | 3,348 | 1,177 | −2,630 | 45,180 | 589 | −953 |
| Indiana | 12,900 | 5,901 | −230 | 2,722 | 1,552 | 3,539 | 1,161 | 577 | 21,078 | 1,742 | 1,842 | 427 | −635 | 18,375 | 1,248 | 575 |
| Iowa | 3,592 | 2,395 | −1,021 | 41 | 935 | 1,635 | 463 | 72 | 9,517 | 1,552 | 612 | 39 | −523 | 8,202 | 604 | 239 |
| Kansas | 6,005 | 3,177 | −53 | 989 | 867 | 1,422 | 496 | 99 | 8,501 | 1,361 | 1,153 | 13 | −537 | 7,269 | 470 | −290 |
| Kentucky | 7,889 | 4,268 | 391 | 754 | 951 | 1,879 | 301 | −53 | 15,697 | 1,090 | 534 | 173 | −197 | 15,307 | 885 | −325 |
| Louisiana | 6,948 | 2,630 | 139 | 712 | 1,314 | 2,254 | 292 | 191 | 14,268 | −2,921 | 264 | 2,216 | −729 | 15,629 | 345 | 153 |
| Maine | 2,734 | 1,766 | 88 | 95 | 207 | 739 | 218 | 57 | 5,337 | 1,119 | 129 | 42 | −133 | 4,429 | 261 | 12 |
| Maryland | 9,200 | 7,610 | 248 | −3,669 | 1,494 | 2,507 | 895 | 1,904 | 23,124 | 3,355 | −76 | 1,324 | −726 | 19,447 | 400 | 201 |
| Massachusetts | 20,410 | 16,214 | 64 | 3,018 | 2,522 | 1,956 | 2,145 | −1,218 | 34,241 | 2,323 | 46 | −513 | −835 | 33,290 | 276 | 206 |
| Michigan | 15,545 | 7,412 | −86 | 1,171 | 2,634 | 5,540 | 1,115 | −11 | 38,786 | −6,000 | 1,511 | 975 | −579 | 42,800 | −128 | −49 |
| Minnesota | 9,905 | 7,202 | −810 | 222 | 1,929 | 2,408 | 1,016 | −30 | 21,261 | 2 | 3,154 | 1,561 | −1,166 | 18,180 | 536 | 66 |
| Mississippi | 3,518 | 1,796 | 35 | 195 | 327 | 1,363 | 244 | 46 | 8,652 | 1,159 | −85 | 289 | −299 | 8,098 | 492 | −18 |
| Missouri | 11,092 | 7,320 | 578 | 175 | 1,848 | 2,412 | 891 | −350 | 17,473 | 1,897 | 1,458 | 438 | −733 | 14,932 | 1,144 | 626 |
| Montana | 2,623 | 1,048 | 218 | 288 | 533 | 609 | 106 | 34 | 4,048 | 1,076 | 560 | −68 | −153 | 3,053 | 300 | −120 |
| Nebraska | 3,226 | 2,304 | 868 | −1,132 | 678 | 860 | 303 | −49 | 7,115 | 1,533 | 1,814 | 117 | −274 | 4,434 | 495 | −13 |
| Nevada | 9,135 | 5,031 | 93 | 1,675 | 1,496 | 1,714 | 851 | −22 | 9,663 | −2,745 | 74 | −234 | −471 | 12,741 | 102 | 401 |
| New Hampshire | 3,636 | 1,934 | 15 | 816 | 202 | 498 | 297 | 469 | 4,876 | 1,447 | 11 | −215 | −42 | 4,249 | 214 | −361 |
| New Jersey | 22,061 | 12,948 | 235 | 1,046 | 1,882 | 3,703 | 1,614 | 3,862 | 33,433 | 789 | 89 | 1,721 | −773 | 33,614 | 470 | −1,536 |
| New Mexico | 4,007 | 2,503 | 154 | 364 | 352 | 919 | 336 | 53 | 7,064 | −47 | 327 | 82 | −345 | 7,139 | 195 | 103 |
| New York | 45,033 | 37,716 | 744 | −6,037 | 7,002 | 15,529 | 4,133 | −5,789 | 78,577 | −10,804 | 558 | −2,491 | −3,841 | 92,667 | −785 | 1,703 |
| North Carolina | 25,014 | 15,297 | 354 | 2,641 | 3,642 | 5,142 | 2,059 | −3 | 32,772 | 8,198 | 211 | 578 | −255 | 26,538 | 1,930 | −567 |
| North Dakota | 1,598 | 1,190 | −51 | 178 | 185 | 336 | 110 | −129 | 2,669 | −1,048 | 1,629 | 18 | −465 | 2,224 | 35 | 346 |
| Ohio | 17,411 | 12,708 | −733 | −528 | 2,947 | 5,090 | 1,713 | −359 | 40,054 | 1,393 | 1,742 | 1,975 | −1,582 | 37,875 | 1,213 | −135 |
| Oklahoma | 8,793 | 3,823 | 124 | 1,937 | 1,166 | 2,261 | 501 | −17 | 7,185 | −871 | 387 | −725 | −892 | 9,609 | 298 | −24 |
| Oregon | 9,772 | 6,477 | 247 | 93 | 1,664 | 2,287 | 907 | −90 | 17,661 | 3,067 | 1,015 | 353 | −58 | 14,231 | 659 | −289 |
| Pennsylvania | 20,824 | 17,286 | 680 | −3,732 | 3,367 | 5,350 | 1,799 | −327 | 51,564 | −2,637 | 440 | 202 | −737 | 53,849 | 167 | 615 |
| Rhode Island | 2,537 | 1,071 | 1 | 266 | 198 | 566 | 162 | 597 | 4,391 | 183 | 10 | 145 | −71 | 4,165 | 45 | 4 |
| South Carolina | 11,879 | 6,441 | 52 | 862 | 2,252 | 3,013 | 860 | 121 | 16,130 | 1,076 | 141 | 917 | 580 | 13,083 | 443 | 775 |
| South Dakota | 2,516 | 1,112 | −91 | 824 | 431 | 418 | 166 | −12 | 4,373 | 1,121 | 1,889 | −40 | −258 | 2,022 | 344 | −18 |
| Tennessee | 14,801 | 7,889 | 463 | 2,797 | 1,221 | 3,734 | 1,061 | −240 | 16,796 | 4,418 | 283 | −3,002 | −377 | 16,840 | 1,436 | 70 |
| Texas | 60,899 | 50,226 | 858 | −5,719 | 9,181 | 11,517 | 4,801 | −365 | 74,614 | 3,878 | 1,186 | −1,516 | −5,923 | 79,569 | 2,780 | 201 |
| Utah | 11,009 | 6,509 | 130 | 1,464 | 2,270 | 1,500 | 849 | −16 | 12,321 | 6,088 | 210 | 667 | 301 | 6,089 | 982 | −51 |
| Vermont | 1,132 | 557 | 116 | 123 | 49 | 304 | 44 | 28 | 2,325 | −41 | 46 | −6 | −66 | 2,410 | 59 | 40 |
| Virginia | 17,664 | 12,619 | 219 | 1,687 | 1,651 | 4,016 | 1,610 | −917 | 29,655 | 8,207 | 198 | 882 | −1,838 | 23,838 | 1,473 | −158 |
| Washington | 25,584 | 19,019 | 587 | 29 | 3,456 | 3,985 | 1,585 | 93 | 36,600 | 11,243 | 1,980 | 1,008 | −326 | 24,106 | 1,631 | 219 |
| West Virginia | 1,522 | 132 | 41 | 53 | 226 | 647 | −20 | 403 | 4,005 | −1,213 | 49 | 235 | −367 | 5,075 | 161 | 387 |
| Wisconsin | 10,494 | 6,430 | 166 | 464 | 1,783 | 2,489 | 952 | 114 | 16,028 | 792 | 1,898 | 347 | −466 | 14,404 | 740 | −208 |
| Wyoming | 734 | 728 | 61 | −64 | −108 | 244 | 110 | −17 | 595 | −625 | 210 | −80 | −339 | 1,441 | −13 | −25 |
- CCAdj
- Capital consumption adjustment
- IVA
- Inventory valuation adjustment
Updates to previously released estimates
Each September, BEA typically revises the preliminary estimates of annual state personal income released in March in order to incorporate the results of the annual update of the NIPAs and to incorporate state source data that are more complete and more detailed than those previously available (table F). In general, the components of personal income were revised from 1998 to 2020.
The NIPA estimate of U.S. personal income for 2020, after adjustment for differences in geographic coverage and the timing of the availability of source data, was revised down 0.4 percent (table G).8 This national estimate controls the state estimates.9 Table H shows contributions of revisions from components. U.S. personal current transfer receipts contributed 0.14 percent, nonfarm proprietors' income contributed 0.26 percent, and dividends, interest, and rent contributed 0.47 percent to this downward revision. These downward revisions were offset somewhat by a 0.53 percent upward contribution from wages and salaries, and small upward revisions to supplements to wages and salaries, farm proprietors' income, and contributions for government social insurance, contributing 0.04, 0.04 and 0.12 percent, respectively.
The unweighted average revision to 2020 personal income in the 50 states and the District of Columbia was 0.0 percent (table H). The average absolute revision was 1.1 percent.
The largest downward revisions for 2020 were for Hawaii (3.4 percent), Iowa (3.2 percent), and New Jersey (2.4 percent); the largest upward revisions were for North Dakota (3.6 percent) and South Dakota (3.5 percent). Property income (dividends, interest, and rent) and personal current transfer receipts contributed the most to the revision of personal income in Hawaii and New Jersey (table H). Farm proprietors' income and personal current transfer receipts contributed the most in Iowa. In North and South Dakota, the largest contributor to the upward revision was farm proprietors' income.
| Annual estimates | |
|---|---|
| Wages and salaries by industry | |
| In general | QCEW wage data. |
| Farm | USDA farm labor expense data. |
| Agriculture and forestry support activities | USDA farm labor expense data. |
| Rail transportation | RRB state payroll and employment data; Census Bureau ACS Journey to work data. |
| Educational services | CBP payroll data; Official Catholic Directory data. |
| Membership associations and organizations | CBP payroll data; RRB payroll data. |
| Private households | Census Bureau ACS data; Census Bureau population data. |
| Military | DOD personnel data; Coast Guard personnel and payroll data. |
| State and local government | Census Bureau Annual Survey of Public Employment and Payroll data; CES employment data. |
| Employer contributions for employee pension and insurance funds by industry | |
| Rail transportation | FRA casualties data. |
| State and local government | Census Bureau Annual Survey of Public Pensions contributions, pension service charges, and membership data; actuarial data from the CAFRs for a sample of state and local government retirement systems; MEPS employer contributions for health insurance data (certain states only). |
| All other industries | NAIC earned premium data and NASI employers cost of self insurance data; MEPS employer contributions for health insurance data (certain states only). |
| Employer contributions for government social insurance by industry | |
| All industries | Census Bureau State Government Finances data; QCEW data on contributions to unemployment insurance funds; OES data on employee wage distributions; CPS industry data on hours worked. |
| Proprietors' income | |
| Farm | USDA gross income and expense data; ACS gross rental income; USDA ARMS corporate farm income data; Census of Agriculture livestock purchased and corporate farm income data. |
| Nonfarm industries | IRS data on net profits of proprietorships and partnerships; USDA Rural Development net income of agricultural cooperatives; USDA RUS net margin, or profit, of cooperatives that have outstanding loans. |
| Residence adjustment | Census Bureau ACS Journey to work data; IRS wage data. |
| Dividends, interest, and rent | ACS 1-Year PUMS data; IRS income tax data on dividends, taxable interest, S Corporation distributions, gross rents and royalties, and net royalty income; OPM federal civilian retirement payments data; DOD military retirement payments data; SSA Social Security benefits data; FDIC deposits data; NCUA deposits data. |
| Personal current transfer receipts | SSA data on Social Security benefits and Supplemental Security Income benefits; Census Bureau state and local government finance data on disability benefits, income maintenance benefits, state workers' compensation, and education benefits; CMS medical benefits data; DOD medical benefits data; DVA veterans benefits data; USDA data on SNAP and WIC; IRS SOI tax credit data; PBGC benefits data; DOL data on unemployment benefits, black lung disability benefits, and trade adjustment; DOE Pell Grants and enrollment data; HHS data on TANF, foster care and adoption assistance, and energy assistance; Census Bureau population data; Railroad Retirement Board data on retirement and disability benefits and unemployment compensation; among others (For a complete list of source data used, see State Personal Income and Employment: Concepts, Data Sources, and Statistical Methods). |
| Employee and self-employed contributions for government social insurance | SSA Earnings and Employment Data for Workers Covered under Social Security and Medicare and other unpublished SSA data; California state temporary disability insurance data; Census Bureau state temporary disability insurance data; CMS supplemental medical insurance enrollment data; personal contributions for state unemployment insurance data from the states; DVA veterans' insurance premiums data. |
| Personal current taxes | IRS income tax data; Census Bureau quarterly tax collections and state tax collections data; Census Bureau state and local government finance data. |
| Quarterly estimates | |
| Wages and salaries by industry | |
| In general | QCEW wage data; CES employment data. |
| Transportation and warehousing | DOT payroll data. |
| Military | DOD personnel data; Coast Gurard payroll data. |
| Personal current transfer receipts | DOL unemployment rate data; CMS medical benefits data. |
- ACF TANF
- Administration for Children and Families, Temporary Assistance to Needy Families
- ACS
- American Community Survey, Census Bureau
- ARMS
- Agricultural Resource Management Survey
- CAFR
- Comprehensive Annual Financial Report
- CBP
- County Business Patterns, Census Bureau
- CES
- Current Employment Statistics survey, Bureau of Labor Statistics
- CMS
- Centers for Medicare and Medicaid Services
- CPS
- Current Population Survey, Census Bureau
- DOD
- Department of Defense
- DOE
- Department of Education
- DOL
- Department of Labor
- DOT
- Department of Transportation
- DVA
- Department of Veterans Affairs
- FDIC
- Federal Deposit Insurance Corporation
- FRA
- Federal Railroad Administration
- IRS
- Internal Revenue Service
- MEPS
- Medical Expenditure Panel Survey, Agency for Healthcare Research and Quality
- NAIC
- National Association of Insurance Commissioners
- NASI
- National Academy of Social Insurance
- NCUA
- National Credit Union Administration
- OASDHI
- Old-Age, Survivors, Disability, and Hospital Insurance, Social Security Administration
- OES
- Occupational Employment Statistics, Bureau of Labor Statistics
- OPM
- Office of Personnel Management
- PBGC
- Pension Benefit Guaranty Corporation
- QCEW
- Quarterly Census of Employment and Wages, Bureau of Labor Statistics
- RRB
- Railroad Retirement Board
- RUS
- Rural Utilities Service
- SNAP
- Supplemental Nutritional Assistance Program
- SSA
- Social Security Administration
- USDA
- U.S. Department of Agriculture
- WIC
- Special Supplemental Nutrition for Women, Infants, and Children
| State | 2016 | 2017 | 2018 | 2019 | 2020 |
|---|---|---|---|---|---|
| United States | −0.4 | −0.6 | −0.9 | −0.8 | −0.4 |
| Alabama | 0.0 | −0.3 | −0.8 | −0.2 | −0.9 |
| Alaska | 0.2 | 0.1 | −0.6 | −1.4 | −2.0 |
| Arizona | −0.4 | −0.7 | −1.1 | −0.4 | 1.4 |
| Arkansas | 0.9 | 0.6 | 0.4 | 0.5 | 0.3 |
| California | −2.4 | −2.7 | −3.3 | −3.3 | −1.8 |
| Colorado | −0.3 | −0.8 | −1.0 | −0.5 | 0.4 |
| Connecticut | −1.0 | −1.3 | −1.2 | −1.9 | −1.5 |
| Delaware | 0.2 | −0.1 | 0.4 | −1.0 | −1.2 |
| District of Columbia | −1.3 | −1.1 | −0.7 | −2.8 | −0.6 |
| Florida | 0.5 | 0.6 | 0.4 | 1.2 | 0.6 |
| Georgia | 0.5 | 0.4 | −0.1 | 1.2 | 1.2 |
| Hawaii | −2.0 | −2.2 | −2.9 | −2.7 | −3.4 |
| Idaho | −0.4 | −0.7 | −1.7 | −0.4 | 0.3 |
| Illinois | 0.3 | 0.0 | 0.2 | 0.6 | −0.1 |
| Indiana | 0.3 | 0.1 | 0.0 | 0.6 | 1.1 |
| Iowa | 0.0 | −0.1 | −1.2 | −2.4 | −3.2 |
| Kansas | 0.4 | 0.4 | −0.2 | −0.4 | 0.1 |
| Kentucky | 0.4 | 0.2 | −0.3 | 0.4 | 1.8 |
| Louisiana | 0.6 | 0.5 | −0.1 | 0.7 | 1.7 |
| Maine | 0.5 | 0.5 | −0.3 | −0.3 | 0.0 |
| Maryland | −1.1 | −1.2 | −1.7 | −2.4 | −2.1 |
| Massachusetts | −1.0 | −1.3 | −1.6 | −0.9 | −1.6 |
| Michigan | 0.4 | 0.1 | −0.1 | 0.1 | 0.5 |
| Minnesota | −0.3 | −0.5 | −0.6 | −0.7 | 0.8 |
| Mississippi | 0.9 | 0.8 | 0.0 | 0.5 | 0.9 |
| Missouri | 0.3 | 0.2 | 0.4 | 0.7 | 1.0 |
| Montana | 0.6 | 0.3 | −0.3 | 0.8 | 0.1 |
| Nebraska | 0.3 | 0.1 | −0.6 | −1.0 | −0.6 |
| Nevada | −0.2 | −0.7 | −1.0 | 0.9 | 0.2 |
| New Hampshire | 0.3 | 0.2 | −0.1 | 0.5 | 1.0 |
| New Jersey | −1.0 | −0.9 | −1.0 | −1.1 | −2.4 |
| New Mexico | −0.3 | −0.3 | −0.8 | −0.3 | 1.2 |
| New York | −0.9 | −1.3 | −1.8 | −2.4 | −1.4 |
| North Carolina | −0.5 | −0.6 | −0.9 | −0.1 | 0.4 |
| North Dakota | 1.7 | 1.0 | 1.3 | 1.9 | 3.6 |
| Ohio | 0.6 | 0.4 | 0.1 | 0.1 | 0.7 |
| Oklahoma | 1.3 | 1.2 | 1.1 | 2.2 | 1.3 |
| Oregon | −1.2 | −1.5 | −1.8 | −1.4 | −0.8 |
| Pennsylvania | −0.2 | −0.3 | −0.1 | −0.8 | −0.8 |
| Rhode Island | −0.6 | −0.5 | −0.4 | 0.3 | 0.0 |
| South Carolina | 0.5 | 0.3 | −0.3 | 0.2 | 1.1 |
| South Dakota | 0.7 | 0.8 | −0.5 | 1.7 | 3.5 |
| Tennessee | 0.1 | −0.1 | 0.1 | 0.7 | 1.0 |
| Texas | 1.4 | 1.4 | 1.3 | 0.8 | 0.5 |
| Utah | −0.8 | −1.0 | −1.3 | 0.3 | −0.1 |
| Vermont | 0.4 | 0.4 | 0.0 | 0.2 | 0.9 |
| Virginia | −0.6 | −0.7 | −1.6 | −1.3 | −0.7 |
| Washington | −1.3 | −1.7 | −3.0 | −2.7 | −1.8 |
| West Virginia | 1.0 | 0.9 | 0.6 | 0.6 | −0.3 |
| Wisconsin | −0.1 | −0.3 | −0.7 | −0.5 | 0.2 |
| Wyoming | 0.8 | 0.6 | −1.0 | −1.6 | −2.2 |
Note. The annual revisions are calculated from the March 2020 release of State Personal Income.
| Percent revision | Contributions to the revisions (percentage points) | ||||||||
|---|---|---|---|---|---|---|---|---|---|
| State | Personal income | Wages and salaries | Supplements to wages and salaries | Nonfarm proprietors' income | Farm proprietors' income | Dividends, interest, and rent | Personal current transfer receipts | Contributions for government social insurance | Adjustment for residence |
| United States | −0.4 | 0.53 | 0.04 | −0.26 | 0.04 | −0.47 | −0.14 | 0.12 | 0.00 |
| Alabama | −0.9 | 0.47 | 0.06 | −0.53 | 0.21 | 0.02 | −0.95 | 0.17 | −0.03 |
| Alaska | −2.0 | 0.55 | 0.15 | −0.94 | 0.07 | −0.73 | −0.94 | 0.13 | 0.00 |
| Arizona | 1.4 | 0.79 | 0.07 | 0.24 | 0.04 | −0.29 | 0.85 | 0.21 | −0.06 |
| Arkansas | 0.3 | 0.35 | 0.03 | −0.08 | 0.01 | 0.49 | −0.33 | 0.24 | 0.04 |
| California | −1.8 | 0.64 | 0.11 | −0.28 | −0.14 | −2.56 | 0.48 | 0.05 | 0.00 |
| Colorado | 0.4 | 0.73 | 0.09 | 0.06 | 0.07 | −0.56 | 0.14 | 0.13 | 0.00 |
| Connecticut | −1.5 | 0.61 | 0.20 | −0.82 | −0.02 | −1.18 | −0.15 | 0.09 | −0.03 |
| Delaware | −1.2 | 0.44 | 0.07 | −1.77 | −0.03 | 0.60 | −0.81 | 0.15 | 0.47 |
| District of Columbia | −0.6 | 0.84 | −0.05 | −1.77 | 0.00 | −0.86 | 1.47 | −0.23 | −0.42 |
| Florida | 0.6 | 0.38 | −0.18 | −0.65 | −0.09 | 1.43 | −0.15 | 0.11 | −0.01 |
| Georgia | 1.2 | 0.51 | 0.12 | −0.32 | 0.01 | 0.39 | 0.61 | 0.11 | 0.01 |
| Hawaii | −3.4 | 0.04 | 0.41 | 0.23 | −0.02 | −2.25 | −1.69 | 0.15 | 0.00 |
| Idaho | 0.3 | 0.69 | −0.03 | 0.14 | 0.64 | −0.51 | −0.38 | 0.24 | −0.01 |
| Illinois | −0.1 | 0.47 | 0.03 | −0.25 | 0.19 | 0.36 | −0.67 | 0.12 | −0.09 |
| Indiana | 1.1 | 0.47 | 0.16 | 0.30 | 0.36 | 0.14 | −0.14 | 0.30 | 0.14 |
| Iowa | −3.2 | 0.45 | 0.05 | −0.25 | −2.27 | −0.36 | −0.68 | 0.23 | 0.14 |
| Kansas | 0.0 | 0.42 | −0.02 | 0.36 | −0.86 | 0.18 | 0.29 | 0.18 | −0.14 |
| Kentucky | 1.8 | 0.48 | 0.38 | −0.04 | 0.31 | 0.04 | 1.13 | 0.31 | −0.19 |
| Louisiana | 1.7 | 0.55 | 0.17 | 0.45 | 0.09 | 0.21 | 0.52 | 0.35 | 0.02 |
| Maine | 0.0 | 0.51 | 0.05 | −0.17 | 0.14 | 0.01 | −0.43 | 0.19 | 0.06 |
| Maryland | −2.1 | 0.30 | −0.03 | −1.14 | 0.01 | −1.41 | −0.03 | −0.02 | 0.14 |
| Massachusetts | −1.6 | 1.05 | 0.11 | 0.38 | 0.00 | −1.23 | −1.78 | 0.14 | 0.02 |
| Michigan | 0.5 | 0.53 | 0.02 | −0.17 | 0.17 | 0.21 | −0.04 | 0.20 | 0.00 |
| Minnesota | 0.8 | 0.57 | 0.15 | 0.17 | 0.12 | −0.17 | 0.06 | 0.18 | 0.03 |
| Mississippi | 0.9 | 0.54 | 0.21 | −0.44 | 0.27 | 0.05 | 0.55 | 0.22 | −0.05 |
| Missouri | 1.0 | 0.57 | −0.17 | −0.31 | 0.34 | 0.75 | −0.06 | 0.24 | 0.12 |
| Montana | 0.1 | 0.54 | −0.26 | −0.01 | 0.23 | 0.40 | −0.53 | 0.15 | −0.17 |
| Nebraska | −0.6 | 0.41 | −0.25 | −0.97 | 0.55 | 0.12 | −0.32 | 0.19 | 0.00 |
| Nevada | 0.2 | 0.55 | 0.19 | 0.21 | 0.02 | −0.41 | −0.44 | 0.10 | 0.14 |
| New Hampshire | 1.0 | 0.89 | 0.02 | 0.55 | 0.00 | 0.04 | −0.07 | 0.14 | −0.28 |
| New Jersey | −2.4 | 0.68 | −0.01 | 0.01 | 0.01 | −0.80 | −2.18 | 0.09 | 0.01 |
| New Mexico | 1.2 | 0.70 | 0.28 | 0.21 | 0.09 | −0.79 | 0.92 | 0.26 | 0.02 |
| New York | −1.4 | 0.66 | 0.12 | −0.80 | 0.02 | −1.53 | 0.20 | 0.09 | −0.01 |
| North Carolina | 0.4 | 0.32 | −0.05 | 0.25 | 0.16 | −0.09 | 0.07 | 0.14 | −0.09 |
| North Dakota | 3.6 | 0.15 | 0.36 | 0.19 | 2.34 | 0.46 | 0.12 | 0.46 | 0.45 |
| Ohio | 0.6 | 0.34 | −0.04 | −0.17 | 0.22 | 0.41 | 0.02 | 0.14 | 0.01 |
| Oklahoma | 1.3 | 0.48 | 0.34 | 0.66 | 0.00 | 0.96 | −0.87 | 0.26 | −0.03 |
| Oregon | −0.8 | 0.91 | 0.21 | −0.28 | 0.27 | −1.14 | −0.61 | 0.08 | −0.10 |
| Pennsylvania | −0.8 | 0.51 | 0.02 | −0.49 | 0.05 | −0.08 | −0.79 | 0.04 | 0.03 |
| Rhode Island | 0.0 | 0.61 | 0.20 | 0.11 | 0.00 | −0.15 | −0.77 | 0.05 | 0.02 |
| South Carolina | 1.1 | 0.33 | −0.36 | 0.11 | 0.11 | 0.75 | −0.02 | 0.05 | 0.22 |
| South Dakota | 3.5 | 0.47 | −0.19 | 1.02 | 2.35 | 0.21 | −0.10 | 0.24 | −0.01 |
| Tennessee | 1.0 | 0.63 | 0.11 | 0.06 | 0.09 | 0.20 | 0.08 | 0.22 | 0.03 |
| Texas | 0.5 | 0.33 | 0.00 | −0.70 | 0.07 | 1.22 | −0.30 | 0.11 | 0.02 |
| Utah | −0.1 | 0.77 | −0.01 | 0.42 | 0.03 | −0.13 | −1.16 | 0.00 | −0.01 |
| Vermont | 0.9 | 0.54 | 0.30 | 0.22 | 0.06 | 0.05 | −0.02 | 0.28 | 0.06 |
| Virginia | −0.6 | 0.42 | 0.08 | 0.06 | 0.06 | −1.14 | 0.08 | 0.10 | −0.10 |
| Washington | −1.8 | 0.30 | −0.13 | −0.16 | 0.23 | −2.13 | −0.01 | −0.08 | 0.06 |
| West Virginia | −0.3 | 0.57 | −0.41 | −0.08 | 0.09 | 0.24 | −0.67 | 0.30 | 0.30 |
| Wisconsin | 0.2 | 0.61 | 0.03 | −0.18 | 0.25 | −0.35 | 0.04 | 0.17 | −0.05 |
| Wyoming | −2.2 | 0.47 | 0.03 | −0.59 | 0.35 | −1.91 | −0.22 | 0.22 | −0.14 |
- Personal income is the sum of wages and salaries, supplements to wages and salaries, nonfarm proprietors' income, farm proprietors' income, dividends, interest, and rent, and personal current transfer receipts less contributions for government social insurance plus the adjustment for residence.
In October 2021, BEA released current-dollar statistics on personal consumption expenditures (PCE) by state for 2020. PCE fell 2.6 percent nationwide in 2020, falling in all states and the District of Columbia except for small increases in Arkansas, Idaho, Montana, and Utah. PCE decelerated in all states and the District of Columbia. The percent changes ranged from a low of −5.8 percent in the District of Columbia to a high of 1.2 percent in Utah (chart 8).

[Click chart to expand]
PCE by state is a household consumption measure that reflects the value of the goods and services purchased by, or on behalf of, households by state of residence. These statistics on households provide an indication of economic well-being as well as information on consumption patterns across states and over time. For example, the statistics show how households allocate their spending between goods and services or between necessities and discretionary items or how consumers adjust their spending to changes in the economy. As a more specific example of this concept, detailed information on PCE by category shows that in 2020, consumption of gasoline and other energy goods in Utah decreased from its 2019 level by $922.3 million and consumption of food services and accommodations decreased by $1.0 billion, while consumption of food and beverages purchased for off-premises consumption increased by $995.7 million. This is consistent with a story of reduced travel and increased social distancing. One may use these figures to determine the extent to which spending on goods and services in these categories was affected in different states and the District of Columbia during a year in which the COVID-19 pandemic was a dominant theme.
The states for which PCE had the largest percent change from 2019 to 2020 include Arizona (−0.2 percent), Arkansas (0.1 percent), Idaho (1.2 percent), Montana (0.4 percent), South Carolina (−0.3 percent), and Utah (1.2 percent). This list includes only states in the Rocky Mountain, Southwest, and Southeast regions. (See table I.)
PCE declined the most in Alaska (−5.7 percent), California (−4.4 percent), the District of Columbia (−5.8 percent), Hawaii (−5.3 percent), Maryland (−4.4 percent), Massachusetts (−5.1 percent), Minnesota (−4.3 percent), and New York (−5.3 percent). This list includes multiple states in the Mideast region and in the Far West region, as well as one in each of the Great Lakes and New England regions.
| State | 2019 | 2020 |
|---|---|---|
| United States | 3.7 | −2.6 |
| Alabama | 4.0 | −0.7 |
| Alaska | 3.1 | −5.7 |
| Arizona | 5.2 | −0.2 |
| Arkansas | 2.7 | 0.1 |
| California | 4.7 | −4.4 |
| Colorado | 5.2 | −0.9 |
| Connecticut | 2.1 | −3.2 |
| Delaware | 3.6 | −2.2 |
| District of Columbia | 3.5 | −5.8 |
| Florida | 4.3 | −2.0 |
| Georgia | 4.0 | −1.9 |
| Hawaii | 3.9 | −5.3 |
| Idaho | 4.3 | 1.2 |
| Illinois | 2.6 | −3.6 |
| Indiana | 2.5 | −1.1 |
| Iowa | 2.1 | −2.4 |
| Kansas | 3.0 | −1.4 |
| Kentucky | 2.7 | −0.9 |
| Louisiana | 3.0 | −1.7 |
| Maine | 3.4 | −1.6 |
| Maryland | 2.5 | −4.4 |
| Massachusetts | 3.5 | −5.1 |
| Michigan | 2.8 | −2.9 |
| Minnesota | 2.9 | −4.3 |
| Mississippi | 1.8 | −0.6 |
| Missouri | 3.0 | −2.4 |
| Montana | 3.5 | 0.4 |
| Nebraska | 2.6 | −1.2 |
| Nevada | 4.8 | −2.3 |
| New Hampshire | 3.6 | −1.8 |
| New Jersey | 3.4 | −2.7 |
| New Mexico | 2.0 | −2.3 |
| New York | 3.9 | −5.3 |
| North Carolina | 5.0 | −0.5 |
| North Dakota | 2.1 | −3.5 |
| Ohio | 2.7 | −2.1 |
| Oklahoma | 2.2 | −1.1 |
| Oregon | 4.5 | −1.3 |
| Pennsylvania | 3.1 | −4.0 |
| Rhode Island | 2.8 | −3.8 |
| South Carolina | 4.3 | −0.3 |
| South Dakota | 3.8 | −0.7 |
| Tennessee | 4.1 | −1.0 |
| Texas | 4.0 | −0.8 |
| Utah | 5.4 | 1.2 |
| Vermont | 2.5 | −3.9 |
| Virginia | 2.9 | −2.7 |
| Washington | 4.5 | −2.4 |
| West Virginia | 2.3 | −2.5 |
| Wisconsin | 2.8 | −2.3 |
| Wyoming | 2.0 | −1.5 |
| Net expenditures abroad by U.S. residents1 | 9.3 | −2.8 |
- Net expenditures abroad by U.S. residents consists of government and private employees' expenditures abroad less personal remittances in kind to nonresidents.
The District of Columbia, in which PCE dropped by 5.8 percent, was impacted by the pandemic particularly hard. The largest sources of the decline in PCE were expenditures on services. Transportation services contributed 1.5 percentage points to the decline, while reductions in food and accommodation services contributed 3.4 percentage points. The other major category in which PCE decreased in the District of Columbia was social services and religious activities, contributing 1.4 percentage points. Together, these three categories accounted for a decline of 6.4 percent, which was partially reversed by the remaining categories, which together contributed an increase in PCE of 0.6 percent. The categories contributing to the large decline in PCE were among those affected most by the COVID-19 pandemic.10
PCE in Utah, which increased by 1.2 percent, balanced an increase in spending on goods with a decrease in spending on services. Spending on goods contributed 2.5 percentage points to the increase in PCE, while spending on services contributed a reduction of 1.3 percentage points. Reductions in services spending were spread among health care and social assistance (0.8 percent), transportation services (0.7 percent), recreation services (1.0 percent) and food services and accommodation (0.8 percent). The categories that drove a large decrease in spending in the District of Columbia contributed less to the change in spending on Utah, and an increase in spending on goods more than made up for the decline in services consumption.
| State | Population growth rate |
|---|---|
| Arizona | 1.78% |
| Arkansas | 0.32% |
| Idaho | 2.12% |
| Montana | 0.98% |
| South Carolina | 1.17% |
| Utah | 1.45% |
| Alaska | −0.33% |
| California | −0.18% |
| District of Columbia | 0.64% |
| Hawaii | −0.61% |
| Maryland | 0.01% |
| Massachusetts | −0.02% |
| Minnesota | 0.31% |
| New York | −0.65% |
Source. U.S. Census Bureau July 1, 2020, population estimates
Table J shows population growth rates for Utah and the District of Columbia. Typically states with the largest growth in PCE tend to have faster-growing populations, while states with slower growth or declines in PCE tend to have slow-growing or declining populations. Nevertheless, population growth trends do not explain all differences in PCE growth. Chart 9 shows PCE in Utah and in the District of Columbia, indexed to 2013. The solid lines represent indexed PCE, while the dotted lines represent PCE extrapolated for 2020 based on the previous year's growth rate. This graph shows that PCE growth in Utah has outpaced PCE growth in the District of Columbia over this period. However, it also suggests that the relatively larger increase in spending in Utah in 2020 was not exclusively due to differences in trends, since PCE in Utah fell less far below trend in 2020 than did the District of Columbia.

[Click chart to expand]
Changes to concepts and methods
Improvements in methods and the addition of new source data resulted in revisions to personal consumption expenditures for 1997–2019. This first major improvement to methods relates to improved measurement of housing services, which BEA now computes using data about individual housing units from the American Community Survey.11 In addition to improving the accuracy and reliability of BEA housing services measures, the new measures provide a more streamlined integrated approach to estimating housing services across BEA's national and regional programs. The second major improvement is use of new source data to conduct the residency adjustment (see box “Personal Consumption Expenditures by State,” below), wherein the PCE by state program applies adjustment factors to the detailed PCE categories rather than to more aggregate categories. The new source data used for residence adjustment are public use microdata from the Consumer Expenditures Survey and credit card spending flows data from Fiserv.12 Additionally, there were improvements in methods and data for the measurement of expenditures on financial services and utilities. All three improvements provide additional accuracy and also allows the publication of data at a finer level of industry detail.
The newly introduced methods provide data users 113 publication lines and detailed information at the NIPA table 2.4.5 level and 124 publication lines and detailed information at the NIPA table 2.5.5 aggregation level by function. New tables are available from 1997 to 2020 for 50 states and the District of Columbia.
Revisions
The October release of PCE by state included updated statistics for 1997–2019. The updated statistics incorporated the results of the 2021 annual update of the NIPAs, newly available and revised regional source data, and improvements in concepts and methods.
New source data incorporated include (years affected in parentheses):
- Quarterly Census of Employment and Wages (BLS) (2016–2020)
- U.S. Census Bureau Census American Community Survey 1-year PUMS file (2001–2019)
- Consumer Expenditure Survey (2015–2019)
- Fiserv Card Transaction data (2015–2019)
- Other source data:
- Census of Government Finances (2016–2019)
- Data from the Federal Deposit Insurance Corporation (2020), the National Credit Union Administration (2020), and the National Association of Insurance Commissioners (2020)
- United States Department of Agriculture/Economic Research Service (2019)
- Bureau of Transportation Statistics (2020), National Association of Rail Passengers (2020)
- BEA Employment (2016–2020)
Current-dollar national PCE was revised down in 2016 (−0.6 percent), 2017 (−0.8 percent), 2018 (−0.6 percent), and 2019 (−0.8 percent) (table K). Between 2016 and 2019, the largest upward revision at the state level was for the District of Columbia, which was revised up in each year between 6.1 percent in 2016 and 6.9 percent in 2019. The largest downward revisions were in Nevada (−7.9 percent in 2016) and in South Dakota (−7.8 percent in 2018 and 2019). The average unweighted revision across states and the District of Columbia ranged from 0.7 percent to 0.9 percent between 2016 and 2019.
| Percent revision | ||||
|---|---|---|---|---|
| State | 2016 | 2017 | 2018 | 2019 |
| United States | −0.6 | −0.8 | −0.6 | −0.8 |
| Alabama | 1.1 | 1.4 | 1.8 | 2.1 |
| Alaska | 1.6 | 1.1 | 1.7 | 1.9 |
| Arizona | 3.6 | 3.1 | 3.4 | 3.9 |
| Arkansas | 0.3 | −0.2 | −0.5 | −1.2 |
| California | −1.0 | −1.2 | −0.9 | −1.3 |
| Colorado | 2.5 | 2.6 | 2.4 | 2.4 |
| Connecticut | −4.0 | −4.1 | −4.4 | −5.1 |
| Delaware | 2.4 | 1.9 | 2.5 | 2.8 |
| District of Columbia | 6.1 | 6.4 | 6.6 | 6.9 |
| Florida | 4.7 | 4.7 | 5.1 | 4.7 |
| Georgia | 2.4 | 2.3 | 2.7 | 3.0 |
| Hawaii | −4.4 | −4.6 | −4.4 | −4.3 |
| Idaho | −4.3 | −4.4 | −3.5 | −3.7 |
| Illinois | −1.7 | −2.1 | −1.7 | −1.9 |
| Indiana | −1.0 | −0.9 | −0.5 | −1.3 |
| Iowa | −1.6 | −2.1 | −1.8 | −1.8 |
| Kansas | 0.3 | 0.4 | 1.0 | 1.3 |
| Kentucky | 1.4 | 1.5 | 2.0 | 1.7 |
| Louisiana | 2.0 | 2.0 | 2.0 | 1.9 |
| Maine | −2.6 | −2.1 | −2.4 | −2.4 |
| Maryland | −1.8 | −2.3 | −1.9 | −2.3 |
| Massachusetts | −2.4 | −2.5 | −2.6 | −2.6 |
| Michigan | 0.8 | 1.0 | 1.6 | 1.4 |
| Minnesota | −1.0 | −1.0 | −1.0 | −1.3 |
| Mississippi | 1.7 | 0.8 | 0.7 | 0.3 |
| Missouri | −0.1 | −0.5 | −0.2 | −0.5 |
| Montana | 0.5 | 0.7 | 1.0 | 0.5 |
| Nebraska | −0.4 | −0.6 | −0.1 | −0.2 |
| Nevada | −7.9 | −7.2 | −6.3 | −5.3 |
| New Hampshire | −3.3 | −3.0 | −2.9 | −3.0 |
| New Jersey | −4.6 | −4.9 | −4.4 | −4.8 |
| New Mexico | −2.5 | −2.2 | −2.1 | −2.4 |
| New York | −4.8 | −4.8 | −4.7 | −4.9 |
| North Carolina | 4.7 | 4.5 | 4.5 | 4.8 |
| North Dakota | −1.5 | −2.6 | −3.9 | −4.6 |
| Ohio | −3.8 | −4.5 | −4.6 | −4.7 |
| Oklahoma | −0.6 | −0.9 | −0.7 | −1.4 |
| Oregon | −2.8 | −2.3 | −2.0 | −1.9 |
| Pennsylvania | 0.5 | 0.3 | 0.6 | −0.1 |
| Rhode Island | −4.5 | −4.9 | −5.0 | −5.3 |
| South Carolina | 5.2 | 5.4 | 5.6 | 5.9 |
| South Dakota | −7.3 | −7.4 | −7.8 | −7.8 |
| Tennessee | 2.1 | 1.7 | 1.5 | 1.6 |
| Texas | 0.8 | 0.5 | 0.2 | −0.2 |
| Utah | −4.8 | −4.8 | −5.0 | −5.3 |
| Vermont | −1.1 | −1.4 | −0.8 | −0.2 |
| Virginia | −4.2 | −4.8 | −4.6 | −5.0 |
| Washington | −0.9 | −0.9 | −0.4 | −1.2 |
| West Virginia | 2.2 | 1.8 | 2.4 | 2.0 |
| Wisconsin | −3.2 | −3.2 | −2.7 | −2.7 |
| Wyoming | −0.1 | −0.5 | −1.2 | −1.8 |
| Net expenditures abroad by U.S. residents1 | 0.0 | 0.0 | 0.8 | 0.7 |
Note. Percent revision from preceding period was calculated from unrounded data. Expenditures may not sum to higher level aggregates because of rounding.
- Net expenditures abroad by U.S. residents consists of government and private employees' expenditures abroad less personal remittances in kind to nonresidents.
- See Dunn, Abe, Kyle Hood, and Alexander Driessen, “Measuring the Effects of the COVID-19 Pandemic on Consumer Spending Using Card Transaction Data,” BEA Working Paper Series, WP2020-5, April 2020.
- See, for example, Friesen, Garth “No End In Sight For The COVID-Led Global Supply Chain Disruption,” Forbes, September 3, 2021.
- See “The 2021 Annual Update of the National Income and Product Accounts,” Survey of Current Business 101 (August 2021).
- See How will the expansion of unemployment benefits in response to the COVID-19 pandemic be recorded in the NIPAs?, How are federal economic impact payments to support individuals during the COVID-19 pandemic recorded in the NIPAs?, and How does the federal response to the COVID-19 pandemic affect BEA's estimates of personal interest payments? for additional details.
- See https://www.bls.gov/charts/employment-situation/civilian-unemployment-rate.htm.
- The Coronavirus Food Assistance Program, initially established by the CARES Act, provides direct support to farmers and ranchers where prices and market supply chains have been impacted by the COVID-19 pandemic.
- The Paycheck Protection Program, initially established by the CARES Act, provides forgivable loans to help small businesses and nonprofit institutions make payroll and cover other expenses. It also provides funding to reimburse private lending institutions for the costs of administering these loans. For more information, see How does the Paycheck Protection Program impact the national income and product accounts (NIPAs)?
- For more information about the adjustments, see the box “Personal Income in the NIPAs and State Personal Income.”
- The components of NIPA personal income are estimated independently of the components of state personal income, often using data sources that are not available for states. To reconcile the sum of state estimates with the adjusted NIPA estimates, the state estimates are adjusted proportionately. In other words, the adjusted NIPA estimates control the sum of the state estimates.
- See Dunn, Abe, Kyle Hood, and Alexander Driessen, “Measuring the Effects of the COVID-19 Pandemic on Consumer Spending Using Card Transaction Data,” BEA Working Paper Series, WP2020-5, April 2020.
- See Rassier, Dylan G., Bettina H. Aten, Eric B. Figueroa, Solomon Kublashvili, Brian J. Smith, and Jack York (2021), “Improved Measures of Housing Services for the U.S. Economic Accounts,” Survey of Current Business, May 2021.
- A credit card intermediary company that provides detailed information on location of the consumer along with location of the firms.